Abstract
Background:
Since 1990, there has been significant research devoted toward development of a noninvasive physiological glucose sensor. In this article, we report on the use of optical polarimetry for the noninvasive measurement of physiological glucose concentration in the anterior chamber of the eye of New Zealand white (NZW) rabbits.
Method:
Measurements were acquired using a custom-designed laser-based optical polarimetry system in a total of seven NZW rabbits anesthetized using an isoflurane-only anesthesia protocol. Aqueous humor-based polarimetric measurements were obtained by coupling light through the anterior chamber of the eye. Blood glucose levels were first stabilized and then altered with intravenous dextrose and insulin administration and measured every 3–5 min with a standard glucometer and intermittently with a YSI 2300 glucose analyzer. Acquired polarimetric glucose signals are calibrated to measured blood glucose concentration.
Results:
Based on a total of 41 data points, Clarke error grid analysis indicated 93% in zone A, 7% in zone B, and 0% in zones C and D, with reference concentrations between 93 and 521 mg/dl. Errors in prediction are shown to be related to gross movement of the rabbit during the procedures, incurring time-varying corneal birefringence effects that directly affect the measured polarimetric signal. These effects can be compensated for with appropriate design modifications.
Conclusions:
An optical polarimetry technique was used for in vivo physiological glucose monitoring. The technique demonstrated provides a basis for the development of a noninvasive polarimetric glucose monitor for home, personal, or hospital use.
Keywords: aqueous humor, blood glucose, diabetes, polarimetry
Introduction
Diabetes is a common and serious chronic disease that can result in significant swings in blood glucose concentration. These variations in glucose normally result from problems associated with insulin production, action, or a combination of both.1 Complications arising from diabetes, especially those related to elevated glucose, include increased risk of heart disease and stroke, high blood pressure, blindness, kidney disease, and neuropathy. Diabetes affects all ages and races of individuals, and as of 2007, over 23.6 million children and adults in the United States (7.8% of the population) were afflicted with this disease.1 Furthermore, it is estimated that 57 million Americans have some form of prediabetes, with 1.6 million new cases being reported each year. To minimize complications associated with this disease, it is recommended that diabetes patients monitor their blood glucose levels multiple times daily, such that corrective actions can be taken through insulin treatment, medication, and/or diet to maintain tight control of blood glucose concentration.
In the United States, only invasive methods are currently approved by the Food and Drug Administration to monitor blood glucose levels, which usually require the lancing of a finger to obtain a blood sample for testing. Because this approach is often cumbersome and has associated pain and discomfort, patient compliance is normally below what is deemed acceptable, leading to poor glycemic control. However, great strides have been made in the noninvasive measurement of physiological glucose. Optical methods are on the forefront of the approaches being applied for its detection and monitoring and include near-infrared, far-infrared,2–5 Raman,6 and fluorescence spectroscopic techniques,7 as well as other approaches, including confocal reflectometry,5 optical coherence tomography,8 and polarimetry.9–17 This article focuses on the use of optical polarimetry for in vivo noninvasive glucose monitoring.
In the 1800s, two French physicists by the names of Dominique François Arago and Jean Baptiste Biot were the first to investigate the branch of science known as stereochemistry. This laid the foundation for the first documented use of polarized light in the 1900s to quantify sugar concentration and purity as related to industrial sugar production processes. It has been only since the 1980s, however, that the use of polarized light has been considered as a potential method for the physiological measurement of glucose. This initiative began in the early 1980s when March and colleagues9,17 proposed the application of this technique in the aqueous humor of the eye in the hope of developing a noninvasive blood glucose sensor. Their findings, based in part on prior work done by Pohjola,18 indicated that aqueous humor glucose levels correlated well to those of blood. In the two decades that followed, motion artifact coupled to corneal birefringence, low signal-to-noise ratio, and the potential time lag between blood and aqueous humor concentrations during rapid glucose changes were areas of focus in the field. Throughout the 1990s, the majority of research was concentrated toward improving the stability and sensitivity of the polarimetric approach, using various techniques while addressing the issue of signal strength and establishing the feasibility of predicting physiological glucose concentrations in vitro, even in the presence of optical confounders.10,11,13,14 Faraday-based polarimeters, as used in this study, have demonstrated enough sensitivity to accurately measure rotations in the electric field caused by glucose below 0.4 millidegrees rotation, which is equivalent to less than 10 mg/dl of glucose concentration assuming a 1 cm path length and red-light emission source. This is well within the range to monitor physiological glucose levels.10,14 In an investigation reported on by Cameron and associates19 in 2001, the identified time lag between blood and aqueous humor glucose levels was found to be less than 5 minutes in a New Zealand white (NZW) rabbit model, a finding similar to that observed in this study. Methods to overcome issues associated with corneal birefringence have also been addressed using active feedback technologies.12 In this study, we report on the use of Faraday-based optical polarimetry for noninvasive in vivo measurement of physiological glucose concentration in the anterior chamber of the eye in NZW rabbits. This is one of the first reported investigations that demonstrates the use of optical polarimetry for eye-based in vivo glucose measurements across multiple animals and is part of an ongoing effort to commercialize a noninvasive glucose sensor for home-based personal or hospital use.
Methods
Experimental Setup
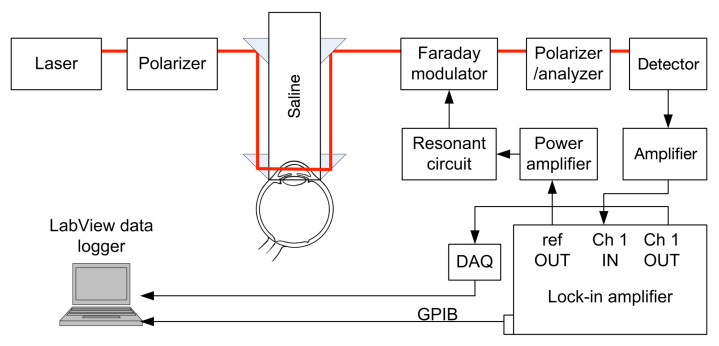
A block diagram of the system designed and implemented during this research is depicted in Figure 1. The light source is an unpolarized red helium–neon laser emitting 5 mW of power at a wavelength of 632.8 nm. The light is then linearly polarized by a Glan–Thompson 100,000:1 polarizer (ThorLabs, Inc., Newton, NJ) oriented in a direction that remains linearly polarized upon propagation through the eye. Because the cornea of the eye possesses birefringence and acts as an optical retarder, linearly polarized light propagating through the corneal portions of the eye will, in general, become elliptically polarized due to the phase retardance. Previous studies indicated that the birefringent corneal portions in the rabbit eye all have a relatively universal fast axis located approximately 160° from the vertical axis, defined as a line that runs from the apex of the cornea through the pupil.14 Propagating a polarized light source parallel to this axis allows the linear polarization to remain linear, therefore leaving only the effects of the optically active glucose that will rotate the linear polarization vector. The polarization vector is then modulated by a custom-designed Faraday modulator consisting of a terbium gallium garnet crystal centered in a 700-turn inductor. The Faraday modulator is primarily an inductive-resistive circuit, and to improve its efficiency, a capacitive circuit is connected in series so that the modulator is driven at its resonant frequency of 976 Hz. This results in a modulation depth of approximately ±1°. The 976 Hz sine wave is provided by a digital lock-in amplifier (Stanford Research Systems, SR830, Sunnyvale, CA) and amplified by a power amplifier (Marchand Electronics, model UT01, Rochester, NY). The polarization-modulated light is converted to intensity modulation by a second Glan–Thompson 100,000:1 polarizer, which is oriented 90° with respect to the initial polarizer. The second polarizer functions as the analyzer and provides an intensity-modulated optical signal that terminates on a silicon photodiode detector (ThorLabs, Inc.,). The detector outputs a voltage that is proportional to the intensity of the detected light, and this signal is amplified and provided as an input to the lock-in amplifier.
Figure 1.
. The polarimetric experimental setup employed for the sensing glucose concentration in the eye. DAQ, data acquisition; GPIB, general purpose interface bus.
The lock-in amplifier outputs the amplitude of the signal at 976 Hz via the general purpose interface bus at a sample rate of 1 Hz to a computer. A data collection program written in LabVIEW version 9.0.1 (National Instruments, Austin, TX) stores the information. Additionally, the analog output of the lock-in amplifier is sampled by a data acquisition system (National Instruments, USB-6211) at a rate of 1 kHz in order to quantify high-speed changes in the polarimetric signal due to motion artifacts caused by the respiratory and cardiac cycles.
Optical Signal Intensity Model
The intensity of the detected linearly polarized light has been previously derived and is described as
| (1) |
where ωm is the modulation frequency, θm is the modulation depth of the Faraday modulator, and f is the rotation due to the glucose.12 The detected signal consists of a DC term, a term at the modulation frequency, and a frequency-doubled term. In the absence of polarization rotation due to glucose, only the DC term and the 2ωm term remain. The amplitude of the signal at the modulation frequency is detected by the lock-in amplifier and is proportional to the glucose concentration within the aqueous humor of the eye.
Rabbit Experimental Protocol
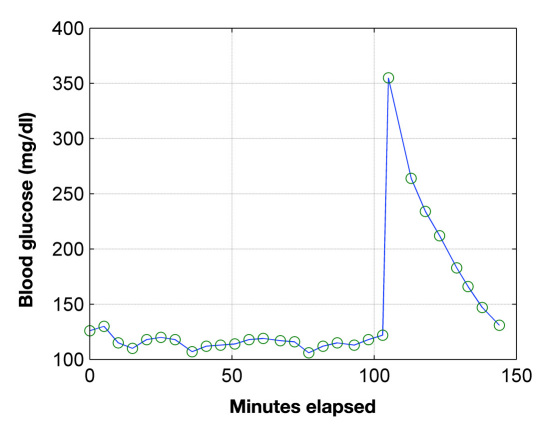
This study was approved by the NAMSA Ohio Division Institutional Animal Care and Use Committee prior to the conduct of the study. Seven NZW rabbits, weight ranging from approximately 4.9 to 5.9 kg obtained from Myrtle’s Rabbitry (Thompson Station, TN) were utilized for this study. Animals were housed in stainless or polymer caging with suspended flooring and acclimated to the facility for a minimum of 5 days. Animals were fed a commercial high-fiber rabbit diet (Prolab 5P25) and had ad libitum access to water by automatic watering. Rabbits with relatively large eyes were chosen for this study to facilitate the optical coupling through the anterior chamber with the noninvasive polarimetric device. The animals were fasted for 20–24 hours prior to the study and anesthetized with isoflurane only. Prolonged fasting minimized the effect of residual food in the gastro-intestinal tract and provided a minimum baseline glucose level for the start of the study. Isoflurane anesthesia was induced in a chamber and maintained by mask; general anesthesia was maintained with 1–3% isoflurane in oxygen. The isoflurane-only anesthesia protocol reduced potential drug-induced effects on glucose metabolism that can occur with other sedatives and anesthetic agents.19 Rabbits were maintained on a heated, circulating water blanket, and body temperature, heart rate, oxygen saturation, electrocardiogram, and respiration were monitored. Following induction of anesthesia, a 3.5 Fr catheter was placed by surgical cutdown into the femoral vein and advanced to the caudal vena cava. The catheter provided rapid, repeatable blood samples at 3–5 minute intervals to monitor blood glucose levels. These levels were monitored to determine a stable level and then altered with intravenous dextrose and insulin administration. When a stable glucose level had been established, a bolus of Humalog insulin at a dose of 0.0002 U/kg was given, followed by an infusion at a rate of 0.0002 U/kg/min. Following initiation of the insulin infusion, 5% dextrose was given intravenously at a dose of 0.5 g/kg body weight as a slow bolus to elevate blood glucose levels. Depending on the specific animal and observations made during the experiment, slight variations of the protocol may have been used. Exogenous insulin was employed in this investigation to allow for a maximum glycemic range to be obtained within the limited time window that the animals were able to be kept under anesthesia. Throughout the dextrose and insulin administration, blood glucose was measured with a standard glucometer (One Touch® Ultra®, Lifescan, Inc., a Johnson and Johnson Co., Milpitas, CA) and intermittently with a YSI 2300 glucose analyzer (Yellow Springs Instruments, Yellow Springs, OH). Samples collected for YSI analysis were not performed immediately; therefore, 2 ml volume Gray Cap (BD Inc, New York, NY) vacutainers were used. These are designed for clinical glucose determination and contain oxalate, sodium fluoride, and other chemical reagents to minimize blood coagulation and inhibit glucose metabolism. Immediately following the conclusion of data collection and prior to recovery from anesthesia, animals were euthanized with an overdose of barbiturate. A typical blood glucose response measured with the glucometer is shown in Figure 2. It should be noted that the spike occurring at 105 minutes is due to the bolus injection of dextrose, as described in the aforementioned protocol, which was used to rapidly increase the blood glucose concentration. This provided a unique glucose signature that was able to be identified with the noninvasive polarimetric glucometer.
Figure 2.
Example of blood glucose concentration produced with intravenous dextrose and insulin administration.
Eye Coupling
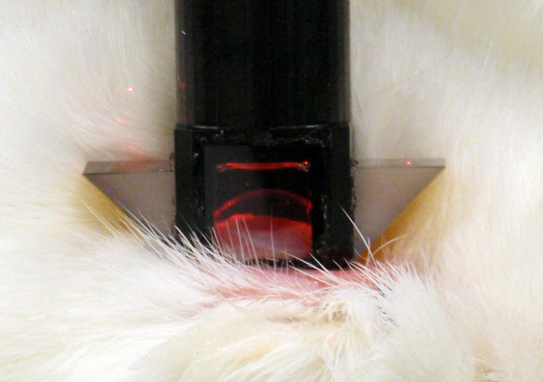
A custom eye-coupling apparatus was designed to route the light through the aqueous humor. The overall approach is similar to that originally reported by Cameron and coworkers.11 The apparatus is applied with light pressure to the eye in order to minimize eye motion and then filled with saline solution for refractive-index-matching purposes. Figure 3 is a photograph that demonstrates the ability of the device to couple a light beam through the anterior chamber of the eye. The slight scattering of the laser beam can be noted at the entrance and exit corneal surfaces of the eye in a position of optimal routing. A slight outline of the actual cornea can also be seen through the observation window just below the top of the coupling-fluid surface. After light coupling is achieved, the entrance polarization angle along with the exit analyzer is adjusted by rotating the corresponding optics to optimize the overall detected signal-to-noise ratio.
Figure 3.
. The coupling of the glucose-sensing optical signal through the aqueous humor of a NZW rabbit.
Data Analysis
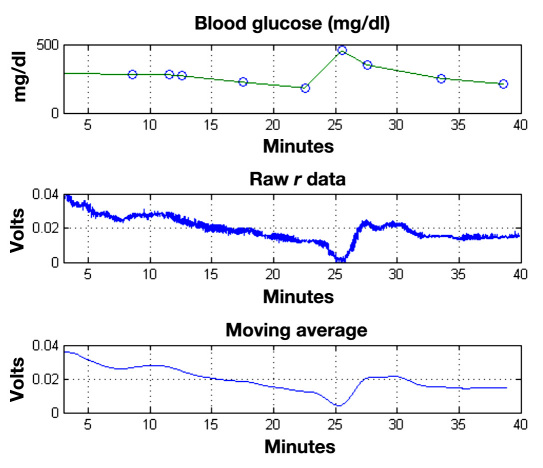
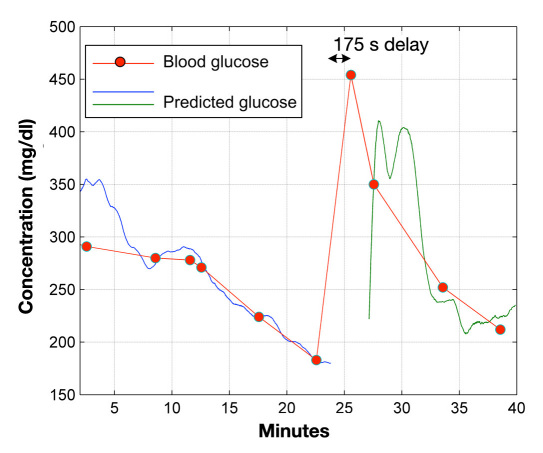
The time-varying polarimetric signal is averaged to remove noise and then filtered to remove sections of data corrupted by gross animal movement or other changes that disrupt the laser beam path. A least squares linear regression is performed in MATLAB™ with a subset of blood glucose measurements and the corresponding polarimetric signal data for each individual rabbit to determine a model of the form Gpred = b1 + b2*[V(t)], where V(t) is the averaged polarimetric voltage measured by the lock-in amplifier as a function of time, b1 and b2 are the coefficients calculated by the least squares regression analysis, and Gpred is the predicted glucose concentration that results when all the time-averaged polarimetric signal data are evaluated by the calibration model. Figure 4 shows an example of 40 minutes of data collected from one rabbit, which includes the blood glucose profile measured with the handheld glucometer, the raw polarimetric signal detected by the lock-in amplifier, and a 60 seconds moving average polarimetric signal. As can be seen, the polarimetric signal visibly tracks the blood glucose concentration. For this rabbit, Figure 5 shows the resulting predicted glucose concentration obtained by the least squares regression analysis. The red line connects the actual measured blood glucose data points. Two intervals of data are plotted, as excessive motion artifact caused a shift in the signal at minute 24. The double peak that occurs in the predictive glucose measurement at 27–30 minutes appears to be further due to motion artifact that was detected in the polarimetric signal. This is, therefore, misinterpreted as a variation in glucose concentration. Overall, the resulting predicted glucose concentrations for all animals are determined and then plotted on a Clarke error grid chart. It should be noted, however, that the data used for the polarimetric glucose predictions are not corrected for the inherent time delay that exists between the blood and aqueous humor glucose concentrations. Lastly, some of the data points do have corresponding YSI glucose analysis that were used for comparative purposes only. The YSI measurements are limited to only a few collections per rabbit because of the amount blood required by the sampling and analysis procedure to ensure animal stability throughout the course of the investigation.
Figure 4.
Blood glucose concentrations (top), raw polarimetric signal data (middle), and 60-second time-averaged polarimetric signal data (bottom) for one rabbit over a 40-minute experiment.
Figure 5.
The predicted glucose concentration from the detected polarimetric signal for a single rabbit. The red marks/line represent the actual blood glucose measurements for comparison.
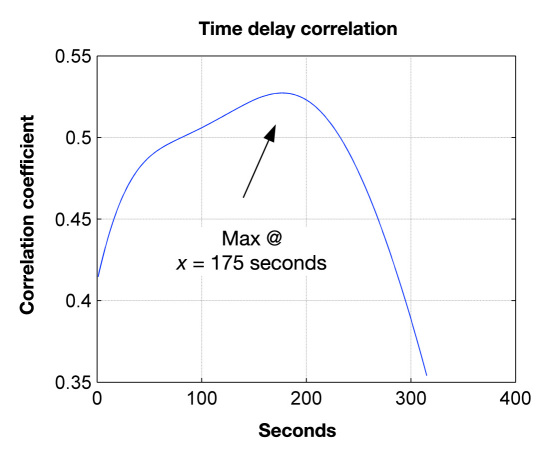
Ocular glucose concentration is correlated to blood glucose; however, as previously mentioned, there is a time delay before the changes in ocular glucose concentration tracks blood glucose. In a separate analysis to quantify this time delay, the polarimetric data are incrementally translated in time and then correlated to blood glucose data at each increment. The maximum correlation is obtained when the two data sets coincide in time. The process was used to identify the inherent time delay present for each respective animal used in this study.
Results
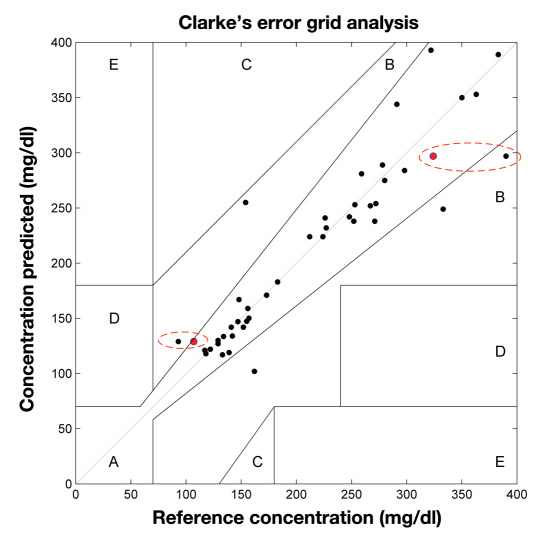
Based on a total of 41 data points collected over the seven rabbits used in this study, Clarke error grid analysis (CEGA) indicated 93% in zone A, 7% in zone B, and 0% in zones C and D as depicted in Figure 6. The reference blood glucose concentrations were those obtained by the handheld glucometer every 3–5 min during the test, with two of the points shown additionally as having YSI analysis. These two points are circled on the figure and show that the predicted glucose concentration was closer to the YSI obtained value than the glucometer-obtained measurement. It is expected that the handheld glucometer measurements are less accurate than those taken with the YSI. For these experiments, the difference in reported glucose concentration between the devices had a standard deviation of 4.9% and a mean difference of 17%. Due to the inherent error of the handheld glucometer used for calibration purposes in this study, this may also contribute an additional error factor in the polarimetric glucose predictions.
Figure 6.
Clarke error grid showing 41 points, with 93% in region A and the remainder in region B. The reference concentrations are from a handheld glucometer (One Touch Ultra, Lifescan Inc.), except for circled points. Circled points additionally have YSI-measured concentrations as reference (red points) and show the predicted values are closer to the YSI measurements than the handheld meter.
All predictive measurements shown in Figure 6 were made without correcting for the inherent time delay between blood and aqueous humor glucose levels. This aspect further demonstrates that it does not appear such corrections are necessary to achieve accurate eye-based blood glucose predictions. For illustrative purposes, however, this inherent time delay for each animal used in this study was estimated. Figure 7 shows the result from one of these time-correlation analyses based on the rabbit data presented in Figure 4. The resultant time delay was 175 s or 2.9 min. For all animals, the time correlation analyses determined that the average delay was 3.87 min, with the range being from 2.9 to 5.4 min.
Figure 7.
Time-delay correlation analysis based on the rabbit data summarized in Figure 4. Correlation analysis indicates that the blood-to-ocular time delay for this rabbit was 175 s.
Discussion
The in vivo polarimetric data acquired in this seven-animal study was limited to a total of 41 points, which consisted of approximately six measurements per rabbit. It should be noted, however, that the prediction of glucose based on the polarimetric signal was performed at a rate of 1 Hz over the experimental duration as illustrated for a single rabbit in Figure 5. The data included in the CEGA, however, were limited to the polarimetric predictions taken at time points corresponding to the acquired reference blood glucose readings. Unfortunately, due to the nature of the blood-sampling protocol as previously described, this limited the number of reference blood samples to approximately six readings per animal. As can also be seen from the CEGA, minimal data are present for reference blood glucose concentrations below 100 mg/dl. This aspect, however, was not by choice nor an indication of sensor performance in the hypoglycemic range. This was a side effect of the anesthesia protocol, which makes it difficult to induce hypoglycemia even with aggressive insulin therapy. In this study, an isoflurane-only anesthesia protocol was chosen to provide reduced potential drug-induced effects on glucose metabolism that can occur with other sedatives and anesthetic agents, such as the more common ketamine and xylazine protocols used in similar studies.19 The isoflurane-only protocol did allow for more stable and overall lower baseline blood glucose levels to be achieved in most cases; however, after surgical placement of the blood-collection catheter and the required optical alignment, the initial blood glucose levels in most cases were well above 100 mg/dl.
During the noninvasive optical glucose measurements, the polarimetric signal that is converted into a time-varying voltage by the photodetector varies linearly with changes in glucose concentration but also detects small changes in birefringence due to rabbit respiratory and cardiac cycles. The respiration and heart rate frequencies appear as a noise in the polarimetric signal but can be successfully averaged out in the analysis of data. This was typically achieved using a 60 seconds moving average, as shown in Figure 4. More problematic effects are incurred by other types of movement, such as that caused by animal repositioning or by facial muscle movement. In these cases, these movements cause the laser beam optical path to shift considerably, which results in significant changes in corneal birefringence. In this study, motion artifacts were minimized by limiting animal motion; however, movements still caused periods of data loss or signal changes not attributable to glucose. Motion-induced corneal birefringence effects can be compensated for by the inclusion of a variable retarder in a closed-loop control system. The variable retarder is used to actively control the phase of the transmitted light, thus converting any elliptical polarization back into linear polarization and negating the effects of birefringence. For more robust in vivo measurements, the optical polarimetric technology employed in this investigation is in the process of being extended to achieve dynamic birefringence compensation. These capabilities include the ability to compensate for real-time birefringence effects through the use of a Faraday and liquid-crystal variable retarder compensation technologies12 coupled to high-speed proportional integral derivative feedback control technology.
Conclusions
An optical polarimetry technique was used for in vivo physiological glucose monitoring in NZW rabbits. The results presented demonstrate the ability of the implemented system to predict blood glucose concentration by sensing the glucose concentration in the aqueous humor of the eye using noninvasive optical methods. For this expanded investigation, the effects of motion artifact and corresponding birefringence effects were minimized by data-processing algorithms and restriction of animal motion, but designs that include active birefringence compensation are presently being developed and evaluated in continuing in vivo experiments. Another main challenge of the demonstrated polarimetric approach is light coupling through the anterior chamber of the eye. In this study, a contact-based coupling method was utilized; however, for such an approach to be commercially viable, a robust noncontact method needs to be developed. Techniques to achieve such coupling are currently under development. Lastly, even though these challenges are present, this study demonstrates that optical polarimetry has the needed sensitivity to measure in vivo physiological glucose concentrations and provides a basis for the potential development of a noninvasive polarimetric glucose monitor for home, personal, or hospital use.
Acknowledgments
The authors acknowledge the Manufacturing Advocacy and Growth Network (MAGNET) based in Cleveland, OH. MAGNET provided instrumentation support for the in vivo polarimeter used in this investigation.
Abbreviations
- (CEGA)
Clarke error grid analysis
- (NZW)
New Zealand white
Disclosure
Brent D. Cameron serves as a consultant to Freedom Meditech, Inc.
References
- 1.Atlanta: U.S. Department of Health and Human Services, Centers for Disease Control and Prevention; 2008. National diabetes fact sheet: general information and national estimates on diabetes in the United States, 2007. Centers for Disease Control and Prevention. [Google Scholar]
- 2.Arnold MA, Small GW. Noninvasive glucose sensing. Anal Chem. 2005;77(17):5429–5439. doi: 10.1021/ac050429e. [DOI] [PubMed] [Google Scholar]
- 3.Cunningham DD, Stenken JA, editors. Vol. 14. Hoboken: John Wiley and Sons; 2009. In vivo glucose sensing. [Google Scholar]
- 4.Coté GL. Noninvasive optical glucose sensing–an overview. J Clin Eng. 1997;22(4):253–259. [Google Scholar]
- 5.Klonoff DC. Noninvasive blood glucose monitoring. Diabetes Care. 1997;20(3):433–437. doi: 10.2337/diacare.20.3.433. [DOI] [PubMed] [Google Scholar]
- 6.Berger AJ, Koo TW, Itzkan I, Horowitz G, Feld MS. Multicomponent blood analysis by near-infrared raman spectroscopy. Appl Opt. 1999;38(13):2916–2926. doi: 10.1364/ao.38.002916. [DOI] [PubMed] [Google Scholar]
- 7.Pickup JC, Hussain F, Evans ND, Rolinski OJ, Birch DJ. Fluorescence-based glucose sonsors. Biosens Bioelectron. 2005;20(12):2555–2565. doi: 10.1016/j.bios.2004.10.002. [DOI] [PubMed] [Google Scholar]
- 8.Larin KV, Motamedi M, Ashitkov TV, Esenaliev RO. Specificity of noninvasive blood glucose sensing using optical coherence tomography technique: a pilot study. Phys Med Biol. 2003;48(10):1371–1390. doi: 10.1088/0031-9155/48/10/310. [DOI] [PubMed] [Google Scholar]
- 9.Rabinovitch B, March WF, Adams RL. Noninvasive glucose monitoring of the aqueous humor of the eye. Part I. Measurement of very small optical rotationsy. Diabetes Care. 1982;5(3):254–258. doi: 10.2337/diacare.5.3.254. [DOI] [PubMed] [Google Scholar]
- 10.Cameron BD, Cóte GL. Noninvasive glucose sensing utilizing a digital closed-loop polarimetric approach. IEEE Trans Biomed Eng. 1997;44(12):1221–1227. doi: 10.1109/10.649993. [DOI] [PubMed] [Google Scholar]
- 11.Cameron BD, Gorde HW, Satheesan B, Coté GL. The use of polarized laser light through the eye for noninvasive glucose monitoring. Diabetes Technol Ther. 1999;1(2):135–143. doi: 10.1089/152091599317341. [DOI] [PubMed] [Google Scholar]
- 12.Cameron BD, Anumula H. Development of a real-time corneal birefringence compensated glucose sensing polarimeter. Diabetes Technol Ther. 2006;8(2):156–164. doi: 10.1089/dia.2006.8.156. [DOI] [PubMed] [Google Scholar]
- 13.Chou C, Han CY, Kuo WC, Huang YC, Feng CM, Shyu JC. Noninvasive glucose monitoring in vivo with an optical heterodyne polarimeter. Appl Opt. 1998;37(16):3553–3557. doi: 10.1364/ao.37.003553. [DOI] [PubMed] [Google Scholar]
- 14.Baba JS, Cameron BD, Theru S, Coté GL. Effect of temperature, pH, and corneal birefingence on polarimetric glucose monitoring in the eye. J Biomed Opt. 2002;7(3):321–328. doi: 10.1117/1.1484163. [DOI] [PubMed] [Google Scholar]
- 15.Ansari RR, Böckle S, Rovati L. New optical scheme for a polarimetric-based glucose sensor. J Biomed Opt. 2004;9(1):103–115. doi: 10.1117/1.1626664. [DOI] [PubMed] [Google Scholar]
- 16.Rawer R, Stork W, Kreiner CF. Non-invasive polarimetric measurement of glucose concentration in the anterior chamber of the eye. Graefes Arch Clin Exp Ophthalmol. 2004;242(12):1017–1023. doi: 10.1007/s00417-004-1031-7. [DOI] [PubMed] [Google Scholar]
- 17.March WF, Rabinovitch B, Adams RL. Noninvasive glucose monitoring of the aqueous humor of the eye. Part II. Animal studies and the scleral lens. Diabetes Care. 1982;5(3):259–265. doi: 10.2337/diacare.5.3.259. [DOI] [PubMed] [Google Scholar]
- 18.Pohjola S. The glucose content of the aqueous humour in man. Acta Ophthalmol (Copenh) 1966;(Suppl 88):1–80. [PubMed] [Google Scholar]
- 19.Cameron BD, Baba JS, Coté GL. Measurement of the glucose transport time delay between the blood and aqueous humor of the eye for the eventual development of a noninvasive glucose sensor. Diabetes Technol Ther. 2001;3(2):201–207. doi: 10.1089/152091501300209552. [DOI] [PubMed] [Google Scholar]


