

Abstract
HLA class I-mediated selection of immune escape mutations in functionally important Gag epitopes may partly explain slower disease progression in HIV-1-infected individuals with protective HLA alleles. To investigate the impact of Gag function on disease progression, the replication capacities of viruses encoding Gag-protease from 60 individuals in early HIV-1 subtype C infection were assayed in an HIV-1-inducible green fluorescent protein reporter cell line and were correlated with subsequent disease progression. Replication capacities did not correlate with viral load set points (P = 0.37) but were significantly lower in individuals with below-median viral load set points (P = 0.03), and there was a trend of correlation between lower replication capacities and lower rates of CD4 decline (P = 0.09). Overall, the proportion of host HLA-specific Gag polymorphisms in or adjacent to epitopes was negatively associated with replication capacities (P = 0.04), but host HLA-B-specific polymorphisms were associated with higher viral load set points (P = 0.01). Further, polymorphisms associated with host-specific protective HLA alleles were linked with higher viral load set points (P = 0.03). These data suggest that transmission or early HLA-driven selection of Gag polymorphisms results in reduced early cytotoxic T-lymphocyte (CTL) responses and higher viral load set points. In support of the former, 46% of individuals with nonprotective alleles harbored a Gag polymorphism exclusively associated with a protective HLA allele, indicating a high rate of their transmission in sub-Saharan Africa. Overall, HIV disease progression is likely to be affected by the ability to mount effective Gag CTL responses as well as the replication capacity of the transmitted virus.
INTRODUCTION
Understanding immune determinants of the rate of progression to AIDS in HIV-1-infected individuals is critical to vaccine research. Host and viral factors may influence disease progression (reviewed in references 13 and 30). It is well known that the host HLA class I profile is an important factor determining clinical outcome (9, 16, 35) although the mechanisms are not fully understood.
The protective effect of certain HLA class I alleles may at least be partially explained by viral attenuation due to escape mutations arising in Gag epitopes targeted by these alleles. Fitness costs have been individually demonstrated for some of the Gag mutations associated with protective HLA alleles (4, 11, 26, 41), and HIV-1 Gag-protease isolated from acutely (3) and chronically infected patients with protective HLA alleles showed reduced function (28, 49).
The extent to which reduced Gag function, and thereby lowered viral replication capacity, impacts HIV-1 disease progression requires further investigation. In chronically infected individuals the number of reverting mutations in Gag associated with HLA-B alleles correlated with viral load (27), and in acute infection the numbers of HLA-B-associated HIV-1 Gag mutations in viruses transmitted to HLA-mismatched recipients correlated negatively with viral load set points (17), both indirectly suggesting that Gag mutations with a fitness cost have clinical impact. Studies directly investigating the impact of replication capacity of the early virus as a function of Gag on subsequent disease progression have shown that in HLA-B*57/5801-positive individuals in whom there is viral control, there is reduced fitness of viruses encoding the whole patient-derived Gag p24 or specific Gag mutations associated with these alleles (11, 36). Despite reduced viral replication capacity, in HLA-B*57/5801-positive individuals followed up for long periods, there was eventual loss of relative viral control with the progressive development of Gag mutations and attenuation due to simultaneous loss of effective cytotoxic T-lymphocyte (CTL) responses (11). Long-term benefit of reduced viral replication capacity was demonstrated in HLA-mismatched infant recipients of a virus with HLA-B*57/5801-associated Gag escape mutations with few or no compensatory mutations (36), and benefit was similarly shown for at least 1 year in HLA-mismatched adult recipients (10); however, in other studies reversion events resulted in restored fitness and loss of viral control in HLA-B*57/5801-negative recipients of such a virus (11, 42). A more recent study showed reduced viral replication capacity attributed to protease drug resistance mutations and B*57/5801-associated mutations in Gag in HIV-1 subtype B acutely infected individuals of various HLA profiles who subsequently became long-term HIV-1 controllers (29).
We previously showed that the replication capacities of Gag-protease recombinant viruses derived from HIV-1 subtype B and C chronic infections correlated with viral loads and CD4 cell counts in a cross-sectional analysis (3, 49) but not with subsequent rate of CD4 cell decline in subtype C chronic infection (49). In the present study, we tested whether the Gag-protease-mediated replication capacity of viruses in early infection could impact subsequent disease progression in HIV-1 subtype C-infected individuals who were within a similar period postinfection and whether it could also explain differences in the range of disease progression rates in subjects who were neither elite nor viremic controllers. The replication capacities of viruses encoding Gag-protease from 60 individuals were assayed in an HIV-1-inducible green fluorescent protein (GFP) reporter cell line (5) and were correlated with subsequent viral load set points and rates of CD4 decline. Since few studies have measured replication capacity longitudinally, we also assessed differences in Gag-protease-mediated replication capacity over 1 year in conjunction with viral loads and CD4 counts, as well as early cytotoxic T-lymphocyte responses, in 13 patients for whom samples with a 1-year treatment-free time interval were available. We found that replication capacities were weakly associated with viral load set points and rates of CD4 decline and remained largely unchanged over 1 year. There was evidence for attenuation of viruses by protective HLA alleles as well as a lack of association with viral control in a subset of individuals with protective HLA alleles, presumably due to increased transmission of associated polymorphisms in the HIV-1 subtype C sub-Saharan Africa epidemic. This suggests the importance of a balance between effective CTL responses and viral replication capacity in influencing disease progression.
MATERIALS AND METHODS
Study subjects.
The study subjects included 60 antiretroviral treatment-naïve individuals in early HIV-1 subtype C infection. Thirty-two were from the HIV Pathogenesis Programme (HPP) Acute Infection Study in Durban, KwaZulu-Natal, South Africa (F. Chonco et al., unpublished data), and 28 were from the Tshedimoso Study in Botswana (33). At screening, 27 subjects from Durban had detectable HIV RNA but had not yet seroconverted (negative enzyme-linked immunosorbent assay [ELISA] and negative Western blot according to CDC criteria) and were defined as acutely infected. The date of infection was estimated to be 14 days prior to screening, as previously described (48). A further five subjects from Durban had an incomplete Western blot at the time of screening that later became complete, and these were defined as recently infected. The date of infection was estimated for two of these subjects by Fiebig staging but was indeterminable for the other three who were screened in Fiebig stage V to VI or VI (15). For acutely infected subjects from Botswana, the number of days postseroconversion were estimated as the midpoint between the last seronegative and the first seropositive test, while for recently infected subjects the calculation was based on Fiebig staging (32). For comparison with the Durban subjects, the number of days postinfection were estimated for the Botswana subjects by adding 22 days to the estimated days postseroconversion since this is the estimated window period (15). Plasma samples from the earliest time point available for use following screening of subjects (5 at Fiebig stage IV, 45 at Fiebig stage V, 7 at Fiebig stage VI, and 3 indeterminable) were the analyzed material for this study. At the available early time points, the median number of days postinfection was 55 (interquartile range [IQR], 43 to 76 days, excluding the three samples for which days postinfection were inestimable). Viral loads were obtained at regular intervals by a Roche Amplicor, version 1.5, assay or by a Cobas TaqMan HIV-1 Test for Durban subjects and a Cobas Ampli-Prep/Cobas Amplicor HIV-1 Monitor Test, version 1.5, for Botswana subjects (34). CD4+ T-lymphocyte counts were also performed regularly by flow cytometry for both Durban and Botswana participants (34). At the available early time points, the median viral load was 5.06 log10 copies/ml (IQR, 4.33 to 5.57 log10 copies/ml), and the median CD4 count was 418 cells/mm3 (IQR, 302 to 524 cells/mm3). The median treatment-free follow-up time of these subjects was 365 days (IQR, 184 to 457 days), and during this time the median rate of CD4 cell decline calculated by linear regression (49) was −7 cells/mm3 per month (IQR, −13 to 1 cells/mm3 per month), and the viral load set point (average viral load from 3 to 12 months postinfection) median was 4.69 log10 copies/ml (IQR, 4.11 to 5.15 log10 copies/ml). Only one subject strictly met criteria for definition of a viremic controller (viral load less than 2,000 copies/ml without treatment for at least three measurements over a 1-year period). HLA class I typing was performed using sequence-based methods (22). Cohort characteristics, including demographic data, are presented in Table 1. Viral loads and CD4 counts did not differ significantly by gender or age, as previously reported (43, 45), and were therefore not controlled for in analyses. Written informed consent was obtained from all study subjects, and the study protocol was approved by the Biomedical Research Ethics Committee of the University of KwaZulu-Natal as well as the Institutional Review Boards of Botswana and the Harvard School of Public Health.
Table 1.
Clinical and demographic characteristics of patients recently infected with HIV-1 subtype C
| Characteristic | Value (IQR) for the parameter |
|---|---|
| Gender (%) | |
| Female | 65 |
| Male | 35 |
| Median age at sampling (yr) | 27 (25–34) |
| Fiebig stage at sampling (% patients) | |
| Stage IV | 8.3 |
| Stage V | 75 |
| Stage VI | 11.7 |
| Unknown | 5 |
| Median viral load at sampling (log10copies/ml) | 5.06 (4.33–5.57) |
| Median CD4 count at sampling (cells/mm3) | 418 (302–524) |
| Median viral load set point (log10copies/ml) | 4.69 (4.11–5.15) |
| Median rate of CD4 decline (cells/mm3 per month) | −7 (−13 to 1) |
| Median follow-up time (days) | 365 (184–457) |
Generation of Gag-protease NL4-3 recombinant viruses and replication assays.
Gag-protease-expressing recombinant viruses were generated from the 60 subjects from the earliest time point available following screening according to published protocols (28, 49). For 13 of the Durban subjects, for whom plasma was available, NL4-3 recombinant viruses expressing Gag-protease (Gag-protease NL4-3) were additionally generated and assayed a median of 1 year (IQR, 0.92 to 1.13 years) later. Briefly, Gag-protease was amplified by nested reverse transcription-PCR (RT-PCR) from extracted plasma HIV RNA. Primers complementary to the Gag-protease-deleted pNL4-3 plasmid were used for Gag-protease amplification, and recombinant viruses were generated by electroporation of an HIV-inducible green fluorescent protein (GFP) reporter T-cell line (5) with the PCR product and pNL4-3 backbone. GFP reporter cells were infected at a multiplicity of infection (MOI) of 0.003, as determined by flow cytometry on a FACSCalibur (BD Biosciences, San Jose). The slope of exponential growth from days 3 to 6, expressed as a natural logarithmic value, was the measure of replication capacity used. Assays were performed at least in duplicate, and replication capacities were divided by the slope of growth of the wild-type NL4-3 control included in every assay; i.e., replication capacities were normalized relative to NL4-3.
Sequencing.
Population (bulk) sequencing of Gag-protease PCR amplicons was performed as previously described (49). Sequences were analyzed on an ABI 3130xl Genetic Analyzer (Applied Biosystems) and were edited in Sequencher, version 4.8. Sequence data were aligned to HIV-1 subtype B reference strain HXB2 (GenBank accession number K03455) using a modified NAP algorithm (19), and insertions with respect to HXB2 were stripped out. HIV-1 subtyping was performed using the REGA subtyping tool (http://dbpartners.stanford.edu/RegaSubtyping/), and all analyzed sequences corresponded to HIV-1 subtype C.
CD8 T-cell responses to HIV-1 Gag optimal epitopes.
CD8 T-cell responses to Gag optimal epitopes were measured by gamma interferon (IFN-γ) enzyme-linked immunospot (ELISPOT) assay using frozen peripheral blood mononuclear cell (PBMC) samples, as previously described (47). The peptide sequences of optimal CD8 T-cell epitopes restricted by each patient's HLA class I alleles were tested for 13 recently infected patients (for whom replication capacity was measured longitudinally) at the earliest available time points and a median of 6.1 weeks (IQR, 5.9 to 7 weeks) later. A response was defined as positive if it was greater than 100 spot forming cells (SFCs)/106 PBMCs after subtraction of the negative-control value plus 3 standard deviations (SD).
Data analysis.
The relationship between replication capacity, viral load set point, and rate of CD4 decline was assessed by Pearson's correlation where variables were both normally distributed and by Spearman's correlation where either variable was not normally distributed. Replication capacities were also compared above and below the median viral load set point and median rate of CD4 decline, as well as in the absence versus presence of each HLA allele expressed by study subjects, by a Student's t test or a Mann-Whitney U test if assumptions of the Student's t test were violated. Pearson's or Spearman's correlation was also used to assess the relationship between the number of HLA-associated polymorphisms in Gag and replication capacity or viral load set point. Where the HLA-associated polymorphism variable was binary (i.e., one polymorphism or none), a Student's t test or Mann-Whitney U test was used for analysis. As an exploratory analysis, the associations between single amino acid residues in Gag-protease and replication capacity were assessed by Mann-Whitney U Tests, and q values were calculated to address multiple tests (44). A paired t test was used to compare replication capacities between different time points for the same patients. The significance cutoff was a P value of <0.05 in all cases.
Nucleotide sequence accession numbers.
Gag-protease sequences obtained in this study are available in the GenBank database under accession numbers HQ696791 to HQ696863. Single-genome Gag sequences were previously obtained for the Botswana subjects (33) and are available in GenBank under accession numbers GQ275380 to GQ277569, GQ375107 to GQ375128, and GQ870874 to GQ871183.
RESULTS
Replication capacities of Gag-protease NL4-3 recombinant viruses.
To assess the impact of HIV-1 Gag-protease function on disease progression, recombinant viruses encoding Gag-protease from patients in early HIV-1 subtype C infection were constructed, and the replication capacities of these were measured. Previously, Gag-protease recombinant viruses generated by this method were representative of the original plasma quasispecies (3, 28, 49). Two randomly selected recombinant viruses were resequenced and were found to be identical to the plasma nucleotide sequences (data not shown). As previously described (49), minor variations in MOIs did not influence replication capacity (Pearson's correlation, r = 0.07 and P = 0.57), and duplicate measurements were highly concordant (Pearson's correlation, r = 0.9 and P < 0.0001) (data not shown). Replication capacities of recombinant viruses encoding Gag-protease from patients in early infection were normally distributed (Fig. 1). The mean replication capacity expressed relative to wild-type NL4-3 was 0.63 (SD of 0.12) and ranged from 0.32 to 0.97, which is comparable to replication capacities of recombinant viruses encoding Gag-protease from chronically infected patients (49) and also did not differ significantly from replication capacities of viruses constructed from approximately 1-year-later time points for 13 of the recently infected patients (Student's t test, P = 0.75) (data not shown).
Fig. 1.

Distribution of Gag-protease NL4-3 recombinant virus replication capacities normalized to the growth of wild-type NL4-3.
Relationship between replication capacity of Gag-protease NL4-3 recombinant viruses and markers of disease progression.
Viral load set point and rate of CD4 decline are significant markers of HIV-1 disease progression (23). Peak viremia occurs in Fiebig stage III, and then there is a decline toward a steady state, which is established during Fiebig stage V or VI (15). The average viral load between 3 and 12 months postinfection was the measure of viral load set point used in this study and could be calculated for 56 of 60 (93%) study subjects. No significant correlation between the viral load set points and replication capacities of the Gag-protease NL4-3 recombinant viruses was observed (Pearson's correlation, r = 0.12 and P = 0.37) (Fig. 2A). Since no significant correlation was observed, the replication capacities of recombinant viruses encoding Gag-protease from subjects with below-median versus above-median viral load set points were next compared to those constructed from subjects with an above-median viral load set point. Patients with below-median viral load set points tended to have viruses with an attenuated Gag-protease function, and this was statistically significant (Student's t test, P = 0.03) (Fig. 2B).
Fig. 2.

Relationships between replication capacities of recombinant viruses encoding patient Gag-protease and markers of disease progression. (A) A positive nonsignificant correlation between replication capacity and viral load set point (Pearson's correlation; n = 56). (B) Significantly lower replication capacities of viruses encoding Gag-protease from patients with below-median viral load set points versus above-median viral load set points (Student's t test; n = 28 for each group). (C) A negative nonsignificant correlation between replication capacity and rate of CD4 decline for subjects with baseline CD4 counts of >300 cells/mm3 (Spearman's correlation; n = 45). (D) Lower replication capacities of viruses encoding Gag-protease from patients with above-median (slower) rates of CD4 decline versus below-median (faster) rates of CD4 decline for subjects with baseline CD4 counts of >300 cells/mm3 (Student's t test; n = 22 and n = 23).
A rate of CD4 decline was then calculated for each subject by linear regression. Baseline CD4 count is a determinant of rate of CD4 decline, and individuals with lower baseline CD4 counts have a subsequently lower rate of CD4 decline (6). Therefore, when analyzing the relationship between rate of CD4 decline and Gag-protease-mediated replication capacity, we considered subjects with a reasonably moderate to high CD4 count (>300 cells/mm3; n = 45) at baseline separately from those with already substantially low CD4 counts at baseline (<300 cells/mm3; n = 15). At higher CD4 counts there was a weak negative trend of association between rates of CD4 decline and replication capacities; i.e., at higher replication capacities the rate of CD4 decline was increasingly negative or faster. However, this trend was not statistically significant (Spearman's correlation, r = −0.25 and P = 0.09) (Fig. 2C). The same trend was not shown for subjects with low baseline CD4 counts, which could be due to limited sample size (n = 15) in this CD4 stratum (Pearson's correlation, r = −0.18 and P = 0.53). When replication capacities were grouped according to the median rate of CD4 decline for subjects with a baseline CD4 count of >300 cells/mm3, the mean replication capacity was lower for subjects with lower rates of CD4 decline, but this was not statistically significant (Student's t test, P = 0.27) (Fig. 2D).
Relationship between replication capacity of Gag-protease NL4-3 recombinant viruses and HLA alleles.
Previous studies have reported few sequence changes in Gag in at least the first 6 months of infection (11, 17). However, for HLA-B*57-positive individuals, associated escape in Gag has been reported as early as 45 days following screening in acute infection (18) although the median reported time in another study was 13 months (11). Although we expected Gag-protease recombinant viruses to be largely representative of transmitted viruses, the possibility of some early selection, particularly by protective alleles, could not be excluded. Therefore, we analyzed the relationship between replication capacities and HLA alleles expressed by the host. No statistically significant associations were found when replication capacities were grouped according to host HLA alleles and compared in the presence versus absence of each individual allele (Fig. 3A, B, and C). However, there was a trend toward lower replication capacities of recombinant viruses encoding Gag-protease from patients with previously described protective HLA alleles in an HIV-1 subtype C setting (22, 46) (n = 10), namely, B*57, B*5801, and B*81 (Student's t test, P = 0.08) (Fig. 3D), suggestive of some early selection pressure. HLA-B*5801 (n = 3) and HLA-B*81 (n = 5) were individually linked to lower replication capacities although not significantly so (Mann-Whitney U test, P = 0.18; Student's t test, P = 0.11) but the same tendency did not apply to HLA-B*57. HLA-B*57 is known to select mutations in Gag that decrease replication capacity (4, 11, 26). However, the Gag-proteases isolated from the two subjects that possessed HLA-B*57 had wild-type ISW9, TW10, and KF11 epitope (restricted by HLA-B*57) sequences, which could explain the observed lack of effect on replication capacity.
Fig. 3.

Associations between HLA alleles and replication capacities of Gag-protease NL4-3 recombinant viruses. (A to C) Graphs show the mean (dot), median (vertical line), interquartile range (edges of boxes), and most extreme values (edges of whiskers) of replication capacities for each different HLA allele. No significant (P < 0.05) associations were found (Student's t test). (D) Lower replication capacities of viruses encoding Gag-protease from patients with protective HLA alleles (n = 10) versus nonprotective HLA alleles (n = 50; Student's t test, no significance).
For the patients analyzed here, viral load set points did not differ significantly between individuals with and without protective HLA alleles (4.4 versus 4.61 log10 copies/ml; Student's t test, P = 0.46). Here, a study limitation should be noted: 12 patients were excluded from this study due to Gag-protease amplification failure (likely as a consequence of limited available plasma); of these 7 had protective HLA alleles, and the median viral load set point of excluded patients was significantly lower than the values for patients included in the study (3 versus 4.69 log10 copies/ml; Student's t test, P < 0.0001).
Relationship between replication capacities of Gag-protease NL4-3 recombinant viruses, polymorphisms in Gag-protease, and viral load set points.(i) Single amino acid associations with replication capacity.
In an exploratory analysis, a Mann-Whitney U test was used to identify specific codons in Gag-protease at which amino acid variants (occurring at a frequency of n ≥5) were associated with increased or decreased replication capacity. Eighteen codons in Gag and two codons in protease with a P value of <0.05 were identified; however, calculated q values were >0.2 in all cases (Table 2).
Table 2.
Amino acids in HIV-1 Gag-protease from recently infected patients associated with alterations in replication capacity
| Proteina | Codon no. | AAb | Consensus | No. of samples |
Replication capacityc |
P | q | HLA association | Epitope | ||
|---|---|---|---|---|---|---|---|---|---|---|---|
| −AA | +AA | −AA | +AA | ||||||||
| Gag p17 | 15 | K | Yes | 31 | 29 | 0.58 | 0.67 | 0.0115 | 0.80 | Yes | |
| 15 | T | 49 | 11 | 0.63 | 0.56 | 0.0425 | 0.80 | Yes | |||
| 28 | H | Yes | 37 | 23 | 0.67 | 0.61 | 0.0291 | 0.80 | B13, B42, C17d | Yes | |
| 82 | V | Yes | 6 | 54 | 0.53 | 0.63 | 0.0086 | 0.80 | Yes | ||
| 82 | I | 53 | 7 | 0.63 | 0.56 | 0.0097 | 0.80 | Yes | |||
| 90 | K | 50 | 10 | 0.64 | 0.54 | 0.0349 | 0.80 | A34e | Yes | ||
| 95 | R | Yes | 14 | 46 | 0.57 | 0.64 | 0.0226 | 0.80 | Yes | ||
| 109 | K | 53 | 7 | 0.62 | 0.75 | 0.0171 | 0.80 | ||||
| 110 | K | 5 | 55 | 0.74 | 0.62 | 0.0168 | 0.80 | ||||
| 115 | T | 10 | 50 | 0.72 | 0.62 | 0.0054 | 0.79 | ||||
| 122 | Yes | 9 | 51 | 0.70 | 0.62 | 0.0346 | 0.80 | ||||
| Gag p24 | 163 | G | 52 | 8 | 0.63 | 0.54 | 0.0383 | 0.80 | B*5703d | Yes | |
| 223 | I | Yes | 41 | 19 | 0.67 | 0.57 | 0.0106 | 0.80 | A*2911e | Yes | |
| 242 | T | Yes | 18 | 42 | 0.59 | 0.67 | 0.0136 | 0.80 | B57, B*5801d | Yes | |
| 242 | N | 43 | 17 | 0.67 | 0.60 | 0.0301 | 0.80 | B57, B*5801d | Yes | ||
| 248 | T | 53 | 7 | 0.62 | 0.75 | 0.0439 | 0.80 | Yes | |||
| 256 | V | 42 | 18 | 0.64 | 0.58 | 0.0496 | 0.80 | C18d | Yes | ||
| 256 | I | Yes | 18 | 42 | 0.58 | 0.64 | 0.0496 | 0.80 | C18d | Yes | |
| 323 | V | Yes | 6 | 54 | 0.76 | 0.62 | 0.0377 | 0.80 | |||
| Gag p2 | 374 | T | 43 | 17 | 0.63 | 0.56 | 0.0309 | 0.80 | B*1503e | ||
| 377 | L | 50 | 10 | 0.64 | 0.53 | 0.0011 | 0.42 | B*5802e | |||
| 377 | M | Yes | 9 | 51 | 0.53 | 0.64 | 0.0011 | 0.42 | B*5802e | ||
| Gag p7 | 389 | I | Yes | 25 | 35 | 0.67 | 0.59 | 0.0192 | 0.80 | ||
| 389 | T | 47 | 13 | 0.62 | 0.71 | 0.0375 | 0.80 | ||||
| Pro | 15 | I | 51 | 9 | 0.64 | 0.54 | 0.0048 | 0.28 | |||
| 15 | V | Yes | 8 | 52 | 0.55 | 0.64 | 0.011 | 0.28 | |||
| 19 | T | 49 | 11 | 0.64 | 0.55 | 0.015 | 0.28 | ||||
Pro, protease.
AA, amino acid.
For the calculation of replication capacity, see Materials and Methods. For alterations in replication capacity, a P value of <0.05 (n ≥ 5) was used.
HLA allele is negatively associated with the consensus amino acid or positively associated with a polymorphism at that codon.
HLA allele is positively associated with the consensus amino acid or negatively associated with a polymorphism at that codon.
(ii) HLA-associated polymorphisms in Gag and replication capacity.
Eight of the associations identified above (all in Gag) corresponded to HLA-associated codons (28H, 90K, 163G, 223I, 242N, 256V, 374T, and 377L) and a further four, although not HLA associated, were situated in Gag epitopes (15T, 82I, 95R, and 248T) (Table 2). Limiting the analysis to HLA-associated positions only (as defined in reference 49), one association achieved statistical significance at a q of <0.2; namely, 377L was significantly associated with lower replication capacities (Mann-Whitney U Test, P = 0.001 and q = 0.06). This polymorphism was negatively associated with HLA-B*5802 in chronic subtype C infection; it did not occur in any of the 68 HLA-B*5802-positive individuals but was present in 32 out of 316 HLA-B*5802-negative individuals (49). The selection or maintenance of the consensus 377M by HLA-B*5802, which is associated with higher replication capacities, could possibly be one of the contributing factors to the detrimental effect of this HLA allele in HIV-1-infected individuals (22, 31).
Consistent with previous reports (4, 11, 26), 242N and 163G were associated with lower replication capacities in the present study (Table 2). Protective alleles HLA-B*5801 and HLA-B*57 select 242N, and HLA-B*5703 selects 163G. Interestingly, only 2 of the 18 individuals that had a virus with 242X (17 with 242N and 1 with 242S) were HLA-B*5801 positive, and none of the 8 with 163G were HLA-B*5703 positive, indicating that these mutations were transmitted to, rather than selected in, the study subjects in nearly all cases. Consistent with previous reports (3), 242X-expressing viruses harboring two or more 242X-associated compensatory mutations—219Q, 223V, 228I, and 248T (4)—displayed higher replication capacities (0.67, n = 3) than those with one or fewer (0.55; n = 15; Mann-Whitney U test, P = 0.04), and 248T was individually associated with higher replication capacities (Table 2).
Codons 223 and 256, which are both associated with changes in replication capacity (Table 2), are in and within six residues of three loops in Gag p24 that interact with host cellular factors, respectively. Amino acids 223V and 256V are included in a group of eight polymorphisms that are significantly associated with polymorphisms in Gag p24 either shown or inferred to carry fitness costs, suggesting that 223V and 256V may be compensatory mutations (12). Consistent with that hypothesis, in this early infection cohort, V instead of the consensus amino acid I (www.hiv.lanl.gov) is the most frequent residue at codon 223, and 223I is associated with decreased replication capacity (Table 2). However, the polymorphism 256V is associated with decreased replication capacity (Table 2).
We next wished to investigate the relationship between the number of HLA-associated polymorphisms in Gag and replication capacity. Each sequence was analyzed firstly in the context of the patient's HLA alleles (the absolute number as well as the proportion of polymorphisms associated with host alleles was computed) and secondly irrespective of the host HLA profile. The overall number of HLA-associated polymorphisms in Gag did not correlate with replication capacity (data not shown). However, when limited to HLA-associated polymorphisms occurring in or within five amino acids of optimal epitopes (more likely to represent escape mutations [17]), there was a significant inverse correlation between the total proportion of host-specific HLA-A, -B, and -C polymorphisms and replication capacity (Spearman's correlation, r = −0.32 and P = 0.04) (Fig. 4A), which appeared to be driven mainly by HLA-B-associated polymorphisms (data not shown). Similarly, when all polymorphisms were included irrespective of host HLA profile, there was also a trend toward lower replication capacities with an increasing absolute number of HLA-B-associated Gag polymorphisms in or adjacent to epitopes (Spearman's correlation, r = −0.25 and P = 0.06; one extreme outlier removed) (data not shown). In summary, overall there was a negative relationship between the number of Gag polymorphisms and viral replication capacity.
Fig. 4.
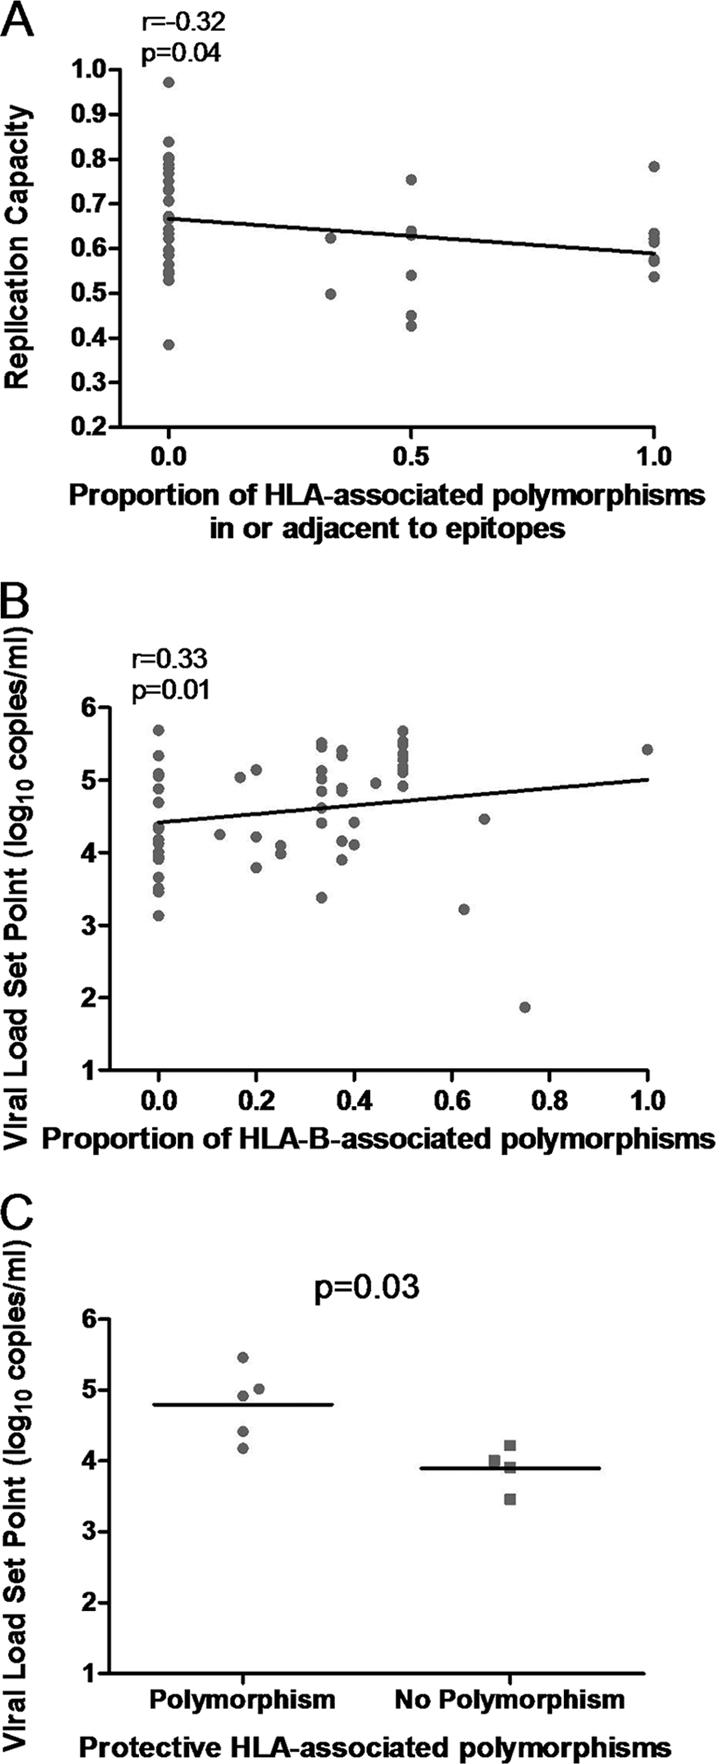
Associations between HLA-associated polymorphisms in patient-derived Gag, replication capacities of recombinant viruses encoding patient Gag-protease, and viral load set points. (A) A significant negative correlation between the proportion of host-specific HLA-associated polymorphisms in or adjacent to Gag epitopes and the replication capacities of recombinant viruses encoding Gag-protease. (B) A significant positive correlation between the proportion of host-specific HLA-B-associated polymorphisms present in Gag and viral load set point. (C) Significantly higher viral load set points in patients with protective HLA alleles that have a polymorphism associated with those alleles in Gag (n = 5) versus those that do not (n = 4; Mann-Whitney U test).
(iii) HLA-associated polymorphisms in Gag and viral load set point.
We next tested whether there was a correlation between Gag polymorphisms and viral load set point, as has been previously described (17). Unexpectedly, the proportion of total host-specific HLA-B-associated polymorphisms and presence of host-specific protective HLA-associated polymorphisms were both positively associated with viral load set point (Spearman's correlation, r = 0.33 and P = 0.01; Mann-Whitney U test, P = 0.03) (Fig. 4B and C). Similar results were calculated for absolute numbers of host-specific HLA-B-associated polymorphisms. Thus, the presence of Gag polymorphisms that could be selected by host alleles was generally associated with higher viral load set points.
Since Goepfert et al. (17) showed that the negative association between the number of HLA-B-associated polymorphisms in transmitted viruses and viral load set point in recipients was stronger when host-specific HLA-associated polymorphisms were excluded, the analysis was repeated the same way here using the same published list of polymorphisms. This analysis showed no significant relationship between transmitted HLA-B-associated polymorphisms and viral load set points (Pearson's correlation, r = −0.1 and P = 0.43) (data not shown) in contrast to positive significant relationships observed in earlier analyses. Also of interest, 5 of 12 subjects for whom Gag-protease amplification failed here and who had very low viral load set points overall had viruses that harbored protective HLA-associated polymorphisms that they could not have selected based on their HLA profiles; and only one of the seven with protective HLA alleles had an associated polymorphism. (Note that extraction and sequencing were performed on these subjects previously [33].) These data are not inconsistent with a benefit to inheriting Gag polymorphisms that could not be selected by host HLA alleles.
(iv) Drug resistance polymorphisms in protease and replication capacity.
Transmitted drug resistance mutations in protease have previously been associated with reduced viral replication capacity (29). Sequences were therefore examined for protease inhibitor resistance mutations listed on the Stanford HIV Drug Resistance Database (http://hivdb.stanford.edu/pages/algs/sierra_sequence.html). Only nine patients harbored protease inhibitor resistance mutations, all of which were minor (T74S in eight cases and T74S and L10V in one case) and were not associated with differences in replication capacity (Student's t test, P = 0.3) (data not shown).
Longitudinal analyses of replication capacities, CD8 T-cell responses, and clinical parameters.
For 13 recently infected subjects, Gag-protease NL4-3 recombinant viruses were additionally generated and assayed from time points approximately 1 year later than the first available time points following screening. Overall, paired replication capacity measurements were not found to be significantly different from one another (paired t test, P = 0.77). In some samples where the replication capacity changed more than 0.1, sequence changes in the Gag protein could partly explain the alteration. For example, in patient AS2-0945 (HLA-B*5703 positive) fitness-reducing mutations 242X (mixture of T, S, and N at this residue) and 146P were selected by 1 year later, with a substantial decrease in replication capacity. Also, in patient AS2-0802 a CTL response to the B*08-restricted epitope EV9 was present at the early time point, and the mutation 75I had developed in this epitope 1 year later. The mutation 75I was previously significantly associated with higher replication capacities (49), and accordingly viral replication capacity increased for this patient.
Viral replication capacities and CTL responses to Gag epitopes were next related to clinical information. Of interest, in patient AS2-0341, replication capacity remained low, but viral load set point and viral load at the later time point were high (4.89 log10 copies/ml and 5.44 log10 copies/ml, respectively). This patient made no detectable CTL responses to Gag epitopes. In contrast, replication capacity remained low in AS2-0174, but this patient mounted CTL responses to nine Gag epitopes, and viral load remained below 3.15 log10 copies/ml from 8 months postinfection onwards (i.e., patient AS2-0174 was a controller). In patient AS2-0945, in whom viral load set point was low (3.46 log10 copies/ml), a detectable CTL response was made to a key epitope in Gag (TW10), and mutations were selected that decreased replication capacity. However, it should be noted that there was a rise in viremia in this patient coinciding with selection of these mutations. In patients AS2-0358 and AS2-1037, although CTL responses were made to Gag epitopes, viremia was not well controlled, and Gag-protease-mediated replication capacities were also high in these patients.
The viral replication capacities, together with CD8 T-cell responses to Gag epitopes, clinical parameters, and patient HLA types, are presented in Table 3.
Table 3.
Longitudinal measurements of Gag-protease-mediated viral replication capacities, Gag CTL responses, and clinical measures from patients recently infected with HIV-1 subtype C, including patient HLA profiles
| Patient no. | Value by time point of:a |
HLA profile | CTL response(s) by time point [epitope(s)-HLA] |
||||||
|---|---|---|---|---|---|---|---|---|---|
| Replication capacityb |
Viral load (log10copies/ml) |
CD4 count (cells/mm3) |
|||||||
| A | B | A | B | A | B | Early | Median of 6 weeks later | ||
| AS1-0703 | 0.6 | 0.58 | 5.15 | 3.88 | 625 | 549 | A*2601 A*3004 B*4403 B*5802 C*0210 C*0602 | AW11-B44 | AW11-B44, QW9-B57 |
| AS1-0919 | 0.75 | 0.71 | 4.65 | 4.43 | 665 | 383 | A*2902 A*7400 B*3501 B*4201 C*0401 C*1700 | TL9-B42 | |
| AS2-0016 | 0.61 | 0.7 | 4.55 | 3.96 | 528 | 537 | A*2601 A*3002 B*1518 B*4201 C*1700 C*1800 | RLY10-A30 | RLY10-A3002, EL9-A26, TL9-B42 |
| AS2-0174 | 0.57 | 0.58 | 5.47 | 2.01 | 361 | 416 | A*2301 A*3002 B*0801 B*1402 C*0304 C*0802 | RLY10-A30, RY11-A30, AF8-A30, DI8-B08, EL8-B08, DA9-B14, CC9-B14, YL9-C03, TL9-C08 | |
| AS2-0341 | 0.5 | 0.43 | 5.86 | 5.44 | 553 | 346 | A*3402 A*6801 B*1503 B*5802 C*0210 C*0602 | ||
| AS2-0358 | 0.97 | 0.82 | 5.18 | 5.34 | 331 | 553 | A*2402 A*3001 B*4202 B*5301 C*0404 C*1700 | HW9-A23 | HW9-A23, SW11-A30, QW9-B53 |
| AS2-0483 | 0.7 | 0.54 | 5.54 | 4.65 | 359 | 440 | A*3001 A*3402 B*1503 B*4201 C*0210 C*1700 | RY11-A30, TL9-B42 | |
| AS2-0802 | 0.32 | 0.65 | 5.11 | 4.27 | 316 | 338 | A*3002 A*4301 B*0801 B*5802 C*0602 C*0701 | RY11-A30, EV9-B08, KF11-B57 | RY11-A30, DI8-B08, EL8-B08 |
| AS2-0945 | 0.62 | 0.46 | 3.66 | 4.51 | 686 | 648 | A*2301 A*7400 B*1510 B*5703 C*0701 C*1601 | TW10-B57 | QW9-B57, GI9-B1510 |
| AS2-1037 | 0.71 | 0.73 | 5.93 | 4.82 | 403 | 219 | A*03 A*3402 B*1503 B*1510 C*0210 C*0304 | VL10-B1510, YL9-C03 | YL9-C03 |
| AS3-0268 | 0.54 | 0.56 | 5.88 | 5.64 | 483 | 419 | A*2902 A*8001 B*1503 B*1801 C*0202 C*0210 | RY11-A29, LY9-A29, VF9-B1503 | LY9-A29, VF9-B1503 |
| AS3-0369 | 0.59 | 0.63 | 4.55 | 4.4 | 485 | 436 | A*6602 A*6802 B*1510 B*4403 C*0304 C*0701 | RL11-B44, AW11-B44, YL9-C03 | YL9-C03, VL10-B1510 |
| AS3-0458 | 0.43 | 0.69 | 4.27 | 4.21 | 488 | 455 | A*2902 A*3402 B*4403 B*5802 C*0401 C*0602 | AW11-B44 | AW11-B44, RY11-A29 |
A, early time point; B, time point a median of 1 year later than time point A.
For the calculation of replication capacity, see Materials and Methods.
DISCUSSION
Recent studies suggest that immune and/or drug-selected mutations in HIV-1 Gag-protease reduce viral fitness, thereby conferring an advantage to recipients of such a virus (10, 17, 29, 36, 40). We thus investigated the relationship between Gag-protease-mediated replication capacity and disease progression in subjects in early HIV-1 subtype C infection who were from southern Africa.
We found a weak association between reduced Gag-protease function in early infection and lower viral load set points as well as lower rates of CD4 decline. This relationship was considerably weaker than in a previous study (29) comparing controllers and noncontrollers infected with HIV-1 subtype B. The difference could possibly be partly explained by the lack of extreme phenotypes at the lower end of the spectrum in the present study. Although we previously demonstrated significant correlations between Gag-protease function, viral loads, and CD4 counts in chronic infection (3, 49), cause and effect could not be confidently determined due to the cross-sectional nature of that analysis. An association between Gag-protease-mediated replication capacity and rate of CD4 decline was not evident in chronic infection (49), but a trend was observed in early infection in the present study. This might suggest that initial replication capacity in early infection has more far-reaching effects than that measured in chronic infection.
Gag-protease recombinant viruses derived from individuals with protective HLA alleles tended to have reduced replication capacities, as was shown previously in acute or early HIV-1 subtype B infection (3), suggestive of some early selection of fitness-reducing mutations in these hosts. In that study (3) the least fit viruses derived from HLA-B*57/5801-positive individuals had more Gag p24 mutations associated with these alleles and were sampled later postinfection than the fitter viruses. Considering the entire present study cohort, those viruses with the protective HLA-associated mutations 242N and 163G (largely selected in previous hosts) had significantly lower replication capacities, further indicating that protective HLA alleles select for attenuated viruses.
However, in contrast to that previous study (3), viral loads were not significantly lower in individuals with protective HLA alleles, and therefore a benefit to reduced Gag-protease function in these particular individuals was not overall evident. In fact, in individuals with protective HLA alleles, viral load set points were overall significantly higher in those who had viruses with associated Gag mutations than in those who did not. Conversely, in six of the seven subjects with protective HLA alleles for whom Gag-protease amplification failed here (but were sequenced previously [33]), there were no Gag mutations associated with the hosts' protective HLA alleles, and the viral load set points were considerably low. It could be that in several cases here, the protective HLA-associated polymorphisms were inherited rather than selected by the hosts' protective alleles, thereby resulting in weakened early CTL responses to key epitopes and a disadvantage to the host, as has been suggested previously (11, 17). There is also the possibility that selection of protective HLA-associated polymorphisms in early infection is disadvantageous due to a subsequent reduction in CTL responses. Supporting the former hypothesis, 23 out of 50 individuals with nonprotective HLA alleles harbored mutations associated exclusively with protective HLA alleles, indicating high-level transmission of these polymorphisms in sub-Saharan Africa. A notable example is the case of 242N which was present in 17 viruses, out of which 15 were derived from individuals without the associated protective HLA-B*57/5801. Further, in one patient with HLA-B*5801 and a high viral load set point (5.46 log10 copies/ml), at 26 days postinfection two associated mutations were present (146L and 242N), at which point none of the viruses in other studies had shown evidence of adaptation in Gag (3, 18). It is also notable that in a patient with HLA-B*81 and a high viral load set point (4.92 log10 copies/ml), the mutation 186S in the TL9 epitope was present; however, there was no detectable initial CTL response to this epitope (data not shown), suggesting that it may have been inherited rather than selected. Yet in another patient (AS2-0945) with HLA-B*5703 and a low viral load set point (3.46 log10 copies/ml), all HLA-B*57-restricted epitopes were initially wild type, and 1 year later mutations 146P and 242N had been selected with a concomitant decrease in fitness although there was also a coincident rise in viremia. A similar rise in viremia following selection of 242N was recently reported in a single patient (33); however, decreased viremia following early selection of the HLA-B*57-associated mutations 242N and 147L has been reported in several patients (11). Taken together, these data imply that the benefit in an individual with a protective allele is derived from an initial effective CTL response and that the subsequent selection of fitness-reducing Gag mutations is likely to, but may not necessarily, contribute to clinical benefit. Further, results suggest that the CTL-driven benefit appears diminished or even lost when protective HLA-associated polymorphisms in Gag are inherited by individuals with the relevant protective alleles, despite reduced viral replication capacity.
The high transmission prevalence of protective HLA-associated polymorphisms in the populations studied supports recent evidence that mutations selected by protective alleles may be accumulating over time (21). This may be particularly evident in the present cohort since HIV infection is most prevalent in sub-Saharan Africa (http://www.who.int/hiv). In KwaZulu-Natal there is an explosive rate of infections in young adults, probably fuelled by the high viral loads in acute infection (1), and consequently transmission may often occur early in infection before such mutations revert. The median reversion time reported for HLA-B*57-associated Gag mutations in HLA-mismatched recipients was 23 months (11), and for 242N most reversions occurred between 6 and 24 months (10). The consequence of this is, first, that HIV-1 is being attenuated over time and, second, that the association of current alleles with slower disease progression may eventually diminish (21).
The number of HLA-associated polymorphisms (mainly attributed to HLA-B) in or adjacent to Gag epitopes was inversely associated with replication capacity; however, as was the case for host-specific protective HLA-associated polymorphisms, unexpectedly the presence of host-specific HLA-B-associated polymorphisms was positively associated with viral load set point. One contributing factor could be the presence of compensatory mutations as no relationship with viral load set point was observed when the analysis was limited to polymorphisms in or adjacent to epitopes. Further, although the host expressed the alleles to select these polymorphisms, it is unlikely that many were selected by the host at such an early stage of infection and that they were largely inherited. Usually, in the Gag protein, the fastest selection occurs in epitopes restricted by the protective HLA-B*57/5801 within about 6 months of infection (7, 18) (but on average at 13 months postinfection according to another study [11]), and reversion events rather than selection of new mutations in Gag predominate in early infection (11, 14). Further, Schaefer et al. showed that in linked transmission pairs most of the HLA-associated polymorphisms present at 1 year after infection were transmitted and not selected by the host (39), and it is estimated that approximately 18% of the possible mutations in Gag are present in transmitted viruses on average (20). Therefore, again these results suggest a host disadvantage to inheriting polymorphisms which the host could have selected, likely due to diminished CTL responses to mutated epitopes, as supported by other studies (11, 17).
Longitudinal measurements of replication capacities and CTL responses to Gag epitopes also support the importance of both CTL responses and viral replication capacity in influencing disease progression. For example, in one patient viral replication capacity was low, but there was a lack of CTL Gag responses and uncontrolled viremia. In others, CTL Gag responses were present, but viral replication capacities were high, and viremia was uncontrolled. Two patients who had low viral load set points showed low replication capacities and either CTL responses to key epitopes (such as TW10) or a very broad Gag response, which has previously been suggested to be beneficial (38). It should be noted that likely explanations for viral load set point based on CTL responses or viral replication capacity could not be made for all patients. Other HIV genes, such as envelope (2), protease, and reverse transcriptase (8), significantly contribute to overall viral replication capacity and may help to explain differences in viral control (24). Indeed, envelope ranks among the most important determinants of viral fitness (2, 25), and several studies provide evidence for overall HIV fitness as a significant determinant of disease progression (8, 37).
Some limitations of the methods used in present study should be noted. First, recombinant viruses constructed were a mixture of HIV-1 subtype B and C genetic components. It is therefore possible that the fitness of recombinant viruses could be a reflection of the compatibility of the subtype C Gag-protease with the subtype B backbone. However, we previously found that the degree of similarity of subtype C Gag to subtype B did not associate with the fitness of subtype C/B recombinant viruses (49). We also found that fitness of subtype C/B recombinants correlated with viral loads and CD4 counts (49) as did subtype B/B recombinants (3), indicating that, despite the mixing of subtypes, the assay was clinically relevant. Second, the possibility that viral replication capacity measurements might differ if primary cells were used cannot be excluded. For example, the fitness cost of the 242N mutation is more pronounced in primary cells than in the CEM-GXR GFP reporter T-cell line, probably due to differences in the level of cyclophilin A expression (4). Despite these differences, the fitness cost of the 242N mutation, as well as the 163G mutation also previously shown to have a fitness cost (11), were detected in the present study, further supporting the relevance of results obtained in the current assay system. Further, although primary cells are not used in the current assay system, it has the advantages of using a homogenous population of cells and of being high throughput, and it has yielded results that correlate with clinical parameters. It should also be noted that parameters other than those measured in the present study, such as T-cell activation, are important markers of disease progression (23), and it remains to be determined whether these additional important parameters that influence HIV-1 pathogenesis might also correlate with viral fitness.
In conclusion, results suggest that replication capacity of the early virus as determined by Gag-protease function influences disease progression in HIV-1 subtype C infection. However, the increasing transmission of polymorphisms, particularly those associated with protective HLA alleles, in the sub-Saharan Africa epidemic has highlighted the complex interplay between effective CTL responses to the Gag protein and reduced Gag function in HIV-1 control.
ACKNOWLEDGMENTS
This research was funded by NIH (RO1-AI067073 and RO1-AI057027), the Bill and Melinda Gates Foundation, the South African AIDS Vaccine Initiative, the South African Department of Science and Technology through the National Research Foundation, and the Ragon Institute Fund for Innovation and New International Initiatives. J.K.W. is funded by the National Research Foundation and the Ragon Institute of Massachusetts General Hospital, Massachusetts Institute of Technology, and Harvard University. Z.L.B. is supported by a New Investigator Award from the Canadian Institutes for Health Research (CIHR). T.N. holds the South African Department of Science and Technology/National Research Foundation Research Chair in Systems Biology of HIV/AIDS. Additional support was provided by the Mark and Lisa Schwartz Foundation.
We thank Taryn Green for technical assistance, Toshiyuki Miura for providing the Gag-protease-deleted NL4-3 plasmid, Johannes Viljoen and Africa Centre laboratory for providing access to tissue culture and sequencing facilities, the Durban clinic staff (Mammekwa Mokgoro, Manjeetha Jaggernath, and Thandi Sikhakane, Nono Nkupiso, Kesia Ngwenya, and Nonhlanhla Maphalala), all HPP acute infection study team members, and the Tshedimoso Study Team. Finally, we thank and acknowledge the study participants.
Footnotes
Published ahead of print on 2 February 2011.
REFERENCES
- 1. Abdool-Karim Q., Abdool Karim S. S. 2002. The evolving HIV epidemic in South Africa. Int. J. Epidemiol. 31:37–40 [DOI] [PubMed] [Google Scholar]
- 2. Ball S. C., et al. 2003. Comparing the ex vivo fitness of CCR5-tropic human immunodeficiency virus type 1 isolates of subtypes B and C. J. Virol. 77:1021–1038 [DOI] [PMC free article] [PubMed] [Google Scholar]
- 3. Brockman M., et al. 2010. Early selection in Gag by protective HLA alleles contributes to reduced HIV-1 replication capacity that may be largely compensated for in chronic infection. J. Virol. 84:11937–11949 [DOI] [PMC free article] [PubMed] [Google Scholar]
- 4. Brockman M. A., et al. 2007. Escape and compensation from early HLA-B57-mediated cytotoxic T-lymphocyte pressure on human immunodeficiency virus type 1 Gag alter capsid interactions with cyclophilin A. J. Virol. 81:12608–12618 [DOI] [PMC free article] [PubMed] [Google Scholar]
- 5. Brockman M. A., Tanzi G. O., Walker B. D., Allen T. M. 2006. Use of a novel GFP reporter cell line to examine replication capacity of CXCR4- and CCR5-tropic HIV-1 by flow cytometry. J. Virol. Methods 131:134–142 [DOI] [PubMed] [Google Scholar]
- 6. Brumme Z., et al. 2009. Impact of select immunologic and virologic biomarkers on CD4 cell count decrease in chronic HIV-1 subtype C infection: results from Sinikithemba cohort, Durban, South Africa. Clin. Infect. Dis. 49:956–964 [DOI] [PMC free article] [PubMed] [Google Scholar]
- 7. Brumme Z. L., et al. 2008. Marked epitope- and allele-specific differences in rates of mutation in human immunodeficiency type 1 (HIV-1) Gag, Pol, and Nef cytotoxic T-lymphocyte epitopes in acute/early HIV-1 infection. J. Virol. 82:9216–9227 [DOI] [PMC free article] [PubMed] [Google Scholar]
- 8. Campbell T. B., Schneider K., Wrin T., Petropoulos C. J., Connick E. 2003. Relationship between in vitro human immunodeficiency virus type 1 replication rate and virus load in plasma. J. Virol. 77:12105–12112 [DOI] [PMC free article] [PubMed] [Google Scholar]
- 9. Carrington M., O'Brien S. J. 2003. The influence of HLA genotype on AIDS. Annu. Rev. Med. 54:535–551 [DOI] [PubMed] [Google Scholar]
- 10. Chopera D. R., et al. 2008. Transmission of HIV-1 CTL escape variants provides HLA-mismatched recipients with a survival advantage. PLoS Pathog. 4:e1000033. [DOI] [PMC free article] [PubMed] [Google Scholar]
- 11. Crawford H., et al. 2009. Evolution of HLA-B*5703 HIV-1 escape mutations in HLA-B*5703-positive individuals and their transmission recipients. J. Exp. Med. 206:909–919 [DOI] [PMC free article] [PubMed] [Google Scholar]
- 12. Crawford H., et al. 2011. The hypervariable HIV-1 capsid protein 1 residues comprise HLA-driven CD8+ T-cell escape mutations and covarying HLA-independent polymorphisms. J. Virol. 85:1384–1390 [DOI] [PMC free article] [PubMed] [Google Scholar]
- 13. Derdeyn C. A., Silvestri G. 2005. Viral and host factors in the pathogenesis of HIV infection. Curr. Opin. Immunol. 17:366–373 [DOI] [PubMed] [Google Scholar]
- 14. Duda A., et al. 2009. HLA-associated clinical progression correlates with epitope reversion rates in early human immunodeficiency virus infection. J. Virol. 83:1228–1239 [DOI] [PMC free article] [PubMed] [Google Scholar]
- 15. Fiebig E. W., et al. 2003. Dynamics of HIV viremia and antibody seroconversion in plasma donors: implications for diagnosis and staging of primary HIV infection. AIDS 17:1871–1879 [DOI] [PubMed] [Google Scholar]
- 16. Gao X., et al. 2005. AIDS restriction HLA allotypes target distinct intervals of HIV-1 pathogenesis. Nat. Med. 11:1290–1292 [DOI] [PubMed] [Google Scholar]
- 17. Goepfert P. A., et al. 2008. Transmission of HIV-1 Gag immune escape mutations is associated with reduced viral load in linked recipients. J. Exp. Med. 205:1009–1017 [DOI] [PMC free article] [PubMed] [Google Scholar]
- 18. Goonetilleke N., et al. 2009. The first T cell response to transmitted/founder virus contributes to the control of acute viremia in HIV-1 infection. J. Exp. Med. 206:1253–1272 [DOI] [PMC free article] [PubMed] [Google Scholar]
- 19. Huang X., Zhang J. 1996. Methods for comparing a DNA sequence with a protein sequence. Comput. Appl. Biosci. 12:497–506 [DOI] [PubMed] [Google Scholar]
- 20. Hunter E., et al. 2009. Abstr. AIDS Vaccine 2009 Conf., abstr. S05-01.
- 21. Kawashima Y., et al. 2009. Adaptation of HIV-1 to human leukocyte antigen class I. Nature 458:641–645 [DOI] [PMC free article] [PubMed] [Google Scholar]
- 22. Kiepiela P., et al. 2004. Dominant influence of HLA-B in mediating the potential co-evolution of HIV and HLA. Nature 432:769–774 [DOI] [PubMed] [Google Scholar]
- 23. Langford S. E., Ananworanich J., Cooper D. A. 2007. Predictors of disease progression in HIV infection: a review. AIDS Res. Ther. 4:11. [DOI] [PMC free article] [PubMed] [Google Scholar]
- 24. Lassen K. G., et al. 2009. Elite suppressor–derived HIV-1 envelope glycoproteins exhibit reduced entry efficiency and kinetics. PLoS Pathog. 5:e1000377. [DOI] [PMC free article] [PubMed] [Google Scholar]
- 25. Marozsan A. J., et al. 2005. Differences in the fitness of two diverse wild-type human immunodeficiency virus type 1 isolates are related to the efficiency of cell binding and entry. J. Virol. 79:7121–7134 [DOI] [PMC free article] [PubMed] [Google Scholar]
- 26. Martinez-Picado J., et al. 2006. Fitness cost of escape mutations in p24 Gag in association with control of human immunodeficiency virus type 1. J. Virol. 80:3617–3623 [DOI] [PMC free article] [PubMed] [Google Scholar]
- 27. Matthews P. C., et al. 2008. Central role of reverting mutations in HLA associations with human immunodeficiency virus set point. J. Virol. 82:8548–8559 [DOI] [PMC free article] [PubMed] [Google Scholar]
- 28. Miura T., et al. 2009. HLA-associated alterations in replication capacity of chimeric NL4-3 viruses carrying gag-protease from elite controllers of human immunodeficiency virus type 1. J. Virol. 83:140–149 [DOI] [PMC free article] [PubMed] [Google Scholar]
- 29. Miura T., et al. 2010. Impaired replication capacity of acute/early viruses in persons who become HIV controllers. J. Virol. 84:7581–7591 [DOI] [PMC free article] [PubMed] [Google Scholar]
- 30. Mothe B., Ibarrondo J., Llano A., Brander C. 2009. Virological, immune and host genetics markers in the control of HIV infection. Dis. Markers 27:105–120 [DOI] [PMC free article] [PubMed] [Google Scholar]
- 31. Ngumbela K. C., et al. 2008. Targeting of a CD8 T cell env epitope presented by HLA-B*5802 is associated with markers of HIV disease progression and lack of selection pressure. AIDS Res. Hum. Retroviruses 24:72–82 [DOI] [PubMed] [Google Scholar]
- 32. Novitsky V., et al. 2009. Better control of early viral replication is associated with slower rate of elicited antiviral antibodies in the detuned enzyme immunoassay during primary HIV-1C infection. J. Acquir. Immune Defic. Syndr. 52:265–272 [DOI] [PMC free article] [PubMed] [Google Scholar]
- 33. Novitsky V., et al. 2009. Timing constraints of in vivo Gag mutations during primary HIV-1 subtype C infection. PLoS One 4:e7727. [DOI] [PMC free article] [PubMed] [Google Scholar]
- 34. Novitsky V., et al. 2009. Viral load and CD4+ T cell dynamics in primary HIV-1 subtype C infection. J. Acquir. Immune Defic. Syndr. 50:65–76 [DOI] [PMC free article] [PubMed] [Google Scholar]
- 35. Pereyra F., et al. for the International HIV Controllers Study 2010. The major genetic determinants of HIV-1 control affect HLA class I peptide presentation. Science 330:1551–1557 doi: 10.1126/science.1195271 [DOI] [PMC free article] [PubMed] [Google Scholar]
- 36. Prado J. G., et al. 2010. Replicative capacity of human immunodeficiency virus Type 1 transmitted from mother to child is associated with pediatric HIV-1 disease progression rate. J. Virol. 84:492–502 [DOI] [PMC free article] [PubMed] [Google Scholar]
- 37. Quiñones-Mateu M. E., et al. 2000. A dual infection/competition assay shows a correlation between ex vivo human immunodeficiency virus type 1 fitness and disease progression. J. Virol. 74:9222–9233 [DOI] [PMC free article] [PubMed] [Google Scholar]
- 38. Rolland M., et al. 2008. Broad and Gag-biased HIV-1 epitope repertoires are associated with lower viral loads. PLoS One 3:e1424 doi: 10.1371/journal.pone.0001424 [DOI] [PMC free article] [PubMed] [Google Scholar]
- 39. Schaefer M., et al. 2009. Abstr. AIDS Vaccine 2009 Conf., abstr. OA06-03.
- 40. Schneidewind A., et al. 2008. Structural and functional constraints limit options for cytotoxic T-lymphocyte escape in the immunodominant HLA-B27-restricted epitope in human immunodeficiency virus type 1 capsid. J. Virol. 82:5594–5605 [DOI] [PMC free article] [PubMed] [Google Scholar]
- 41. Schneidewind A., et al. 2007. Escape from the dominant HLA-B27-restricted cytotoxic T-lymphocyte response in Gag is associated with a dramatic reduction in human immunodeficiency virus type 1 replication. J. Virol. 81:12382–12393 [DOI] [PMC free article] [PubMed] [Google Scholar]
- 42. Schneidewind A., et al. 2009. Maternal transmission of human immunodeficiency virus escape mutations subverts HLA-B57 immunodominance but facilitates viral control in the haploidentical infant. J. Virol. 83:8616–8627 [DOI] [PMC free article] [PubMed] [Google Scholar]
- 43. Sterling T. R., et al. 2001. Initial plasma HIV-1 RNA levels and progression to AIDS in women and men. N. Engl. J. Med. 344:720–725 [DOI] [PubMed] [Google Scholar]
- 44. Storey J. D., Tibshirani R. 2003. Statistical significance for genomewide studies. Proc. Natl. Acad. Sci. U. S. A. 100:9440–9445 [DOI] [PMC free article] [PubMed] [Google Scholar]
- 45. Tang J., et al. 2002. Favorable and unfavorable HLA class I alleles and haplotypes in Zambians predominantly infected with clade C human immunodeficiency virus type 1. J. Virol. 76:8276–8284 [DOI] [PMC free article] [PubMed] [Google Scholar]
- 46. Thobakgale C. F., et al. 2009. Impact of HLA in mother and child on disease progression of pediatric human immunodeficiency virus type 1 infection. J. Virol. 83:10234–110244 [DOI] [PMC free article] [PubMed] [Google Scholar]
- 47. Thobakgale C. F., et al. 2007. Human immunodeficiency virus-specific CD8+ T-cell activity is detectable from birth in the majority of in utero-infected infants. J. Virol. 81:12775–12784 [DOI] [PMC free article] [PubMed] [Google Scholar]
- 48. van Loggerenberg F., et al. 2008. Establishing a cohort at high risk of HIV infection in South Africa: challenges and experiences of the CAPRISA 002 acute infection study. PLoS One 3:e1954. [DOI] [PMC free article] [PubMed] [Google Scholar]
- 49. Wright J. K., et al. 2010. Gag-protease-mediated replication capacity in HIV-1 subtype C chronic infection: associations with HLA type and clinical parameters. J. Virol. 84:10820–10831 [DOI] [PMC free article] [PubMed] [Google Scholar]