Abstract
Mammalian retrotransposons, transposable elements that are processed through an RNA intermediate, are categorized as short interspersed elements (SINEs), long interspersed elements (LINEs), and long terminal repeat (LTR) retroelements, which include endogenous retroviruses. The ability of transposable elements to autonomously amplify led to their initial characterization as selfish or junk DNA; however, it is now known that they may acquire specific cellular functions in a genome and are implicated in host defense mechanisms as well as in genome evolution. Interactions between classes of transposable elements may exert a markedly different and potentially more significant effect on a genome than interactions between members of a single class of transposable elements. We examined the genomic structure and evolution of the kangaroo endogenous retrovirus (KERV) in the marsupial genus Macropus. The complete proviral structure of the kangaroo endogenous retrovirus, phylogenetic relationship among relative retroviruses, and expression of this virus in both Macropus rufogriseus and M. eugenii are presented for the first time. In addition, we show the relative copy number and distribution of the kangaroo endogenous retrovirus in the Macropus genus. Our data indicate that amplification of the kangaroo endogenous retrovirus occurred in a lineage-specific fashion, is restricted to the centromeres, and is not correlated with LINE depletion. Finally, analysis of KERV long terminal repeat sequences using massively parallel sequencing indicates that the recent amplification in M. rufogriseus is likely due to duplications and concerted evolution rather than a high number of independent insertion events.
INTRODUCTION
Transposable elements (TEs), first identified in the 1950s, are present in all organisms, and many are critical players in genome organization and evolution. Transposition events may be detrimental to the host genome, resulting in either insertional mutagenesis or nonallelic homologous recombination. In the mammalian genome, these retroposition events are associated with mutations, diseases, and epigenetic modifications (20). Alternatively, TEs may be exapted by the host genome; for example, retroelements are implicated in centromere demarcation (24, 35), telomere function (6), host defense (5, 44, 45), DNA repair (8), and placental development (55). Since TEs can impact the evolution of both gene regulation and function, an understanding of the complex interplay between genomes and their resident TEs is needed. The classes, population density, and evolution of TEs are varied within eukaryotes. For example, long interspersed elements (L1s) are thought to be transmitted vertically; are the most populous in the mammalian genome, accounting for almost half of the sequences in the mouse and human genomes (41, 48, 60); and have been demonstrated to have recurrent activity since the diversification of the mammalian clade (12, 26, 61). Conversely, endogenous retroviruses (ERVs) are believed to result from the integration of exogenous retroviruses into the germ line and consequently have short durations of activity before being inactivated by the host genome (4). Multiple waves of ERV infection and subsequent quiescence have occurred throughout mammalian evolution, with copies of nonfunctional and degraded ERVs found in all mammalian genomes examined to date (28, 32, 66). The differences between these two classes of TEs with regard to maintenance and evolution have led researchers to consider ERVs to principally be parasitic sequences, whereas L1s are regarded as participants in genome evolution (18, 27, 61), although more recently, Le Rouzic et al. (42) proposed that long-term selection of any TE is indicative of Darwinian selection, e.g., functional constraint.
The complex interplay between classes of TEs can also have a profound impact on genome evolution. Such an interplay has been implicated in the evolution of the eel (Anguilla japonica) genome, where short interspersed elements (SINEs) are mobilized in response to the in trans activity of active L1s (40). In another example, a novel retroelement, the MysTR retrovirus, was shown to have undergone recent amplification coincident with the loss of L1s in Oryzomys, the South American rice rat (13). Moreover, the loss of L1s in Oryzomys and amplification of MysTR were coincident with the diversification of the clade (30).
The kangaroo endogenous retrovirus (KERV) is a recently identified endogenous retrovirus (52) that presents a compelling case for studying the role of retroelements in genome evolution. KERV was originally found as an amplified sequence at the centromeres in an interspecific hybrid between the two closely related wallaby species Macropus rufogriseus and M. eugenii (52). More recent hybridization experiments have proven that KERV is present in all extant marsupials at active and latent centromeres (23, 24). The sister taxa M. eugenii and M. rufogriseus diverged within the last 1 million to 2 million years (29) and represent taxa with a rich evolutionary history in their resident retroelement populations. M. eugenii and M. rufogriseus have the same chromosome complement and conserved chromosome segments (reviewed in reference 51), yet M. rufogriseus has significantly expanded centromeric regions, comprising almost 30% of the genome and largely consisting of KERV elements. The centromeric expansions observed in M. rufogresius are fixed in this species (10, 49, 52) and as such provide a model in which to examine the impact of an active retroelement on other retroelements resident within the genome.
In this study, the structure and expression pattern of KERV, its phylogenetic relationship with other retroviruses, and its long terminal repeat (LTR) sequence composition within M. eugenii and M. rufogriseus were characterized. In addition, assays for any potential interplay between KERV and the L1 population of TEs in the Macropus genus were performed. Fluorescence in situ hybridization (FISH), quantitative real-time PCR, and RNA studies were used to determine the relative copy number, expression, and distribution of KERV and L1 elements in M. rufogriseus and M. eugenii. KERV, a 6,174-bp proviral genome, is amplified in the Macropus genus in a lineage-specific fashion, is restricted to the centromeres, and is not correlated with L1 depletion. Thus, in contradiction to the hypothesis of Cantrell et al. that amplification of retroelements is directly correlated to loss of L1 elements (13), KERV has undergone amplification via duplication events independent of L1 copy number variation in Macropus and is a major constituent of active centromeres.
MATERIALS AND METHODS
Sequence and phylogenetic analyses.
Alignments of KERV pol and int against tammar wallaby bacterial artificial chromosome (BAC) sequences were performed using the BLAST program (1). The Vector NTI Advance (Invitrogen) software suite and NCBI BLAST analysis were used to identify open reading frames (ORFs) for each viral coding region. All sequences were assembled using Vector NTI, version 10, ContigExpress software (Invitrogen). Two translated KERV pol sequences (KERV.F3, KERV.A4) were aligned, using the ClustalW program (65) implemented with the DAMBE software package (67), with the translated pol sequences of 28 other viruses of the Retroviridae family selected from a preexisting data set from Dimmic et al. (19), with the addition of several basal retroviruses identified in a separate analysis by Gifford et al. (29). The aligned sequences were subjected to both a Bayesian Markov chain Monte Carlo (MCMC) analysis using the MrBayes program, version 3.1.2 (36, 58), and a maximum-likelihood (ML) analysis implemented in the PHYML software package (33). Five chains (four heated, one cold) were run through 2 million replications, collecting 1 tree every 100 generations after the first 2,000 trees, which were discarded as burn-in. Analysis of the resulting 18,000 trees was performed using a pol-specific amino acid substitution model (rtREV) (19). This particular model has previously been shown to provide an improvement over more generalized models when viral pol sequence data are analyzed (19).
Primed in situ hybridization (PRINS).
Metaphase chromosomes prepared from fibroblast cell lines were harvested and fixed to glass slides by standard methods. Briefly, colcemid was added to a final concentration of 0.1 μg/ml at 37°C for 1 to 2 h, and cells were trypsinized, treated with 0.075 M KCl at 37°C for 15 to 20 min, prefixed, and fixed with methanol-acetic acid (3:1; modified Carnoy's solution). Cells were dropped onto acetone-cleaned slides, air dried overnight, dehydrated, and stored at −20°C. A HybriWell reaction chamber (Schleicher & Schuell) was placed on the slide prior to denaturation at 92.5°C, at which point the reaction mixture was immediately applied. The reaction mixture consisted of 1 μg of each primer; 1 mM dCTP, dGTP, and dATP; 0.01 mM digoxigenin-11-dUTP (Roche); 1× Taq buffer (Promega); 4 units Taq polymerase (Promega); and distilled water to a final volume of 50 μl. The reaction chamber was sealed, and the slide was placed on a Hybaid PCR Express in situ flat block thermal cycler at 92.5°C for 3 min, followed by primer extension at 65°C for 1 h. The reaction chamber was removed and the slide was placed in 65°C 0.2% SSC (1× SSC is 0.15 M NaCl plus 0.015 M sodium citrate)-0.2% bovine serum albumin twice for 5 min each time. After the slide was blocked with 5% bovine serum albumin in 0.2% Tween 20-4× SSC (4×T), detection was performed using antidigoxigenin fluorescein (sheep; Roche) at 37°C in a humid chamber for 30 min. Excess detection reagents were washed at 45°C in 4×T. Slides were mounted in Vectashield-4′,6-diamidino-2-phenylindole (DAPI; Vector Laboratories). KERV primers BE95 (5′-GAG GAT CAC CAA GGG ACC GTA TGG) and BE1344 (5′-AAC TGA GCT TAC ACC CCC ACC ATC) were used.
Nucleic acid isolation.
Fibroblast cell pellets and/or tissue (liver and testis) were homogenized, followed by DNA isolation according to the standard phenol extraction protocol. RNA was extracted from tissue or fibroblast samples stabilized in RNAlater tissue collection and RNA stabilization solution (Ambion) using an Ambion mirVANA or Qiagen RNAeasy kit according to the manufacturers' protocols.
Northern and Southern analyses.
Total RNA from M. rufogriseus was isolated from fibroblast cells as described above. Ten micrograms of RNA was electrophoresed on a 1% agarose-37% formaldehyde gel and transferred to a Hybond N membrane (Amersham) according to the manufacturer's instruction. Hybridization with a randomly32P-labeled probe specific for the KERV target was at 65°C overnight in 1 mM EDTA-0.5 M Na2HPO4-7% SDS, followed by a wash in 0.1× SSC-0.1% SDS at 65°C. Autoradiography was at −80°C overnight using Kodak X-ray film. Genomic DNA from M. rufogriseus, M. eugenii, and Petrogale rothschildi was digested overnight with EcoRI, electrophoresed in a 0.8% agarose gel, acid nicked, and denatured. Southern blots were prepared by transferring the DNA to a Hybond N+ membrane (Amersham) according to the manufacturer's instructions. Hybridization with randomly32P-labeled probes specific for the L1 and KERV targets was performed as above. Autoradiography was at −80°C overnight using Kodak X-ray film.
RACE.
M. rufogriseus total RNA was reverse transcribed in the presence of 5′-(G-cap) or 3′-poly(A) SMART II rapid amplification of cDNA ends (RACE) adapters (BD Biosciences). KERV-specific primers RNSF1 (5′-CTG CAA CCA GGT CTC CCT TCT CCT AAT G-3′) and RNSR (5′-TGG GGC AAT ACC TTC CAC TGA TAC CTC T-3′) were independently used in conjunction with 5′-prepared or 3′-prepared cDNA and associated RACE primers for second-strand synthesis (4 reactions total, according to the manufacturer's protocol). Touchdown PCR conditions were 5 cycles of 94°C for 30 s and 72°C for 3 min; 5 cycles of 94°C for 30 s, 70°C for 30 s, and 72°C for 3 min; and 27 cycles of 94°C for 30 s, 68°C for 30 s, and 72°C for 3 min. Nested PCR of diluted amplicons was performed using nested KERV-specific primers nRNSF (5′-CCT CGG TTT GCC TTT ACA ATA CCT CAC C-3′) and nRNSR (5′-GCA GGT CCT TCA TTA TTG GGG TGA GGT A-3′). Nested PCR products sequenced using ABI BigDye chemistry.
Reverse transcriptase (RT) PCR.
Total RNA was DNase treated prior to cDNA synthesis using an Invitrogen DNase kit, with a minor modification. Briefly, 1 μg of RNA in a total volume of 8 μl was heated to 94°C for 3 min and immediately placed on ice. The protocol was then followed according to the manufacturer's instructions. Five hundred nanograms of DNase-treated RNA was reverse transcribed using an Invitrogen cloned avian myeloblastosis virus cDNA synthesis kit with oligo(dT) primers at 55°C for 1 h according to the manufacturer's instructions. Second-strand synthesis was performed in a 50-μl volume using 1 μl of cDNA, 1 μl 10 mM deoxynucleoside triphosphates, 5 μl 10× PCR buffer (500 mM KCl, 100 mM Tris Cl, pH 9, 15 mM MgCl2, 1% Triton X-100), 1 μl each forward and reverse primers (100 ng/μl), and 0.5 μl Taq polymerase. PCR conditions were typically 94°C for 3 min and 30 cycles of 94°C for 30 s, the annealing temperature appropriate for the primer set (see supplemental Table 1 at http://www.oneill.mcb.uconn.edu) for 30 to 45 s, and 72°C for 30 to 45 s, followed by a 10-min extension at 72°C and a 4°C hold.
Table 1.
Summary statistics for distributions of percent identity and genetic distance for all pairwise comparisons of reference sequence and all master sequences for M. rufogriseus and M. eugenii
| Statistic |
M. eugenii |
M. rufogriseus |
||
|---|---|---|---|---|
| % identity | Genetic distance | % identity | Genetic distance | |
| Average | 52.55 | 0.90 | 54.99 | 0.80 |
| Variance | 177.00 | 0.33 | 195.25 | 0.22 |
| SD | 13.30 | 0.58 | 13.97 | 0.47 |
| CVa | 0.25 | 0.64 | 0.25 | 0.58 |
CV, coefficient of variation.
Real-time (quantitative) PCR analysis.
Real-time PCR primers targeted the pol-int region of the KERV sequence and the ORF1 region of the M. eugenii L1-3_ME. Primers targeting KERV were BE456 (5′-GCA TCC TTA TCA ACT TCA CCT TAA-3′) and BE-R-711 (5′-TGG AGA CAC AAA CAT ACC CTG GAC-3′. Primers targeting L1-3_ME were MEL1f (5′-GAA GAG AAA TGA GAG ACA TGA AAG C-3′) and MEL1r (5′-GGT AGG TGA TTC TTG GTT TTA GTC C-3′. Primers targeting phosphoglycerate kinase (PGK), the standardization control, were nPGKf (5′-CTG GCC ATC TTG GGC GGA GCT AA-3′) and nPGKr (5′-TGA TCA TCT CAT TGA CTT TGT C-3′). iQ SYBR green Supermix (Bio-Rad) was used to amplify all three targets from male M. rufogresius, M. eugenii, and P. rothschildi genomic DNA. Initial denaturation was performed at 94°C for 3 min, followed by 40 cycles of 94°C for 30 s, 55°C for 30 s, and 72°C for 30 s and real-time data collection at 80°C for 10 s. The melt curve analysis followed amplification (55°C to 95°C, +0.5°C per cycle). Resultant values were standardized using the relative expression ratio mathematical model (54) and PGK (27) as the reference gene. Significance was determined by t-test analysis.
Homology searches.
Homology searches were performed with the GenBank BLAST suite of programs and the RepeatMasker program (62).
FISH.
FISH probes were prepared by labeling plasmids containing either L1-3_ME with digoxigenin or biotin via PCR and nick translation, respectively. Probe preparation and hybridization were performed as follows: 375 ng of L1-3_ME probe was rehydrated in Hybrisol VII (Qbiogene); slides were pretreated with 0.005% pepsin at 37°C and rinsed with 1× phosphate-buffered saline (PBS), followed by restabilization in 1% formaldehyde; chromosomal denaturation was performed for 2.5 min at 75°C in 70% formamide-2× SSC; and posthybridization washes were preheated to 50°C; and washing was performed at 42°C in 50% formamide-2× SSC and 0.5× SSC. After the reaction was blocked with 50% goat serum in 0.2% Tween 20-1× PBS, detection was performed using antihapten fluorochrome at 37°C in a humid chamber for 30 min. Excess detection reagents were washed at 45°C in 4× SSC-0.2% Tween 20. Images were captured on an Olympus AX70 microscope equipped with Applied Imaging Genus software.
High-throughput sequencing and data analysis of KERV LTR.
DNA was extracted from liver tissue from both M. eugenii and M. rufogriseus using standard phenol-chloroform methods. PCR amplicon fusion primers were designed to include the Roche 454 forward and reverse primers and key (Lib L A+B). Multiplex identifier tags were also included in the primer design as well as the KERV primer LTR template-specific sequence (LTR forward primer sequence, ACAGTCTCGGGCGGGTAAAG; LTR reverse primer sequence, ATATGAGAGAAAGGACGTTCCAGAG). Amplicons for both species were obtained according to the Roche Amplicon Library Preparation Method Manual. High-molecular-weight genomic DNA was diluted to a final concentration of 5 to 20 ng/μl. PCR conditions were as follows: 1 cycle at 94°C for 3 min and 35 cycles of 94°C for 15 s, 58°C for 45 s, and 72°C for 1 min, with a final extension at 72°C for 8 min. Reaction mixtures were purified using AmpureXP beads following the Beckman AmpureXP cleanup protocol. Purified reaction mixtures were resuspended in 10 μl of 1× Tris-EDTA buffer and quantified using a Bio-Rad Experion DNA 1k lab chip. Libraries were diluted to the recommended concentrations and subsequently amplified using a Roche 454 GS titanium Small Volume emPCR kit (Lib-L) at a ratio of two molecules of library per bead. Enriched beads were loaded in two regions of an eight-region GS titanium PicoTiter plate and sequenced with a GS titanium sequencing kit (XLR70) for 200 cycles on a Roche 454 GS FLX pyrosequencer. Raw image data were fully processed on a computer cluster with Roche 454 data analysis processing software, version 2.3.
Roche 454 amplicon run data were used to summarize patterns of sequence diversity and divergence in both M. rufogriseus and M. eugenii. All high-quality reads from each run were hierarchically clustered into clumps on the basis of similarity, and a master sequence for each clump was generated using the program UCLUST, version 3.0 (22). In this case, clustering was done under a series of similarity thresholds (99%, 98%, 95%, 90%, 85%, 80%, 70%, 50%, and 35%). A maximum of 5,000 sequences was allowed in each clump. Master sequences from each clump were aligned by use of the MUSCLE program, version 3.8.31 (maximum number of iterations = 2) (21). Evolutionary relationships among sequences were assessed with a CLC genomic workbench. Summary statistics of pairwise differences in genetic distance (Jukes-Cantor [JC] distance) among master sequences and one reference sequence of centromeric repetitive LTR motif for each species were examined, and a maximum-likelihood phylogeny was built. For phylogenetic tree construction, the topology and branch lengths of the tree were estimated with an unweighted pair group method using average linkages algorithm and three different substitution models: JC (38), Hasegawa, Kishino, and Yano (HKY) (34), and generalized time reversible (GTR) (68). Gamma distribution and transition/transversion ratio parameters were initially estimated for each substitution model, and then estimated values were included as starting conditions for the final maximum-likelihood tree estimation. Maximum-likelihood values for each tree were used to pick the best substitution model. The topology of the tree with the highest maximum likelihood value was then used as the template for phylogeny estimation using the three different substitution models, and Akaike information criterion values were used to estimate which model was the best fit for the topology (numbers of estimated parameters, 1, 4, and 9 for JC, HKY, and GTR, respectively).
RESULTS
KERV structure.
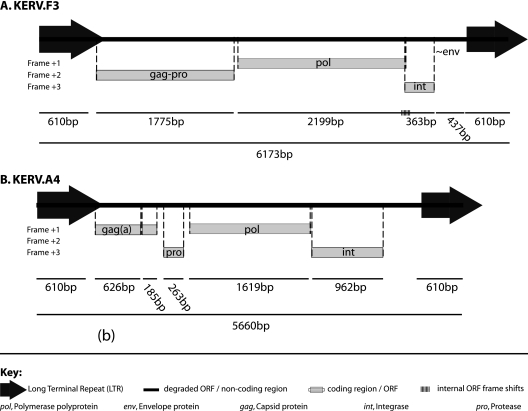
To obtain the full-length proviral sequence for KERV, we performed sequence analysis of several previously identified M. eugenii BAC clones (28). Sequence prediction resolved a 4,954-bp KERV proviral genome (KERV.F3) bounded by two identical 610-bp LTRs (6,174 bp total) (Fig. 1A). The KERV.F3 proviral sequence contained a 423-amino-acid (aa) gag-pro ORF and an 854-aa pol-int ORF. Both translated ORFs were homologous to the genomes of several betaretroviruses. The gag-pro ORF was in the +2 reading frame, starting 116 bp after the LTR, and appeared to contain a read-through stop codon 501 bp from the pro start codon. The pol-int ORF contained a −1 frameshift between the pol +1 and int +3 regions. The gag-pro ORF encoded a conserved nucleocapsid protein domain, a gag-specific zinc finger CCHC domain, and a retroviral aspartyl protease domain. The protease domain is typically found in association with the pol polyprotein in most retroviruses but can also be found as part of the gag polyprotein (14, 16). The pol-int ORF encoded several domains, including the conserved YXDD functional domain of the reverse transcriptase enzyme, in addition to RNaseH and integrase domains. An ORF encoding an env polyprotein was not identified. The sequence between the end of the pol-int ORF and the beginning of the 3′ LTR showed low sequence identity by analysis with the TBLASTX program (∼42%) to hepatitis C virus env as well as several stop codons. An additional, albeit degraded, KERV variant was also identified during the initial BAC analyses. KERV.A4 was determined to be 5,660 bp in length, contained intact ORFs (which varied in size in comparison to those in KERV.F3), and was bounded by nearly identical LTR sequences (Fig. 1B). KERV.F3 in its entirety shares 90% identity to the murine endogenous retrovirus (MERV) (39).
Fig. 1.
KERV structure. Genomic structure of the KERV.F3 (A) and KERV.A4 (B) proviral structures isolated from the M. eugenii BAC clones with GenBank accession numbers AC171384 and AC166215.2, respectively. The key for features is shown at the bottom.
KERV phylogenetic analyses.
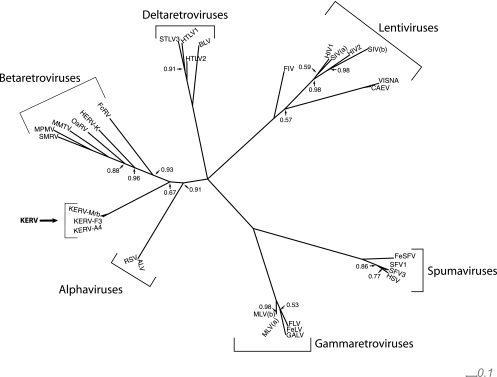
The retroviral classification of KERV was determined by phylogenetic analysis using a 782-amino-acid region of the pol ORF (containing the RT and RNase H domains). This region was compared to the pol genes of 28 retrotranscribing viruses encompassing six genera of the Retroviridae from 10 vertebrate species, including the class Aves and all three infraclasses of Mammalia (19, 29, 50). Since retroviral genomes evolve rapidly, the pol gene sequence comprising the most conserved portion of retroviral genomes enables the most informative sequence alignment across divergent genera (29) (see supplemental Fig. 1 at http://www.oneill.mcb.uconn.edu). Phylogenetic analyses of pol using both MCMC and maximum-likelihood statistics identifies KERV as basal to betaretroviruses and either a distantly related class of betaretroviruses or, although less likely, a new genus within the Retroviridae (Fig. 2).
Fig. 2.
Bayesian MCMC pol-based phylogeny of KERV relative to members of the Retroviridae family. Each node indicates a posterior probability of 100%, except for those indicated otherwise. The alpha-, beta-, gamma-, delta-, spuma-, and lentiviral genera of the Retroviridae family are indicated by brackets and text. KERV is indicated in boldface. SMRV, squirrel monkey retrovirus; MPMV, Mason-Pfizer monkey virus; OaRV, Ornithorhynchus anatinus endogenous class II-related virus; HERV-K, human endogenous retrovirus K; FcRV, Felis catus endogenous class II-related virus; STLV3, simian T-cell leukemia virus type 3; HTLV1, human T-cell leukemia virus type 1; BLV, bovine leukemia virus; FIV, feline immunodeficiency virus; HIV, human immunodeficiency virus; SIV(a) simian immunodeficiency virus type a; VISNA, visna virus; CAEV, caprine arthritis-encephalitis virus; FeSV, feline sarcoma virus; SFV1, Semliki Forest virus type 1; HSV, herpes simplex virus; MLV(b), murine leukemia virus type b; FLV, Friend leukemia virus; FeLV, feline leukemia virus; GALV, gibbon-ape leukemia virus; RSV, respiratory syncytial virus; ALV, avian leukosis virus.
KERV expression.
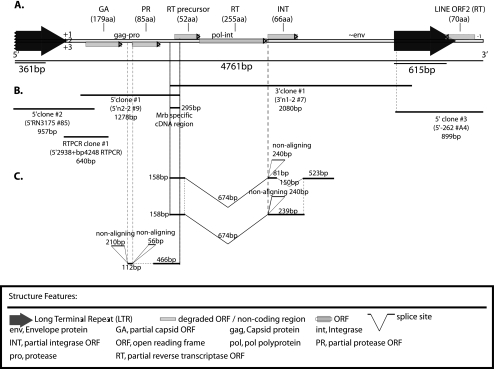
Northern blot analysis of both M. rufogriseus and M. eugenii total RNA revealed higher expression of the reverse transcriptase regions of KERV in M. rufogriseus than in M. eugenii (data not shown); therefore, subsequent expression analyses were performed in M. rufogriseus (see supplemental Fig. 2 at http://www.oneill.mcb.uconn.edu). Sequence analysis of M. rufogriseus RT-PCR KERV amplicons showed high sequence identity (91%) to the previously identified KERV sequence (GenBank accession number AF044909), with the exception of a single 295-bp region in the pol ORF unique to M. rufogriseus (Fig. 3A). RACE using primers specific to this unique region allowed the isolation of the 5′ and 3′ ends of the M. rufogriseus KERV. The resultant assembled sequences indicated a 4,761-bp expressed genome, in addition to several other transcribed regions, degenerate copies, or possibly, alternatively spliced products (Fig. 3B). Several RACE products did not align in entirety to any other RACE clone, likely indicative of unique transcripts (nonaligning sequences shown in Fig. 3C). The sequence of the M. rufogriseus KERV RNA genome was very similar (94% identity) to the M. eugenii KERV.F3 sequences, including the majority of the LTR sequence. The RNA sequence contained several partial ORFs, the largest of which encoded 255 aa of the RT protein (Fig. 3A). Attempts to generate larger RACE products failed beyond the LTR regions, likely due to the high proportion of highly similar LTRs surrounding both large and smaller, truncated KERV transcripts, skewing this PCR-based method toward smaller products.
Fig. 3.
M. rufogriseus RACE map. (A) Structure of M. rufogriseus assembled RACE products aligned to the full-length structure assembled for KERV from this species; (B) individual RACE products sizes; (C) select nonaligning RACE products and potential splice products. The key for the features is shown at the bottom. Clone accession numbers in GenBank are 1375050 and 1375052.
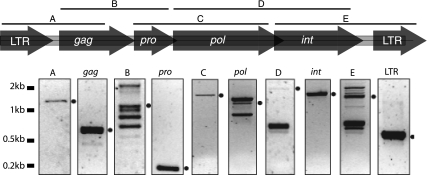
Overlapping RT-PCR of all regions of the proviral genome was performed to determine the expression of KERV in M. eugenii (Fig. 4). The proviral genome is expressed in its entirety, and the assembly of these expressed, overlapping sequences shows that they have a high degree of sequence identity (93%) to the KERV.F3 genomic sequence identified in M. eugenii, including the LTR sequences in their entirety (data not shown).
Fig. 4.
M. eugenii RT-PCR. Expression analysis of complete KERV genomic transcripts from Macropus eugenii total RNA by RT-PCR. (Top) Map of expected products on the basis of genomic DNA; (bottom) actual RT-PCR results for specific regions. The ladder is shown to the left, and the predicted band is indicated with a dot to the right of each panel.
Impact of KERV on other retroelements.
Multiple experimental approaches were used to determine the impact of KERV on L1 populations in three marsupial species: M. eugenii, M. rufogriseus, and the more distantly related species Petrogale rothschildi, all of which last shared a common ancestor 22 million years ago (11). Southern blot analysis of KERV showed that the largest amount of hybridization (i.e., copy number) was to M. rufogriseus, with less hybridization to M. eugenii and barely detectable hybridization to P. rothschildi (see supplemental Fig. 3 at http:///www.oneill.mcb.uconn.edu). L1-3_ME is the highest represented L1 in the M. eugenii genome (39). Southern blot analysis of L1-3_ME showed equal hybridization signals across all three species, indicating a relatively equal L1-3_ME population among these species (see supplemental Fig. 3 at http:///www.oneill.mcb.uconn.edu).
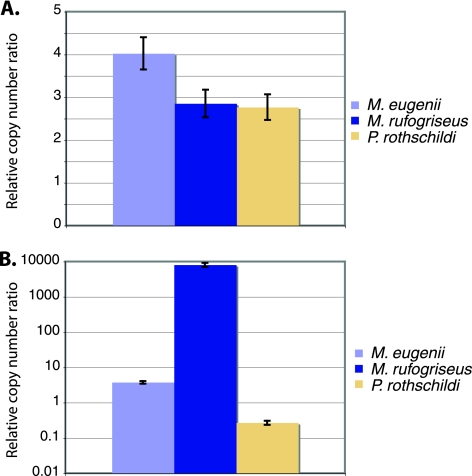
Real-time (quantitative) PCR analysis was employed to determine the relative copy number of the pol-int region of KERV, ORF1 of L1-3_ME, and the conserved single-copy PGK gene (31) in M. eugenii, M. rufogriseus, and Petrogale rothschildi. There is an 8,000 ± 1,000-fold higher copy number of KERV in M. rufogriseus than in either M. eugenii or P. rothschildi. M. eugenii harbors a 3 ± 0.3-fold higher copy number of KERV than P. rothschildi. Long interspersed element (LINE) density showed very little variation in copy number between all three species, and L1 copy number was not correlated with the differences in KERV copy number observed (Fig. 5). In contrast, there was a statistically significant difference between KERV and LINE copy numbers (P = 0.0001).
Fig. 5.
Quantitative real-time PCR analysis of LINE ORF2 (A) and KERV pol (B) populations in M. rufogriseus, M. eugenii, and P. rothschildi genomic DNA. Samples are normalized to a housekeeping gene, PGK.
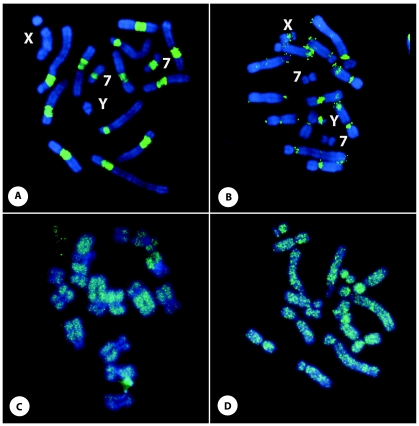
Finally, a comparative in situ analysis was employed to determine the cytological impact of the recent KERV amplification compared to that of L1 elements. KERV mapped to the centromeres in both M. eugenii and M. rufogriseus by FISH and PRINS (Fig. 6A and B), with the exception that there was no KERV hybridization to the X or Y chromosome in M. rufogriseus or to chromosome 7 in M. eugenii. KERV was previously mapped to chromosome 7 in M. eugenii (23), and we cannot confirm the absence of KERV on the M. rufogriseus sex chromosomes if proviral genomes are present in low copy numbers. The KERV signal in M. rufogriseus spans the centromere and extends into the large pericentromeric regions, whereas the KERV signal in M. eugenii is restricted to the small pericentric/centric regions (9, 15). The in situ localization patterns confirm the KERV copy number differences observed between these Macropus species by quantitative PCR and Southern analyses. FISH analyses showed that the L1-3_ME probe did not hybridize to the centromeres but, rather, hybridized along the length of all the chromosome arms (Fig. 6B and D). Barring the eutherian X chromosome (2), such a distribution is predicted by prior analysis (53).
Fig. 6.
In situ retroelement analyses. PRINS of KERV (A and B) and FISH of LINE L1-3_ME (C and D) to M. rufogriseus (A and C) and M. eugenii (B and D) metaphase chromosomes. The probe is fluorescein isothiocyanate (green), and chromosomes are counterstained with DAPI (blue). The X and Y chromosomes and chromosome 7 are indicated in panels A and B.
Rapid expansion of KERV within centromeres.
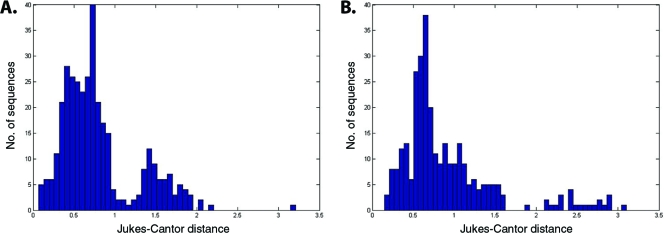
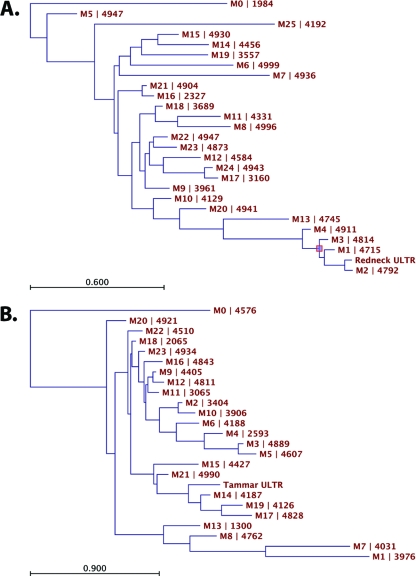
The massive expansion of KERV copies within M. rufogriseus centromeres may be the result of two different processes: (i) in cis expansion by such forces as tandem duplications or replication slippage, followed by concerted evolution of the expanded array of repeats, or (ii) in trans targeting of the centromere by multiple, independent insertions by KERV elements. Massive parallel sequencing of the KERV LTR was performed to test which scenario, if any, applies to the evolution of the expanded KERV arrays. The average genetic distance, variances, and coefficients of variation are greater in M. eugenii than in M. rufogriseus (Table 1). The distribution of sequences across clusters was essentially the same for M. eugenii and M. rufogriseus. The Shannon-Weiner calculation (H′) indicated that the M. rufogriseus KERV LTR sequences were slightly more diverse than those of M. eugenii (H′M. rufogriseus = 3.23; H′M. eugenii = 3.15); however, they were essentially equal in distribution among the clusters of sequences (where the evenness index J′ = 0.99 for both M. rufogriseus and M. eugenii. Frequency distributions of genetic distance indicated that the greater variation in M. eugenii is the result of some sequences being much more distant from the others than the distance observed within the M. rufogriseus sample (Fig. 7A and B). Phylogenies which included all sequences revealed what appeared to be more tightly clustered sequences (i.e., shorter branch lengths within clades) but greater distances between clades for M. eugenii, while the M. rufogriseus phylogeny presented a case of more evenly distributed branch lengths among sequences and thus a more consistent rate of divergence among sequences (Fig. 8A and B). Thus, these data indicate that the high number of recent, independent transposition events required that could account for the explosion in KERV copies is unlikely to have occurred. Instead, the centromeres of M. rufogriseus have likely undergone a series of large-scale duplications in tandem with waves of concerted evolution. Interestingly, a complete homogenization of the centromere into large, highly identical arrays of sequences, as is observed in many other mammals (17, 59), has not yet occurred.
Fig. 7.
Genetic divergence of KERV LTR sequences. Frequency distributions of genetic distances from all pairwise comparisons of the reference sequence and KERV LTR sequences for both M. rufogriseus (A) and M. eugenii (B).
Fig. 8.
Maximum-likelihood analysis of KERV LTR divergence. Maximum-likelihood trees of M. rufogriseus (A) and M. eugenii (B) reference sequence and KERV LTR sequences from clustering analysis. The HKY model of nucleotide evolution was used for tree construction. Notice the different scales associated with branch lengths. All sequence names begin with an M, followed by the number of the clusters that they represent; the number appearing after the pipe character indicates how many sequences were assigned to that cluster.
DISCUSSION
We selected members of the Macropodidae family for this study because they represent a rich evolutionary history regarding their karyotype and resident retroelement populations. Two of the species, Macropus eugenii and Macropus rufogriseus, are estimated to have diverged within the last 1 million to 2 million years (25). However, while they share the same chromosome complement and conserved chromosome blocks (reviewed in reference 51), M. rufogriseus carries significantly expanded centromeric regions, comprising almost 30% of the genome, compared to M. eugenii. Thus, given the fact that sister taxa lack this expansion (10), M. rufogriseus has experienced a recent and massive localized expansion of the endogenous retrovirus KERV. An expansion of this magnitude, a nearly 9,000-fold increase in copy number in comparison to the copy number for the sister taxa, is unprecedented for any ERV family. This expansion has also occurred in M. eugenii and P. rothschildi, albeit to a lesser extent in M. eugenii than in P. rothschildi. Our data suggest that the recent expansion may be a Macropus-specific event. Species-specific ERV expansions have been implicated in both species and karyotype diversification (30, 37, 46, 49, 63, 64). It is interesting to speculate that the activity of KERV and its participation in chromosome remodeling in hybrid genomes (41) may be involved in the diversification of karyotypes observed in the Macropus genus.
Perhaps even more remarkable than the overall increase in copy number of KERV is its restricted localization within chromosomes. In situ analyses of KERV indicate that increased copy numbers are limited to centromeric and pericentromeric regions of the Macropus genome (Fig. 5A and B). Previous studies on the distribution of retroelements, principally LINEs, indicate that novel insertions are random and that it is the subsequent, posttranspositional rearrangements that generate a predominantly AT-rich localization (3, 7, 27). Genetic distance analyses indicate that, like LINEs, the current cytological restriction of KERV was imposed posttranspositionally, although independent in cis transpositions cannot be definitively ruled out with the data in hand. The most parsimonious scenario that explains both the observation that M. eugenii carries more diversity for KERV LTRs and the observation that M. rufogriseus carries a much higher copy number for KERV is that smaller blocks of the viral elements have undergone a series of duplications and periods of concerted evolution within M. rufogriseus. It has recently been shown that novel expansions of KERV in interspecific hybrids between M. rufogriseus and another Macropus species, M. agilis, result in the development of knob-like structures and extensive chromosome remodeling specifically at centromeres (49), similar to those originally observed in maize (47). Although the centromere and pericentromere are gene poor (43), centromeres are frequent targets for karyotypic rearrangement and thus are responsible for subsequent speciation events in Macropus (10, 56, 57). The propensity for retroelements to participate in rearrangements suggests that KERV may be involved or associated with rearrangements targeted to centromere regions that typify this group of mammals.
Impact of KERV on genomic landscape.
KERV's impact on LINE populations within Macropus should be apparent, given the 4 million to 7 million years of divergence between the two species and the recent expansion of KERV within M. rufogriseus. The inverse relationship that Cantrell et al. (13) discovered between Oryzomys-native LINEs and ERVs, however, was not observed in the Macropodidae. LINE populations were relatively stable between the three marsupials tested, regardless of KERV copy number. Lack of the inverse relationship observed by Cantrell et al. (13) may be because such a relationship is limited to eutherian mammals or is specific to the MysTR element. Alternatively, the cytogenetic restriction of KERV insulates the interstitial LINE population from replacement by KERV. Such a process could account for the lack of LINE signal in M. rufogriseus centromeric regions. KERV could participate in chromatin structure reorganization such that the chromatin configuration is no longer optimal for LINE insertions. Conversely, KERV's sequence conservation, continued expression, localization to centromeres, breaks of synteny, and nearly ubiquitous distribution in the marsupial clade set it apart from previously observed ERVs (23, 24). Thus, KERV's relationship with the host may vary from the relationship observed by Cantrell et al. (13) due to the different evolutionary forces under which the Macropus and Oryzomys genomes and associated TEs have evolved.
The apparent discrepancy between Macropus and Oryzomys genomes could also be a widespread phenomenon, perhaps correlated with differences between eutherian and metatherian (marsupial) evolution. Therefore, comparative investigation of additional therian lineages is necessary to resolve the discrepancy in inter-TE impact. Differentiation in TE maintenance along mammalian infraclass lines (Eutheria, Metatheria, and Prototheria) would have a significant impact on current theories of mammalian evolution. Thus, a concerted effort to evaluate the interplay between TEs and how this interplay impacts mammalian host genomes is warranted.
ACKNOWLEDGMENTS
We express special thanks to Linda Strausbaugh and the Center for Applied Genetics and Technology for equipment. We also thank Mark D. B. Eldridge for providing samples.
N.J. and M.J.O. were supported by an NSF award to M.J.O. G.C.F., J.D.B., C.E.F., and R.J.O. were supported on an NSF award to R.J.O.
Footnotes
Published ahead of print on 9 March 2011.
REFERENCES
- 1. Altschul S. F., Gish W., Miller W., Myers E. W., Lipman D. J. 1990. Basic local alignment search tool. J. Mol. Biol. 215:403–410 [DOI] [PubMed] [Google Scholar]
- 2. Bailey J. A., Carrel L., Chakravarti A., Eichler E. E. 2000. Molecular evidence for a relationship between LINE-1 elements and X chromosome inactivation: the Lyon repeat hypothesis. Proc. Natl. Acad. Sci. U. S. A. 97:6634–6639 [DOI] [PMC free article] [PubMed] [Google Scholar]
- 3. Baker R. J., Kass D. H. 1994. Comparison of chromosomal distribution of a retroposon (LINE) and a retrovirus-like element mys in Peromyscus maniculatus and P. leucopus. Chromosome Res. 2:185–189 [DOI] [PubMed] [Google Scholar]
- 4. Bannert N., Kurth R. 2006. The evolutionary dynamics of human endogenous retroviral families. Annu. Rev. Genomics Hum. Genet. 7:149–173 [DOI] [PubMed] [Google Scholar]
- 5. Benit L., et al. 1997. Cloning of a new murine endogenous retrovirus, MuERV-L, with strong similarity to the human HERV-L element and with a gag coding sequence closely related to the Fv1 restriction gene. J. Virol. 71:5652–5657 [DOI] [PMC free article] [PubMed] [Google Scholar]
- 6. Biessmann H., et al. 1990. Addition of telomere-associated HeT DNA sequences “heals” broken chromosome ends in Drosophila. Cell 61:663–673 [DOI] [PubMed] [Google Scholar]
- 7. Boyle A. L., Ballard S. G., Ward D. C. 1990. Differential distribution of long and short interspersed element sequences in the mouse genome: chromosome karyotyping by fluorescence in situ hybridization. Proc. Natl. Acad. Sci. U. S. A. 87:7757–7761 [DOI] [PMC free article] [PubMed] [Google Scholar]
- 8. Brandt J., et al. 2005. Transposable elements as a source of genetic innovation: expression and evolution of a family of retrotransposon-derived neogenes in mammals. Gene 345:101–111 [DOI] [PubMed] [Google Scholar]
- 9. Bulazel K., et al. 2006. Cytogenetic and molecular evaluation of centromere-associated DNA sequences from a marsupial (Macropodidae: Macropus rufogriseus) X chromosome. Genetics 172:1129–1137 [DOI] [PMC free article] [PubMed] [Google Scholar]
- 10. Bulazel K. V., Ferreri G. C., Eldridge M. D., O'Neill R. J. 2007. Species-specific shifts in centromere sequence composition are coincident with breakpoint reuse in karyotypically divergent lineages. Genome Biol. 8:R170. [DOI] [PMC free article] [PubMed] [Google Scholar]
- 11. Burk A., Springer M. 2000. Intergeneric relationships among Macropodoidea (Metatheria:Diprotodontia) and the chronicle of kangaroo evolution. J. Mammalian Evol. 7:213–237 [Google Scholar]
- 12. Burton F. H., et al. 1986. Conservation throughout mammalia and extensive protein-encoding capacity of the highly repeated DNA long interspersed sequence one. J. Mol. Biol. 187:291–304 [DOI] [PubMed] [Google Scholar]
- 13. Cantrell M. A., et al. 2005. MysTR: an endogenous retrovirus family in mammals that is undergoing recent amplifications to unprecedented copy numbers. J. Virol. 79:14698–14707 [DOI] [PMC free article] [PubMed] [Google Scholar]
- 14. Capy P. 2005. Classification and nomenclature of retrotransposable elements. Cytogenet. Genome Res. 110:457–461 [DOI] [PubMed] [Google Scholar]
- 15. Carone D. M., et al. 2009. A new class of retroviral and satellite encoded small RNAs emanates from mammalian centromeres. Chromosoma 118:113–125 [DOI] [PubMed] [Google Scholar]
- 16. Casavant N. C., et al. 2000. The end of the LINE?: lack of recent L1 activity in a group of South American rodents. Genetics 154:1809–1817 [DOI] [PMC free article] [PubMed] [Google Scholar]
- 17. Choo K. 1997. The centromere. Oxford University Press, Oxford, United Kingdom [Google Scholar]
- 18. Dewannieux M., Heidmann T. 2005. LINEs, SINEs and processed pseudogenes: parasitic strategies for genome modeling. Cytogenet. Genome Res. 110:35–48 [DOI] [PubMed] [Google Scholar]
- 19. Dimmic M., Rest J., Mindell D., Goldstein R. 2002. rtREV: an amino acid substitution matrix for inference of retrovirus and reverse transcriptase phylogeny. J. Mol. Evol. 55:65–73 [DOI] [PubMed] [Google Scholar]
- 20. Druker R., Whitelaw E. 2004. Retrotransposon-derived elements in the mammalian genome: a potential source of disease. J. Inherit. Metab. Dis. 27:319–330 [DOI] [PubMed] [Google Scholar]
- 21. Edgar R. C. 2004. MUSCLE: multiple sequence alignment with high accuracy and high throughput. Nucleic Acids Res. 32:1792–1797 [DOI] [PMC free article] [PubMed] [Google Scholar]
- 22. Edgar R. C. 2010. Search and clustering orders of magnitude faster than BLAST. Bioinformatics 26:2460–2461 [DOI] [PubMed] [Google Scholar]
- 23. Ferreri G. C., Liscinsky D. M., Mack J. A., Eldridge M. D., O'Neill R. J. 2005. Retention of latent centromeres in the mammalian genome. J. Hered. 96:217–224 [DOI] [PubMed] [Google Scholar]
- 24. Ferreri G. C., Marzelli M., Rens W., O'Neill R. J. 2004. A centromere-specific retroviral element associated with breaks of synteny in macropodine marsupials. Cytogenet. Genome Res. 107:115–118 [DOI] [PubMed] [Google Scholar]
- 25. Flannery T. F. 1989. Phylogeny of the Macropodoidea: a study in convergence, p. 1–46 In Grigg P., Hume I. (ed.), Kangaroos, wallabies and rat-kangaroos. Surrey Beatty and Sons, Chipping Norton, Australia [Google Scholar]
- 26. Furano A. V. 2000. The biological properties and evolutionary dynamics of mammalian LINE-1 retrotransposons. Prog. Nucleic Acid Res. Mol. Biol. 64:255–294 [DOI] [PubMed] [Google Scholar]
- 27. Furano A. V., Duvernell D. D., Boissinot S. 2004. L1 (LINE-1) retrotransposon diversity differs dramatically between mammals and fish. Trends Genet. 20:9–14 [DOI] [PubMed] [Google Scholar]
- 28. Gentles A. J., et al. 2007. Evolutionary dynamics of transposable elements in the short-tailed opossum Monodelphis domestica. Genome Res. 17:992–1004 [DOI] [PMC free article] [PubMed] [Google Scholar]
- 29. Gifford R., Kabat P., Martin J., Lynch C., Tristem M. 2005. Evolution and distribution of class II-related endogenous retroviruses. J. Virol. 79:6478–6486 [DOI] [PMC free article] [PubMed] [Google Scholar]
- 30. Grahn R. A., Rinehart T. A., Cantrell M. A., Wichman H. A. 2005. Extinction of LINE-1 activity coincident with a major mammalian radiation in rodents. Cytogenet. Genome Res. 110:407–415 [DOI] [PubMed] [Google Scholar]
- 31. Graves J. A., Dawson G. W. 1988. The relationship between position and expression of genes on the kangaroo X chromosome suggests a tissue-specific spread of inactivation from a single control site. Genet. Res. 51:103–109 [DOI] [PubMed] [Google Scholar]
- 32. Griffiths D. J. 2001. Endogenous retroviruses in the human genome sequence. Genome Biol. 2:REVIEWS1017. [DOI] [PMC free article] [PubMed] [Google Scholar]
- 33. Guindon S., Gasuel O. 2003. A simple, fast, and accurate algorithm to estimate large phylogenies by maximum likelihood. Syst. Biol. 52:696–704 [DOI] [PubMed] [Google Scholar]
- 34. Hasegawa M., Kishino H., Yano T. 1985. Dating of the human-ape splitting by a molecular clock of mitochondrial DNA. J. Mol. Evol. 22:160–174 [DOI] [PubMed] [Google Scholar]
- 35. Houben A., et al. 2007. CENH3 interacts with the centromeric retrotransposon cereba and GC-rich satellites and locates to centromeric substructures in barley. Chromosoma 116:275–283 [DOI] [PubMed] [Google Scholar]
- 36. Huelsenbeck J. P., Ronquist F. 2001. MRBAYES: Bayesian inference of phylogenetic trees. Bioinformatics 17:754–755 [DOI] [PubMed] [Google Scholar]
- 37. Hughes J. F., Coffin J. M. 2001. Evidence for genomic rearrangements mediated by human endogenous retroviruses during primate evolution. Nat. Genet. 29:487–489 [DOI] [PubMed] [Google Scholar]
- 38. Jukes T. H., Cantor C. R. 1969. Evolution of protein molecules, p. 21–132 In Munro H. N. (ed.), Mammalian protein metabolism. Academic Press, New York, NY [Google Scholar]
- 39. Jurka J., et al. 2005. Repbase update, a database of eukaryotic repetitive elements. Cytogenet. Genome Res. 110:462–467 [DOI] [PubMed] [Google Scholar]
- 40. Kajikawa M., Okada N. 2002. LINEs mobilize SINEs in the eel through a shared 3′ sequence. Cell 111:433–444 [DOI] [PubMed] [Google Scholar]
- 41. Lander E. S., et al. 2001. Initial sequencing and analysis of the human genome. Nature 409:860–921 [DOI] [PubMed] [Google Scholar]
- 42. Le Rouzic A., Boutin T. S., Capy P. 2007. Long-term evolution of transposable elements. Proc. Natl. Acad. Sci. U. S. A. 104:19375–19380 [DOI] [PMC free article] [PubMed] [Google Scholar]
- 43. Lomiento M., Jiang Z., D'Addabbo P., Eichler E. E., Rocchi M. 2008. Evolutionary-new centromeres preferentially emerge within gene deserts. Genome Biol. 9:R173. [DOI] [PMC free article] [PubMed] [Google Scholar]
- 44. Lynch C., Tristem M. 2003. A co-opted gypsy-type LTR-retrotransposon is conserved in the genomes of humans, sheep, mice, and rats. Curr. Biol. 13:1518–1523 [DOI] [PubMed] [Google Scholar]
- 45. Matzke M. A., Mette M. F., Matzke A. J. 2000. Transgene silencing by the host genome defense: implications for the evolution of epigenetic control mechanisms in plants and vertebrates. Plant Mol. Biol. 43:401–415 [DOI] [PubMed] [Google Scholar]
- 46. Mayer J., Meese E. 2005. Human endogenous retroviruses in the primate lineage and their influence on host genomes. Cytogenet. Genome Res. 110:448–456 [DOI] [PubMed] [Google Scholar]
- 47. McClintock B. 1929. Chromosome morphology in Zea mays. Science 69:629. [DOI] [PubMed] [Google Scholar]
- 48. Medstrand P., et al. 2005. Impact of transposable elements on the evolution of mammalian gene regulation. Cytogenet. Genome Res. 110:342–352 [DOI] [PubMed] [Google Scholar]
- 49. Metcalfe C. J., et al. 2007. Genomic instability within centromeres of interspecific marsupial hybrids. Genetics 177:2507–2517 [DOI] [PMC free article] [PubMed] [Google Scholar]
- 50. Murphy F. A., et al. 1995. Virus taxonomy: sixth report of the International Committee on the Taxonomy of Viruses. Springer-Verlag, New York, NY [Google Scholar]
- 51. O'Neill R. J., Eldridge M. D., Metcalfe C. J. 2004. Centromere dynamics and chromosome evolution in marsupials. J. Hered. 95:375–381 [DOI] [PubMed] [Google Scholar]
- 52. O'Neill R. J. W., O'Neill M. J., Graves J. A. M. 1998. Undermethylation associated with retroelement activation and chromosome remodeling in an interspecific mammalian hybrid. Nature 393:68–72 [DOI] [PubMed] [Google Scholar]
- 53. Ovchinnikov I., Troxel A. B., Swergold G. D. 2001. Genomic characterization of recent human LINE-1 insertions: evidence supporting random insertion. Genome Res. 11:2050–2058 [DOI] [PMC free article] [PubMed] [Google Scholar]
- 54. Pfaffl M. W. 2001. A new mathematical model for relative quantification in real-time RT-PCR. Nucleic Acids Res. 29:e45. [DOI] [PMC free article] [PubMed] [Google Scholar]
- 55. Prudhomme S., Bonnaud B., Mallet F. 2005. Endogenous retroviruses and animal reproduction. Cytogenet. Genome Res. 110:353–364 [DOI] [PubMed] [Google Scholar]
- 56. Rens W., et al. 2003. Reversal and convergence in marsupial chromosome evolution. Cytogenet. Genome Res. 102:282–290 [DOI] [PubMed] [Google Scholar]
- 57. Rens W., O'Brien P. C., Yang F., Graves J. A., Ferguson-Smith M. A. 1999. Karyotype relationships between four distantly related marsupials revealed by reciprocal chromosome painting. Chromosome Res. 7:461–474 [DOI] [PubMed] [Google Scholar]
- 58. Ronquist F., Huelsenbeck J. P. 2003. MrBayes 3: Bayesian phylogenetic inference under mixed models. Bioinformatics 19:1572–1574 [DOI] [PubMed] [Google Scholar]
- 59. Schueler M. G., Higgins A. W., Rudd M. K., Gustashaw K., Willard H. F. 2001. Genomic and genetic definition of a functional human centromere. Science 294:109–115 [DOI] [PubMed] [Google Scholar]
- 60. Smit A. F. 1999. Interspersed repeats and other mementos of transposable elements in mammalian genomes. Curr. Opin. Genet. Dev. 9:657–663 [DOI] [PubMed] [Google Scholar]
- 61. Smit A. F., Toth G., Riggs A. D., Jurka J. 1995. Ancestral, mammalian-wide subfamilies of LINE-1 repetitive sequences. J. Mol. Biol. 246:401–417 [DOI] [PubMed] [Google Scholar]
- 62. Smit A. F. A., Hubley R., Green P. 2005. RepeatMasker. Institute for Systems Biology, Seattle WA: http://repeatmasker.org [Google Scholar]
- 63. Sverdlov E. D. 1998. Perpetually mobile footprints of ancient infections in human genome. FEBS Lett. 428:1–6 [DOI] [PubMed] [Google Scholar]
- 64. Sverdlov E. D. 2000. Retroviruses and primate evolution. Bioessays 22:161–171 [DOI] [PubMed] [Google Scholar]
- 65. Thompson J. D., Higgins D. G., Gibson T. J. 1994. CLUSTAL W: improving the sensitivity of progressive multiple sequence alignment through sequence weighting, position-specific gap penalties and weight matrix choice. Nucleic Acids Res. 22:4673–4680 [DOI] [PMC free article] [PubMed] [Google Scholar]
- 66. Tristem M., et al. 1996. Characterization of a novel murine leukemia virus-related subgroup within mammals. J. Virol. 70:8241–8246 [DOI] [PMC free article] [PubMed] [Google Scholar]
- 67. Xia X., Xie Z. 2001. DAMBE: software package for data analysis in molecular biology and evolution. J. Hered. 92:371–373 [DOI] [PubMed] [Google Scholar]
- 68. Yang Z. 1994. Maximum likelihood phylogenetic estimation from DNA sequences with variable rates over sites: approximate methods. J. Mol. Evol. 39:306–314 [DOI] [PubMed] [Google Scholar]


