

Abstract
Unlike other eukaryotes, the protein-coding genes of Trypanosoma cruzi are arranged in large polycistronic gene clusters transcribed by polymerase II (Pol II). Thus, it is thought that trypanosomes rely solely on posttranscriptional processes to regulate gene expression. Here, we show that the glucosylated thymine DNA base (β-d-glucosyl-hydroxymethyluracil or base J) is present within sequences flanking the polycistronic units (PTUs) in T. cruzi. The loss of base J at sites of transcription initiation, via deletion of the two enzymes that regulate base J synthesis (JBP1 and JBP2), correlates with an increased rate of Pol II transcription and subsequent genome-wide increase in gene expression. The affected genes include virulence genes, and the resulting parasites are defective in host cell invasion and egress. These studies indicate that base J is an epigenetic factor regulating Pol II transcription initiation in kinetoplastids and provides the first biological role of the only hypermodified DNA base in eukaryotes.
INTRODUCTION
Trypanosoma cruzi, the protozoan parasite that causes Chagas' disease, is the major cause of cardiac disease in South and Central America (1). The parasite has a complex life cycle with two hosts and four developmental stages. Epimastigotes develop in the hindgut of the triatomine insect vector and differentiate into metacyclic forms. Infective metacyclic forms enter the vertebrate host, invade the host cell, and differentiate to form amastigotes. Trypomastigotes released from the infected cell are able to reinvade a wide variety of host cells. Success of the parasite throughout the life cycle is ensured by the regulated expression of surface proteins such as mucin and trans-sialidase, which allow differential adherence and evasion of the host immune responses (2). Members of the surface glycoprotein gene family colocalize with a novel hypermodified DNA base, β-d-glucosyl-hydroxymethyluracil or base J, suggesting an epigenetic mechanism of regulating T. cruzi pathogenesis (3).
In base J, the thymine base exhibits O-linked glucosylation in telomeric DNA of all kinetoplastid flagellates and some closely related unicellular flagellates, but base J is not present in the genomes of other protozoa or metazoa (3, 4). Base J was initially discovered on the basis of its distinct presence within the 19 silent telomeric variant surface glycoprotein (VSG) expression sites (ES) of Trypanosoma brucei but absence from the single transcribed ES, suggesting its role in the regulation of telomeric VSG gene expression (3, 35). Recent genome-wide analysis revealed that base J is also present throughout the T. brucei genome, enriched at regions flanking polymerase II (Pol II) polycistronic transcription units (PTUs) (9). PTUs are large gene clusters that are cotranscribed by Pol II to yield polycistronic pre-mRNAs that are then processed into mature mRNAs by trans-splicing and polyadenylation (7). The localization of base J at PTU-flanking regions suggests a role for the modified base in regulating Pol II transcription initiation and termination and therefore trypanosome gene expression. However, the regulation of trypanosome gene expression is thought to occur primarily via differential mRNA decay or other posttranscriptional mechanisms (for reviews, see references 7 and 27). To date, there is no evidence for regulation of gene expression at the level of Pol II transcription in kinetoplastids. At this time, very little is understood about the DNA sequences and proteins involved in transcription initiation and termination. With the exception of the spliced-leader RNA promoter, Pol II promoters and associated factors have not been identified. Thus, how Pol II transcription is initiated/regulated remains an unanswered question. While the localization of base J in the genome of T. brucei has suggested its involvement in regulating antigenic variation and Pol II transcription, no direct evidence has been provided.
Base J is synthesized in a two-step pathway, where a thymidine hydroxylase enzyme converts a thymidine residue in DNA to hydroxymethyldeoxyuridine (HOMedU), and then a glucosyltransferase converts HOMedU into base J by the addition of glucose (3, 31). Previous work has identified two distinct thymidine hydroxylases involved in base J biosynthesis, JBP1 and JBP2 (8, 33, 36). Deletion of JBP1 (base J binding protein 1) and JBP2 in T. brucei resulted in 20- and 8-fold reduction in base J levels, respectively (8, 11, 23). Deletion of both enzymes resulted in a trypanosome cell line unable to synthesize base J (J null) (8). Analysis of JBP function in T. brucei has indicated that JBP1 and JBP2 are each able to stimulate de novo base J synthesis but have different chromatin/substrate specificities (9). JBP1 preferentially stimulates de novo J synthesis at PTU-flanking regions, while JBP2 prefers telomeric substrates. However, optimal maintenance of base J at the PTU flanks by JBP1 requires JBP2 function.
To elucidate the function of base J in T. cruzi, we manipulated base J levels through deletion of JBP1 or JBP2. We show that similar to T. brucei, base J is localized at sequences involved in Pol II transcription initiation and termination in T. cruzi, and its synthesis is regulated by JBP1 and JBP2. Analysis of the JBP mutant cell lines demonstrates that base J regulates the rate of Pol II transcription, gene expression, and virulence of T. cruzi. These results provide a clear biological function of the only hypermodified DNA base identified in eukaryotes and demonstrate its role in regulating transcription in an important pathogenic organism where this process is not well understood. We also describe, for the first time, epigenetic regulation of virulence through transcriptional control in T. cruzi.
MATERIALS AND METHODS
Growth of cells.
T. cruzi strain Y epimastigotes were grown in liver infusion tryptose (LIT) medium as previously described (6). Cultures were harvested at mid-log phase by centrifugation. Metacyclic forms were obtained from epimastigotes by axenic induction as described previously (10). Briefly, epimastigotes were transferred to Grace's insect medium supplemented with 10% fetal bovine serum (FBS) and grown for 10 to 14 days at 37°C. Differentiated metacyclic forms were purified using TAAUAG medium and confirmed by their morphology. These metacyclic forms were then used to infect irradiated Vero cells and myoblasts as previously described (13). Trypomastigotes were then grown in monolayers of Vero cells/myoblasts in modified Eagle's medium (MEM) containing 20% fetal bovine serum. Emergent trypomastigotes were harvested daily and examined by light microscopy. Preparations containing >95% of trypomastigotes were used in the subsequent assays.
Targeted deletion of JBP1 and JBP2.
In order to generate T. cruzi JBP1 and JBP2 double knockout (dKO) cell lines, we adopted the same technique used to generate the T. brucei JBP knockout (JBPKO) cell lines (8, 11). Briefly, 5′ and 3′ untranslated region (UTR) sequences of JBP1 and JBP2 were inserted flanking the drug markers of the deletion plasmid constructs PTREX-Neo, PTREX-hygro, pTub-Puro, and pTub-BLAST (22). PCR was used to generate 5′ and 3′ noncoding regions (250 to 300 bp) of JBP1 and JBP2. Twenty to 50 μg of KpnI- and XbaI-digested plasmid DNA was used for each transfection, and cells were selected under drug pressure for 5 to 10 weeks (21). We used 100 μg/ml neomycin (G418), 100 μg/ml of hygromycin, 5 μg/ml of puromycin, and 10 μg/ml of blastocidin for selection. This allows the targeted deletion of the JBP1 and JBP2 open reading frames (ORFs) and insertion of the drug markers via homologous recombination. Drug-resistant clones were then selected after limited dilution. Clones were screened by PCR for the absence of ORFs and used in subsequent analysis.
Microarray analysis.
Total RNA isolation, cDNA synthesis, labeling, and array analysis were performed as previously described (25). Briefly, total RNA was isolated using TRIzol and cleaned up with RNeasy kit (Qiagen, Valencia, CA) per the manufacturer's instructions. cDNA was synthesized using SuperScript II reverse transcriptase (Life Technologies, Grand Island, NY) and Cy3- or Cy5-labeled dUTP (Amersham Pharmacia Biotech) included in the reaction mix. Unincorporated fluorescence nucleotide was removed using GFX columns per the manufacturer's instructions. Microarrays were obtained from the Pathogen Functional Genomic resource center and contained an array of 12,288 70-mer oligonucleotides, each with complementarity to an individual T. cruzi open reading frame (representing a total of 7,865 genes on the array). The microarray was prehybridized immediately before hybridization. Three hybridizations were performed for each life stage. Arrays were scanned on a ScanArray 4000 (GSI Lumonics, Wilmington, MA) to obtain Tagged Image File Format (TIFF) images. Microarray scans were quantified using The Institute of Genomic Research (TIGR) SpotFinder module of TM4 (http://www.tm4.org). Quantification was carried out as previously described (25). Further, files generated from SpotFinder were imported to TIGR Microarray Data analysis system (MIDAS) module of TM4 (http://www.tm4.org) and further analyzed using TIGR MultiExperimental Viewer (MeV) software as previously described. We analyzed the results files using multiclass significant analysis of microarray (SAM) for triplicates and hierarchical cluster analysis. Since the JBPKO cell lines were derived from T. cruzi strain Y, we utilized the Esmeraldo allele of the annotated T. cruzi CL Brenner genome to identify the localization of affected genes.
Spliced-leader trapping.
RNA extraction, library construction, and bioinformatic analysis were performed essentially as previously described (26). Briefly, first-strand cDNA was synthesized from poly(A) RNA using random hexamers and SuperScript II reverse transcriptase. In order to process multiple samples in one sequencing channel, a four-nucleotide barcode was added to the 3′ ends of the cDNAs. After amplification and size fractionation to 120 to 160 bp, the cDNA library was sequenced on a Genome Analyzer (GA-II; Illumina) using the Chrysalis 36-cycle v3.0 sequencing kit and 76 cycles. Base calling was performed using the Genome Analyzer Pipeline software (Illumina), and linker sequences were removed while separating reads according to identified barcodes. Only sequence reads of inserts with a length of at least 24 nucleotides were retained. The reads were mapped to the genome sequence of T. cruzi CL Brenner strain using maq (http://maq.sourceforge.net) with n = 3 and an effective first-read length of 24 nucleotides. Single-mapping reads were separated from multimapping reads by an alignment quality threshold of 30. Tag counts were normalized to the library size (number of reads with a length of 24 or more nucleotides) and scaled linearly to reflect counts of tags per million (TPM). Mapped tags were assigned to the annotated protein-coding gene 3′ of the tag. Data were exported in tabular format and general feature format (GFF) (http://www.sanger.ac.uk/Software/formats/GFF/) and then visualized using Gbrowse. Differences in the levels of expression of a gene in wild-type (WT) and JBP1KO cells were tested for significance according to Audic and Claverie with a threshold of P < 10−5 (1a). Antisense splice sites were detected using bioperl. R and perl scripts were used for statistical analysis and plotting. All bioinformatic tools, programs, and pipelines used in this study will be provided upon request.
Quantitative reverse transcription-PCR (qRT-PCR).
Total RNA was obtained from three biological replicate samples of parasites at each life stage as described above. First-strand cDNA was synthesized from 1 μg of total RNA using an iScript cDNA synthesis kit (Bio-Rad Laboratories, Hercules, CA) per the manufacturer's instructions. Heat-inactivated cDNA reaction mixtures were finally treated with RNase H at 37°C for 45 min. Quantification of selected up- and downregulated genes were performed on an iCycler with an iQ5 multicolor real-time PCR detection system (Bio-Rad Laboratories, Hercules, CA). Primer sequences used in the analysis are available upon request. The reaction mixture contains 5 pmol forward and reverse primer, 2× iQ SYBR green super mix (Bio-Rad Laboratories, Hercules, CA), and 2 μl of template cDNA. Standard curves were prepared for each gene using 10-fold dilutions of known quantity (15 ng/μl) of WT DNA. The quantities were calculated using iQ5 optical detection system software. Each sample was normalized to the average of three unaffected genes, including 24S rRNA. The average ratios were calculated for each gene using 3 stage samples and 3 reference samples for comparison.
Transcription assays.
The in vivo transcription assay was performed as previously described (16). Briefly, epimastigotes and freshly released trypomastigotes were preincubated for 1 h with medium (LIT or MEM) containing 10% FBS previously dialyzed against 0.25 N NaCl. Parasites (5 × 10⁶) were incubated with medium containing 4 μCi of 5,6-3H-labeled uridine (37 Ci/mmol; Perkin Elmer, Waltham, MA) for 20 h. At least 5 samples were taken during different time points. Following labeling, the cells were isolated by centrifugation and lysed in 0.01% sodium dodecyl sulfate (SDS). The lysate was vigorously mixed with 4.5 ml of 10% ice-cold TCA solution and left on ice for 30 to 60 min. The acid-precipitable material was recovered on Whatman GF/C glass fiber filters, washed 3 times with 5% trichloroacetic acid (TCA), and then washed once with 95% ethanol. The dried filter pads were counted in a toluene-based scintillation fluid in a Beckman liquid scintillation counter.
The in vitro transcription assay was performed using lysolecithin-permeabilized cells as previously described (1). Briefly, 2 × 10⁸ log-phase epimastigotes were washed twice with transcription buffer (20 mM potassium glutamate, 3 mM MgCl2, 150 mM sucrose, 10 μg/ml leupeptin, and 1 mM dithiothreitol) and chilled on ice for 5 min. Palmitoyl-l-α-lysophosphatidylcholine was added at a final concentration of 500 μg/ml to permeabilize the cells. After 1 min, the parasites were centrifuged and resuspended in 200 μl of transcription buffer containing 2 mM dATP, 1 mM dCTP, 1 mM dGTP, 6 mg/ml creatine kinase, 25 mM creatine phosphate, and 100 μCi of [α-32P]UTP (300 Ci/mmol). After 30 min at 30°C, the parasites were lysed, and RNA was extracted using TRIzol. Labeled RNA was then hybridized to slot blots containing 5 to 10 μg of plasmid DNA in hybridization buffer (5× saline-sodium phosphate-EDTA, 5× Denhardt's solution, 0.1 mg/ml tRNA. and 0.1% SDS). Slot blots were prepared as previously described (1) using denatured plasmid DNA containing probes for multigene family members/multicopy genes and other single-copy genes and regions. The primer sequences used to generate these probes will be provided upon request. Dot blots to detect transcription of sense and antisense strands within a strand switch region (SSR) were prepared by spotting 2 μg of 50-mers as previously described (30). The oligonucleotides used in this run-on assay are available upon request. Hybridization was carried out at 65°C for 48 h, and the slot blot was washed as a regular Northern blot is washed. Data were quantified using a phosphorimager.
Mammalian cell invasion assay.
Mammalian cell invasion assays were performed using previously described methods (5). Vero cells were plated on 13-mm round coverslips at a density of 3 × 10⁴ cells in MEM with 10% fetal calf serum (FCS) and cultivated in 24-well plates for 24 h at 37°C in a 5% CO2 atmosphere. Coverslips with attached cells were then washed three times with phosphate-buffered saline (PBS) to remove the unattached cells and debris. Freshly released trypomastigotes from cultures of infected Vero cells and purified metacyclic forms were used for invasion assays. Parasites were centrifuged to remove the cell debris and seeded onto the Vero cells in equal numbers (5 × 10⁶ parasites/well). After 3 h at 37°C, the interaction was stopped by removing the parasites and washing the cells three times with PBS. Monolayers were fixed and stained with amastigote-specific antibodies and/or Giemsa stain. Invasion was quantified by counting the number of intracellular parasites in a total of 100 cells per coverslip. Values are means ± standard deviations (SDs) of at least three independent experiments.
Anti-base J dot blot analysis and immunoprecipitation.
Anti-base J immunoblots were used to determine the global genomic levels of base J as previously described (15). Serially diluted DNA from WT and JBPdKO cells were blotted onto nitrocellulose membranes. The membranes were then incubated with anti-base J antibodies, detected with horseradish peroxidase (HRP)-conjugated goat anti-rabbit antibodies, and visualized with enhanced chemiluminescence (ECL). DNA loading was determined by hybridization using a 32P-labeled tubulin probe. DNA fragments containing base J were immunoprecipitated and quantitated by dot blot analysis as previously described (15). The hybridization signals were quantitated by phosphorimager analysis.
mRNA degradation experiments.
Total RNA was obtained from WT and JBP1dKO samples of 5 × 10⁶ cells taken at different times after the addition of 100 μg/m1 of actinomycin D. Total RNA was extracted from each sample, and qRT-PCR was performed using the method described above. mRNA half-lives were estimated after normalizing the values to 24S rRNA values and plotted on semilogarithmic scales. The half-life of the mRNA is calculated as the amount of time required for a transcript to decrease to 50% of the initial amount. Half-life values were compared using Student's t test, and a P value of <0.001 was considered statistically significant.
Microarray data accession number.
The microarray data were deposited in and can be accessed at Gene Expression Omnibus (GEO) (at http://www.ncbi.nlm.nih.gov/projects/geo/) under accession number GSE23855.
RESULTS
JBP1 and JBP2 knockout cell lines of T. cruzi contain reduced levels of base J.
In order to characterize the role of base J in T. cruzi, we generated thymidine hydroxylase mutant cell lines by targeted removal of JBP1 and JBP2 from the genome (Fig. 1). After transfection with the appropriate JBP knockout (JBPKO) construct (Fig. 1A and B), drug-resistant parasites were screened by PCR and Southern blot analysis to confirm proper integration (data not shown) and the loss of JBP1 and JBP2 gene sequence (data not shown and Fig. 1C and D). The corresponding loss of JBP mRNA was confirmed by Northern blot analysis (data not shown) and microarray analysis (see below). Similar to the effect of JBP loss of function in T. brucei, JBP2 and JBP1 double knockout (dKO) T. cruzi cell lines have 8- and 20-fold reduction in their base J levels, respectively (Fig. 1E).
Fig. 1.

JBP knockout (JBPKO) cells have reduced levels of base J. (A to D) Generation of the JBP2 double knockout (JBP2dKO) and JBP1dKO cell lines. (A and B) Schematic diagrams of targeted deletion of JBP2 and JBP1 ORFs using neomycin (Neo), hygromycin (Hyg), and puromycin (Puro) deletion constructs. Homologous regions are indicated by the hatched bars. The black bars above the JBP ORF indicate the positions of the probes used for Southern blotting. A, AlwNI; X, Xcm1; B, BamHI; H, HindIII. (C and D) Southern blot analysis to confirm the loss of JBP2 and JBP1 ORFs. AlwNI-and-XcmI- or BamH-and-HindIII-digested genomic DNAs from the indicated cell lines (WT, single knockout [sKO], and double knockout [dKO]) were fractionated by gel electrophoresis, blotted onto nylon membranes, and hybridized using radioactive probes for the corresponding JBP ORFs. The stripped blots were hybridized with radioactively labeled tubulin probe as a control for DNA loading. Southern blot analysis for the JBP2 ORF results in two bands due to a restriction site polymorphism existing in the two alleles. (E) Reduction of global levels of base J in JBP1 and JBP2 knockout cells. DNA was isolated from the indicated cell lines, blotted onto nitrocellulose membrane in a 2-fold dilution series, and incubated with anti-base J antisera (αJ). The membrane was then hybridized with a radioactive tubulin probe to control for DNA loading.
Earlier studies have shown base J to be distributed in telomeric and subtelomeric regions of T. cruzi (15). This includes the telomeric repeat arrays and subtelomeric localized repeat elements (VIPER), retrotransposons (L1Tc), and genes encoding surface proteins. Analysis of the JBP mutant cell lines by anti-base J immunoprecipitation (IP) and dot blot hybridization and/or PCR indicates that the amount of base J is either reduced or absent in these telomeric and subtelomeric regions (see Fig. S1A to C in the supplemental material). This is particularly apparent in JBP1dKO cell lines, where the levels of base J are reduced by 40% in telomeric repeats, by 80% within subtelomeric localized VIPER and LITc elements, and to undetectable levels in other subtelomeric regions. Overall, while there is an apparent global reduction in base J levels in the mutant T. cruzi cell lines, the reduction in specific regions differs due to the loss of JBP1 or JBP2. These results are consistent with previous analysis of JBP function in T. brucei (9).
JBP1 and JBP2 regulate base J synthesis in Pol II PTU-flanking regions.
We have recently shown that base J is localized within regions flanking polymerase II (Pol II) polycistronic transcription units (PTUs) of T. brucei and Leishmania (9). These regions include convergent and divergent strand switch regions (SSRs), which demarcate sequences involved in Pol II transcription initiation and termination (17, 30, 32). In order to investigate the internal localization of base J in T. cruzi, we analyzed 13 randomly chosen SSRs by anti-base J chromatin immunoprecipitation (ChIP) and PCR. Base J was found in all convergent and divergent SSRs analyzed in WT cells (Fig. 2). Deletion of JBP1 resulted in the loss of base J from all of the SSRs, while several of these regions retain significant levels of base J upon the deletion of JBP2 (Fig. 2A to D). This result is consistent with our previous observations that in T. brucei, JBP1 is the key regulator of base J synthesis at PTU-flanking regions (9). In T. cruzi, the requirement for JBP2 is particularly evident at divergent SSRs. Overall, the results indicate that similar to other trypanosomatids, base J is localized at Pol II transcription start sites (TSSs) and transcription termination sites (TTSs) in the genome of T. cruzi. Furthermore, the synthesis of base J within these regions is regulated by JBP1 and JBP2.
Fig. 2.

JBP1 and JBP2 regulate base J synthesis in polycistronic unit (PTU)-flanking regions of T. cruzi. (A and B) Schematic diagram of a divergent strand switch region (SSR) (A) and a convergent SSR (B) and the distribution of base J analyzed by anti-base J immunoprecipitation (IP) and PCR of representative regions of the T. cruzi genome (below). In, input. The boxes represent ORFs. The black lines indicate the PCR-amplified regions tested in the IP reactions shown below. The identities of the SSRs are indicated as previously described (30). (C and D) Anti-base J IP and/or PCR analysis of additional diverging SSRs (C) and converging SSRs (D). The identity of the SSR is indicated below. (E) Distribution of base J within an entire ∼200-kb-long PTU (AAHK01000001; Trypanosoma cruzi CL Brener strain database) and the flanking divergent and convergent SSRs. PCR-amplified regions are spaced approximately 20 kb apart. The map is not drawn to scale.
Microarray analysis of T. cruzi JBP1 and JBP2 knockouts.
To explore the role of base J in the regulation of transcription, microarray analysis of WT and JBPKO cell lines corresponding to insect (noninfective epimastigote and infective metacyclic) and mammalian (infective trypomastigote) life stages was performed. Duplicate analysis of JBP1dKO epimastigotes showed an average of 160 genes significantly (>2-fold) upregulated, while 110 genes showed significant downregulation compared to the WT cells (Fig. 3 A). We then extended the study to include triplicate analysis of trypomastigotes and metacyclic life stages upon differentiation of the JBP1 and JBP2dKO cells. Significant analysis of microarray (SAM) of the three biological replicates from trypomastigotes determined that 658 transcripts (representing 8% of the genes on the array) exhibited statistically significant up- or downregulation in the JBP1dKO cells with a median false discovery rate (FDR) of 0.7%, while 417 transcripts (5.8% of the genes on the array) were up- or downregulated in JBP2dKO cells to statistically significant levels (FDR of 0.3%). A total of 482 and 341 of these genes were upregulated in JBP1dKO and JBP2dKO cells, respectively (Fig. 3A). The changes and consistency in the biological replicates are apparent in Fig. S2A in the supplemental material. The genome-wide distribution of regulated genes is apparent in Table S1 in the supplemental material. SAM analysis of the metacyclic data showed a high false discovery rate due to significant variation in the number of affected genes in the biological replicates (see Fig. S2B in the supplemental material). This may be due to defects in the efficiency of metacyclogenesis for the JBPKO cell lines (data not shown).
Fig. 3.

Microarray analysis of WT and JBPdKO cell lines. (A) Number of affected genes in JBP1dKO and JBP2dKO cells of epimastigote (Epi), metacyclic (Meta), and trypomastigote (Trypo) life stages as indicated by microarray analysis. The black bars indicate downregulated genes, and the gray bars indicate upregulated genes. (B) Quantitative RT-PCR analysis. Mean log2 ratio (stage/reference) for selected significantly up- or downregulated genes determined by microarray of JBP1dKO trypomastigotes (black bars). The gray bars indicate the genes significantly up- or downregulated genes by qRT-PCR analysis. The values are means ± standard deviations (SDs) (error bars) for three biological replicates. The ORFs are labeled using their GeneIDs (Tc00.1047053 is truncated).
Changes in gene expression of several up- and downregulated genes indicated by the array analysis were confirmed by quantitative reverse transcription-PCR (qRT-PCR) (Fig. 3B; see Fig. S2C in the supplemental material). For all 10 genes showing significant up- or downregulation by array analysis in trypomastigotes, qRT-PCR data agreed in the direction of regulation (Fig. 3B). Similar agreement was seen in the case of epimastigotes (9 out of 10 genes) (see Fig. S2C in the supplemental material). While the extent of up- or downregulation estimated by qRT-PCR and microarray analysis may differ slightly, the direction of regulation is consistent. These differences were likely a result of the differing dynamic ranges of the two platforms (25) and the fact that the RNA samples used for the array and qRT-PCR were not identical. Analysis of the same samples by both techniques gave more closely matching results (see Fig. S2D in the supplemental material). In conclusion, the decrease (JBP2KO) or loss (JBP1KO) of base J at Pol II TSSs and TTSs in T. cruzi led to significant changes in Pol II gene expression of at least 200 to 400 genes in all three life stages analyzed.
Previous studies have demonstrated the ability of a nucleoside analog of thymidine, bromodeoxyuridine (BrdU), to reduce the levels of base J in kinetoplastids by an unknown mechanism (33, 35). We show that growth in 100 μg/ml BrdU results in an ∼16-fold reduction in the levels of base J in T. cruzi (see Fig. S1D in the supplemental material). The levels of base J in WT cells fed BrdU approximates the levels in the JBP1KO cells and results in similar changes in gene expression (see Fig. S2C in the supplemental material). Altered regulation of gene expression in cells with reduced levels of base J in a WT JBP background supports the conclusion that the changes in gene expression observed in the JBPKO cell lines are due solely to defects in base J synthesis.
RNA polymerase activity increases in the JBPdKO cell lines.
Since base J represents a covalent modification of DNA, we proposed that any changes in gene expression in the JBPKO cell lines would be due to effects of the modified base on transcription rather than posttranscription. To address this, we analyzed the mRNA turnover rate of genes that were up- and downregulated in the JBP1dKO epimastigotes and trypomastigotes. We treated cells with 100 μg/ml actinomycin D to inhibit transcription and calculated the half-lives of specific transcripts. The mRNA degradation kinetics of all four upregulated genes analyzed was not significantly affected in the WT and JBP1dKO cells (see Fig. S3A and B and Fig. S3E and F in the supplemental material). Therefore, the increased abundance of the transcripts following the reduction in base J levels in the genome is not due to any increase in mRNA stability. In contrast, all four of the downregulated transcripts in the JBP1KO epimastigotes and trypomastigotes showed an increased mRNA turnover rate compared to WT cells (see Fig. S3C and D and Fig. S3G and H in the supplemental material).
In order to directly address the role of base J in regulating transcription, we compared [3H]uridine incorporation by WT and JBP1dKO cell lines. As shown in Fig. S4A and B in the supplemental material, ∼3-fold more [3H]uridine was incorporated into RNA by epimastigote and trypomastigote JBP1dKO cell lines compared to WT cells. As this difference in labeling efficiency could be due to other possible metabolic defects, we chased [3H]uridine incorporation by adding actinomycin D. As shown in Fig. S4C in the supplemental material, RNAs decay similarly in JBP1dKO and WT cell lines, showing that the difference in [3H]uridine incorporation was in fact due to the higher transcription rate in the JBP1dKO cell lines. In fact, the slightly increased decay rate of RNA in the JBP1dKO cells would suggest that these experiments underrepresent the overall increased rate of transcription.
Nuclear run-on assay quantifies the elongations of nascent mRNA chains already initiated in vivo and thus provides a direct measure of the transcription rate of a particular gene or PTU. To do this, we extracted RNA labeled by in vitro incorporation of [32P]UTP in lysolecithin-permeable epimastigotes of both WT and JBP1dKO cells and used them to probe membranes containing representative genes that are transcribed by Pol I, II, and III. As shown in Fig. 4, JBP1dKO epimastigotes show a significantly higher labeling for a majority of the genes analyzed compared to WT epimastigotes. However, a few genes (i.e., 24S) did not change and act as a loading control. These results were consistently obtained in at least four independent experiments. mRNA encoding Pol II-transcribed multigene family/copy genes (trans-sialidase [TS], 85-kDa surface protein gene [Gp85], amastin, tubulin, and spliced leader [SL] RNA) were transcribed on average ∼3.6-fold more in JBP1dKO cells than in the WT cells (Fig. 4A and Table 1). We also see increased transcription of single-copy genes, including enolase and three genes in the divergent PTU discussed below. The hypothetical gene (Hypo) represents a Pol II-transcribed single-copy gene whose steady-state mRNA levels decreased in the JBP1KO cells. Moreover, we saw 5-fold-higher labeling for Pol III-transcribed 5S genes and 3-fold-higher labeling for Pol I-transcribed small-subunit rRNA (SSU rRNA) gene copies that are, in many cases, localized within a strand switch region (SSR). α-Amanitin titration confirmed that these signals are coming from the appropriate polymerase (data not shown). To evaluate the role of base J in regulating Pol II transcription at the PTU level, we investigated the rate of transcription within a divergent PTU (SSR 7739) using probes against the first three single-copy genes in the unit (Fig. 4A and B). While the steady-state transcript level of one gene increased and another decreased, the transcription rate increased for all three genes in the PTU following the loss of base J.
Fig. 4.
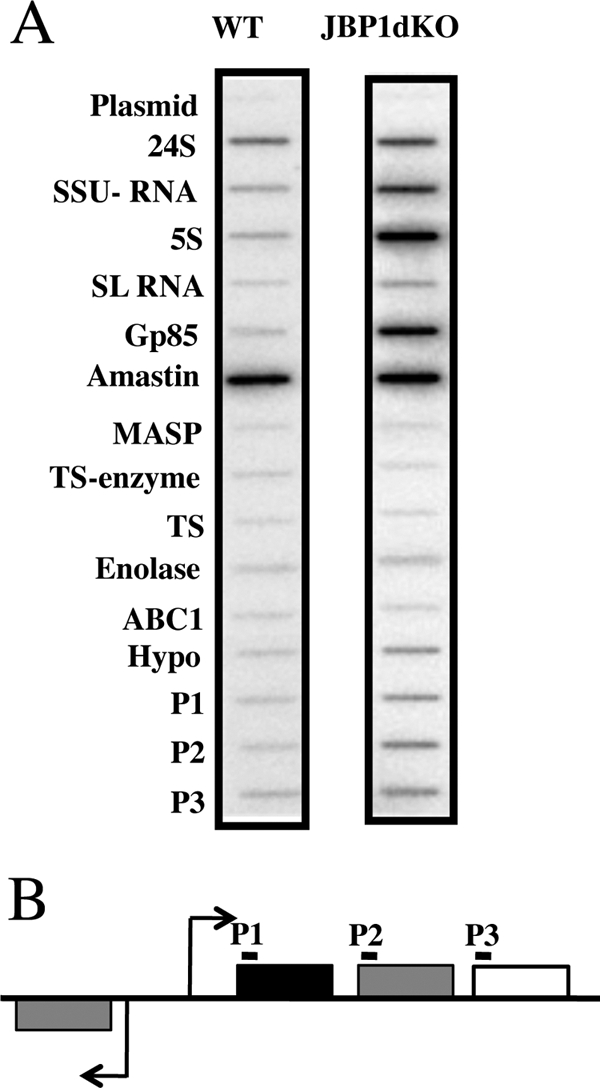
Base J regulates Pol II transcription rate. (A) Lysolecithin-permeabilized parasites from WT and JBP1dKO epimastigotes were labeled with α-32P-uridine for 30 min. The total RNA was extracted and used to probe nitrocellulose filters containing probes for the indicated genes. The blot shown is representative of the results of five independent experiments. The RNAs shown include plasmid RNA, 24S RNA, small-subunit rRNA (SSU- rRNA), spliced-leader (SL) RNA, 85-kDa surface protein gene family (Gp85), mucin-associated surface proteins (MASP), trans-sialidases (TS-enzyme and TS), hypothetical Tc00.1047053508773.9 (Hypo), and ABC1 (Tc00.1047053508221.610). P1, P2, and P3 indicate the sequences from 3 regions within a PTU from divergent SSR 7739 (chromosome 11, 120,001 bp to 160,000 bp). (B) Schematic representation of divergent SSR 7739 to indicate the locations of P1, P2, and P3 probes (black lines). ORFs not represented on the array (gray boxes), ORFs with increased steady-state transcript levels (black box), and ORFs with no change in transcript levels (white box) are indicated.
Table 1.
Increased transcription rate in JBP1KO cells by run-on analysis
| Gene or probe | Mean fold upregulationa | SD |
|---|---|---|
| 24S | 1.00 | |
| SSU RNA | 2.77 | 1.07 |
| 5S | 2.93 | 1.05 |
| SL RNA | 2.44 | 0.98 |
| Gp85 | 4.25 | 2.49 |
| Amastin | 4.24 | 2.91 |
| MASP | 1.23 | 0.47 |
| TS enzyme | 2.27 | 1.34 |
| Enolase | 2.35 | 1.18 |
| Tubulin | 3.80 | 1.41 |
| ABC1 | 1.09 | 0.23 |
| Hypo | 1.40 | 0.65 |
| P1 | 3.64 | 1.42 |
| P2 | 3.43 | 0.75 |
| P3 | 3.11 | 1.05 |
Mean fold upregulation of the transcription rate in WT versus JBP1KO cells.
To verify the strand bias of transcription at TSSs and TTSs, nuclear run-on analysis was performed using strand-specific oligomers spanning SSRs at divergent and convergent PTUs (Fig. 5A and B). In all three divergent regions analyzed, transcription of both strands initiated bidirectionally at similar sites within the SSR in WT and JBP1KO cells (Fig. 5A). Additionally, the increased rate of strand-specific Pol II transcription in the JBP1KO cells is evident in all regions examined, especially at regions closest to the “promoter” (Fig. 5A; see Fig. S5 in the supplemental material). Similar analyses of three convergent SSRs indicate that the loss of base J has no effect on Pol II transcription termination (Fig. 5B). Interestingly, the increased transcription of the sense strand is evident throughout the nascent transcript (Fig. 5B; see Fig. S5 in the supplemental material). In conclusion, the increased rate of Pol II transcription throughout the PTU correlates with the loss of an epigenetic mark at the TSS and the loss of base J at the TTS does not lead to detectable defects in transcription termination.
Fig. 5.

Transcription initiation and termination from sense (s) and antisense (as) strands within divergent and convergent SSRs. Nuclear run-on assay was used to map the transcription start sites (TSSs) and transcription termination sites (TTSs) and measure the strand bias of transcription in divergent and convergent SSRs. Labeled nascent RNA was hybridized to filters spotted with 2 μg of 50-mers corresponding to both the sense (1s to 5s) and antisense strands (1as to 5as) along the SSR. Cartoons represent the divergent SSR (A) and convergent SSR (B) and depict the locations of oligomers used in nuclear run-on assays. The broken-line arrows in panel A represent the approximate locations of the TSSs. The black triangles in panel B indicate the approximate region of transcription termination. The small black boxes represent tRNA. Numbers refer to the SSR analyzed as previously described (30). (Right) Results of run-on analysis of WT and JBP1 dKO epimastigotes. The blots shown are representative of the blots in 2 to 4 experiments. The 24S probe, whose signal does not change in WT and JBP1KO cells (Fig. 4 and Table 1), is included as a loading control.
Genome-wide transcriptome analysis.
To further examine for defects in transcription termination and confirm changes in gene expression, we performed a genome-wide transcriptome analysis using spliced-leader trapping (SLT) (26). This analysis produced more than 3 million sequence tags in wild-type and JBP1KO epimastigote cell lines. The vast majority (≥93%) of these tags mapped to the sense strand in both wild-type and JBP1KO cells, respectively (Table 2). Overall, this analysis indicates a genome-wide increase in Pol II transcript abundance in the JBP1KO epimastigotes (Fig. 6). If the loss of base J at TTSs results in defects in termination, we would expect a decrease in the transcript abundance of the genes proximal to the convergent strand switch region due to an increase in antisense RNA and/or colliding Pol II. However, the percentage of antisense tags ranged from 0.7 to 0.5 in the wild-type and JBP1KO cells, respectively. Since it is often difficult to assign tags in the zones between individual transcription units (including SSRs) to the plus or minus strand, we determined the number of these tags separately. In the wild type, 6.2% of tags were located between PTUs, while 5.6% were assigned to these regions in the JBP1KO cell line. The localization of tags in SSRs is consistent with the TTSs mapped via run-on analysis (Fig. 5; see Fig. S5 in the supplemental material; also data not shown). When we analyzed the transcript abundance of the 5 genes proximal to the TSS or proximal to the TTS for all transcription units with 10 or more genes, we could show a significant difference in how the knockout was affecting the transcript levels in these different groups (P = 0.02, Fisher's exact test). A total of 807 genes at the start of PTUs showed increased transcript abundance in the JBP1KO cells compared to the WT cells, while 481 decreased, and 602 of the genes proximal to the TTS showed increased transcript abundance and 439 showed decreased transcript abundance. Similarly, when we analyzed the transcript abundance of genes proximal to 157 converging strand switch regions, we found no significant change in transcript abundance ratios in the JBP1KO and WT cells (mean ratio of 1.3, P = 0.18; see Table S2 and Fig. S5 in the supplemental material). Thus, there is statistically significant increased transcript abundance at the start of PTUs and no clustering of downregulated genes localizing to the ends of convergent PTUs or increased antisense RNA produced in the JBP1KO cells. In conclusion, genome-wide analysis of transcript abundance supports the overall finding that the loss of base J within SSRs leads to increased Pol II transcription of PTUs and no defect in transcription termination.
Table 2.
Spliced-leader trapping analysis of epimastigote cells
| Parameter | WT cells | JBP1KO cells |
|---|---|---|
| No. of reads | 3,381,708 | 3,247,634 |
| % tags | ||
| Sense | 93 | 94 |
| Antisense | 0.7 | 0.5 |
| SSR | 6.2 | 5.6 |
Fig. 6.

Whole-genome comparison of gene expression levels in WT cells versus JBP1KO cells. The gene expression ratios (log2 of the ratio) along the whole chromosome of the expression of genes in JBP1KO epimastigotes compared to that in WT epimastigotes using RNA sequencing are shown. Each line represents the gene expression ratio of one gene with the color indicating the strandedness (red for the sense strand and blue for the antisense strand). The numbers on the x[r] axis indicate the position on the respective chromosome in base pairs (×105). The boldface numbers in the top right corner of each graph indicate the chromosome number.
Base J regulates the virulence of T. cruzi.
Transcriptome analysis revealed a significant change in the expression of genes associated with virulence and cell homeostasis in the JBPdKO cell lines. For example, several genes encoding surface proteins are upregulated in the infective life stages (metacyclic forms and trypomastigotes) of the JBPdKO cell lines compared to WT cells (see Table S3 in the supplemental material). The results of immunofluorescence analysis of the JBP1dKO cells confirm that trypomastigote mutant cells coexpress trypomastigote- and amastigote-specific surface proteins (see Fig. S6A and B in the supplemental material). One would predict that alterations in the expression of surface proteins would result in significant changes in phenotype (i.e., the ability of the parasite to interact and invade the host cell). To address this, an in vitro invasion assay using both infective life stages of the parasite and mammalian cell cultures was performed. A significant (3- to 5-fold) increase in the efficiency of invasion of metacyclic and trypomastigote parasites was detected corresponding to both JBP1 and JBP2KO cell lines (Fig. 7A). In fact, there was a concomitant increase in invasion efficiency upon the deletion of each JBP allele and subsequent decrease in the level of base J (Fig. 1E; see Fig. S6C in the supplemental material). Moreover, JBP mutant cells showed a significant delay in egress. WT T. cruzi parasites emerge from the mammalian cell within 4 to 7 days postinfection (Fig. 6B). However, the JBP1dKO and JBP2dKO parasites remain in the cell for 4 to 5 weeks. Intracellular amastigote growth rates were similar in WT and JBP1KO cell lines during the first 7 days of culture (see Fig. S6D in the supplemental material). Presumably, a delay in the transition of amastigote to trypomastigote of the JBP mutants within the mammalian cell leads to a delay in egress. In conclusion, our data strongly support the hypothesis that epigenetic regulation of gene expression by base J regulates T. cruzi virulence.
Fig. 7.

Base J regulates T. cruzi virulence. (A) Mammalian invasion. WT and JBPKO parasites were allowed to invade Vero cells/myoblasts for 3 h. The number of parasites/100 cells was determined as described in Materials and Methods. Values are means ± SDs (error bars) of reactions done in triplicate. The stage of the parasite is indicated as follows: black bars, epimastigote; white gray bars, metacyclic form; gray bars, trypomastigote. (B) Parasite egress. WT and JBPdKO amastigote parasites were grown in irradiated Vero cells, and released trypomastigotes were counted on the indicated days postinfection. Symbols: black circles, WT cells; white circles, JBP1dKO cells; triangles, JBP2dKO cells. The error bars represent the standard deviations of three independent experiments.
DISCUSSION
The recent identification of the novel glucosylated thymine DNA base at Pol II TSSs and TTSs in T. brucei and Leishmania suggested that base J plays a role in transcription initiation and termination (9). Here, we demonstrate that base J is also present at TSSs and TTSs in the genome of T. cruzi and that a reduction in or loss of base J at these sites results in an increased rate of Pol II transcription and genome-wide changes in gene expression. These results confirm that base J plays a role in regulating initiation and/or elongation of Pol II transcription. However, the specific localization of base J at TSSs, versus within the PTU, indicates that increased Pol II activity in the JBPKO cell lines is primarily due to increased initiation events. These data provide the first example of epigenetic regulated Pol II transcription in organisms where gene expression is thought to occur mainly at the levels of RNA stability, translation, and protein stability. Furthermore, these studies provide a biological function for the only hypermodified DNA base identified in eukaryotes.
Epigenetic regulation of transcription has been well studied in mammalian and bacterial systems where methylation of DNA is necessary for heritable gene silencing and regulated gene expression (2, 20). In these organisms, the presence of the methylated DNA base at promoter regions or regulatory sequences hinders the binding of Pol II and other transcriptional regulators (24). Alternatively, methylated DNA recruits methylated CpG binding domain (MBD) proteins that interact with histone deacetylase, thus altering chromatin structure and leading to gene silencing (18, 19). We believe that base J regulates transcription in a similar fashion through regulated binding of Pol II and other regulatory proteins via physical hindrance of the glucose moiety present in the major groove of base J-containing DNA and/or modulating chromatin structure. As most transcriptional factors bind the major groove of DNA, the idea that base J can induce steric hindrance is highly plausible. The ability of base J to recruit specific proteins leading to repressed chromatin is unlikely, since the only base J-containing DNA binding protein identified in trypanosome nuclear extracts is the thymidine hydroxylase involved in base J synthesis, JBP1 (12). Gel shift analysis of extracts from the JBP1KO cell line failed to indicate any other base J-containing DNA binding activity. Therefore, either the presence of base J modifies DNA structure by another mechanism, or regulation is due to the glucose moiety interfering with formation of the Pol II initiation complex. Further studies are required to address the mechanism of base J regulation of transcription in T. cruzi.
Regulation of trypanosome mRNA abundance is usually determined by trans-acting factors interacting with cis elements in each mRNA (29). Transcriptome analysis showed significant upregulation of several RNA binding proteins in the JBPKO cells, including a family of proteins (i.e., PUF8) that are known to affect mRNA stability (14). Therefore, increased abundance of certain trans-acting factors following the reduction in base J would lead to the destabilization of specific mRNA transcripts. This would explain the decreased steady-state abundance (and decreased half-life) of certain transcripts in the JBPKO cell lines following an overall increase in PTU transcription rate.
The presence of base J at convergent SSRs suggests that glucosylated DNA may also play a role in regulating transcription termination. However, the data presented here do not support a significant role for base J in Pol II termination in T. cruzi. Defects in termination would likely, as in Saccharomyces cerevisiae, lead to decreased initiation of downstream PTUs and restricted elongation of convergent PTUs due to polymerase collision (28). Furthermore, we would see increased antisense RNA and a subsequent decrease in transcript levels for genes located at the 3′ end of the PTU. However, upon the loss of base J at TTSs of epimastigote and metacyclic cells, more genes are upregulated than downregulated, and downregulated genes do not cluster at 3′ ends of convergent PTUs. In fact, many convergent regions have ORFs that are upregulated in the JBPKO cells in all life stages analyzed. Transcriptome analysis of WT and JBP1KO cells failed to detect any significant difference in the levels of antisense mRNA following the loss of base J at TTSs. Furthermore, direct analysis of nascent sense and antisense mRNA synthesis within three convergent SSRs failed to detect any changes in Pol II termination upon the loss of base J.
The analysis of the JBP1 and JBP2 mutant cell lines, with their differing levels and localization of base J and corresponding differences in the number of genes affected, indicate that modulating base J can have specific gene expression/phenotypic consequences. This correlation is also apparent upon the deletion of each individual JBP allele. For example, upon the generation of the JBP1 single knockout (JBP1sKO) and JBP1dKO cells, we see a stepwise decrease in the levels of base J in the genome (Fig. 1E) as well as parasite metacyclogenesis (data not shown) and the corresponding increased ability of the parasite to invade the mammalian cell (see Fig. S6C in the supplemental material). We believe that the JBP-specific localization and levels of base J at PTU-flanking regions leads to differing levels and/or localization of transcriptional regulation within the genome. Presumably, in the case of the in vitro cell culture assays utilized here, the increase in gene expression changes upon deletion of both alleles of JBP is extensive (i.e., a significant number of genes representing the various surface protein families are upregulated) such that the differences in the total number of genes affected in the JBP1KO and JBP2KO cells are not reflected by a significant change in virulence.
The distribution of base J throughout the T. cruzi genome is unknown. Genome-wide analysis of base J in T. brucei indicated that ∼70% of the PTUs contain detectable levels of base J in PTU-flanking regions (9). Therefore, many PTUs in the T. brucei genome lack significant levels of base J at sites of transcription initiation. Genome-wide analysis of base J distribution combined with transcriptome analysis of additional JBP mutants (i.e., J null cell line) and life stages will provide a more detailed analysis of the function of base J in gene expression in T. cruzi. Interestingly, we have thus far been unable to generate a T. cruzi cell line lacking both JBP1 and JBP2. As previously demonstrated in Leishmania (33), the essential nature of base J in T. cruzi is supported by the dramatic concentration-dependent hypersensitivity to BrdU exhibited by the JBP1KO and JBP2KO cell lines (D. K. Ekanayake and R. Sabatini, unpublished results).
Reduction in the levels of base J in T. cruzi generated parasites with increased invasion efficiency and delayed egress. Whether such changes occur during infection of the mammalian host and lead to changes in pathogenesis are future topics to investigate. The ability of base J to regulate the transcription rate of virulence genes may have an evolutionary advantage for the long-term survival of the parasite in the mammalian host. Therefore, the regulatable presence of base J at the Pol II transcription initiation sites may provide an important control point for gene expression and parasite survival during its life cycle.
Supplementary Material
ACKNOWLEDGMENTS
We thank Sergio Schenkman for assistance with nuclear run-on experiments, Melina Galizzi for help irradiating our mammalian cells, and Norma Andrews for providing the amastin- and trypomastigote-specific antisera. We also thank John Kelly and Martin Taylor for providing plasmid constructs and technical advice and Laura Cliffe for reading the manuscript. We also thank Gwen Hirsch and Laura Cliffe for assistance with qRT-PCR analysis.
This work was supported by National Institutes of Health grant AI063523 (R.S.), American Heart Foundation grant 09PRE2290187 (D.K.E.), National Institutes of Health grant AI044979 (R.T.), and funds from the Swiss National Science Foundation (31003A_125194/1) (T.O.) and Novartis Foundation (T.O.).
Footnotes
Supplemental material for this article may be found at http://mcb.asm.org/.
Published ahead of print on 14 February 2011.
REFERENCES
- 1. Abuin G., Freitas-Junior L. H., Colli W., Alves M. J., Schenkman S. 1999. Expression of trans-sialidase and 85-kDa glycoprotein genes in Trypanosoma cruzi is differentially regulated at the post-transcriptional level by labile protein factors. J. Biol. Chem. 274:13041–13047 [DOI] [PubMed] [Google Scholar]
- 1a. Audic S., Claverie J. M. 1997. The significance of digital gene expression profiles. Genome Res. 7:986–995 [DOI] [PubMed] [Google Scholar]
- 2. Bergman Y., Mostoslavsky R. 1998. DNA demethylation: turning genes on. Biol. Chem. 379:401–407 [DOI] [PubMed] [Google Scholar]
- 3. Borst P., Sabatini R. 2008. Base J: discovery, biosynthesis, and possible functions. Annu. Rev. Microbiol. 62:235–251 [DOI] [PubMed] [Google Scholar]
- 4. Borst P., van Leeuwen F. 1997. β-d-Glucosyl-hydroxymethyluracil, a novel base in African trypanosomes and other Kinetoplastida. Mol. Biochem. Parasitol. 90:1–8 [DOI] [PubMed] [Google Scholar]
- 5. Caler E. V., Vaena de Avalos S., Haynes P. A., Andrews N. W., Burleigh B. A. 1998. Oligopeptidase B-dependent signaling mediates host cell invasion by Trypanosoma cruzi. EMBO J. 17:4975–4986 [DOI] [PMC free article] [PubMed] [Google Scholar]
- 6. Camargo E. P. 1964. Growth and differentiation in Trypanosoma cruzi. I. Origin of metacyclic trypanosomes in liquid media. Rev. Inst. Med. Trop. Sao Paulo 6:93–100 [PubMed] [Google Scholar]
- 7. Clayton C., Shapira M. 2007. Post-transcriptional regulation of gene expression in trypanosomes and leishmanias. Mol. Biochem. Parasitol. 156:93–101 [DOI] [PubMed] [Google Scholar]
- 8. Cliffe L. J., et al. 2009. JBP1 and JBP2 are two distinct thymidine hydroxylases involved in J biosynthesis in genomic DNA of African trypanosomes. Nucleic Acids Res. 37:1452–1462 [DOI] [PMC free article] [PubMed] [Google Scholar]
- 9. Cliffe L. J., Siegel T. N., Marshall M., Cross G. A., Sabatini R. 2010. Two thymidine hydroxylases differentially regulate the formation of glucosylated DNA at regions flanking polymerase II polycistronic transcription units throughout the genome of Trypanosoma brucei. Nucleic Acids Res. 38:3923–3935 [DOI] [PMC free article] [PubMed] [Google Scholar]
- 10. Contreras V. T., Araque W., Delgado V. S. 1994. Trypanosoma cruzi: metacyclogenesis in vitro. I. Changes in the properties of metacyclic trypomastigotes maintained in the laboratory by different methods. Mem. Inst. Oswaldo Cruz 89:253–259 [DOI] [PubMed] [Google Scholar]
- 11. Cross M., et al. 2002. J-binding protein increases the level and retention of the unusual base J in trypanosome DNA. Mol. Microbiol. 46:37–47 [DOI] [PubMed] [Google Scholar]
- 12. Cross M. R., et al. 1999. The modified base J is the target for a novel DNA-binding protein in kinetoplastid protozoans. EMBO J. 18:6573–6581 [DOI] [PMC free article] [PubMed] [Google Scholar]
- 13. da Silva C. V., et al. 2009. Characterization of a 21kDa protein from Trypanosoma cruzi associated with mammalian cell invasion. Microbes Infect. 11:563–570 [DOI] [PubMed] [Google Scholar]
- 14. Droll D., et al. 2010. The trypanosome Pumilio-domain protein PUF7 associates with a nuclear cyclophilin and is involved in ribosomal RNA maturation. FEBS Lett. 584:156–162 [DOI] [PMC free article] [PubMed] [Google Scholar]
- 15. Ekanayake D. K., Cipriano M. J., Sabatini R. 2007. Telomeric co-localization of the modified base J and contingency genes in the protozoan parasite Trypanosoma cruzi. Nucleic Acids Res. 35:6367–6377 [DOI] [PMC free article] [PubMed] [Google Scholar]
- 16. Elias M. C., Marques-Porto R., Freymuller E., Schenkman S. 2001. Transcription rate modulation through the Trypanosoma cruzi life cycle occurs in parallel with changes in nuclear organisation. Mol. Biochem. Parasitol. 112:79–90 [DOI] [PubMed] [Google Scholar]
- 17. Frasch A. C. 2000. Functional diversity in the trans-sialidase and mucin families in Trypanosoma cruzi. Parasitol. Today 16:282–286 [DOI] [PubMed] [Google Scholar]
- 18. Fuks F. 2005. DNA methylation and histone modifications: teaming up to silence genes. Curr. Opin. Genet. Dev. 15:490–495 [DOI] [PubMed] [Google Scholar]
- 19. Hashimshony T., Zhang J., Keshet I., Bustin M., Cedar H. 2003. The role of DNA methylation in setting up chromatin structure during development. Nat. Genet. 34:187–192 [DOI] [PubMed] [Google Scholar]
- 20. Heusipp G., Falker S., Schmidt M. A. 2007. DNA adenine methylation and bacterial pathogenesis. Int. J. Med. Microbiol. 297:1–7 [DOI] [PubMed] [Google Scholar]
- 21. Kelly J. M., Taylor M. C., Rudenko G., Blundell P. A. 1995. Transfection of the African and American trypanosomes. Methods Mol. Biol. 47:349–359 [DOI] [PubMed] [Google Scholar]
- 22. Kelly J. M., Ward H. M., Miles M. A., Kendall G. 1992. A shuttle vector which facilitates the expression of transfected genes in Trypanosoma cruzi and Leishmania. Nucleic Acids Res. 20:3963–3969 [DOI] [PMC free article] [PubMed] [Google Scholar]
- 23. Kieft R., et al. 2007. JBP2, a SWI2/SNF2-like protein, regulates de novo telomeric DNA glycosylation in bloodstream form Trypanosoma brucei. Mol. Biochem. Parasitol. 156:24–31 [DOI] [PMC free article] [PubMed] [Google Scholar]
- 24. Marinus M. G., Casadesus J. 2009. Roles of DNA adenine methylation in host-pathogen interactions: mismatch repair, transcriptional regulation, and more. FEMS Microbiol. Rev. 33:488–503 [DOI] [PMC free article] [PubMed] [Google Scholar]
- 25. Minning T. A., Weatherly D. B., Atwood J., III, Orlando R., Tarleton R. L. 2009. The steady-state transcriptome of the four major life-cycle stages of Trypanosoma cruzi. BMC Genomics 10:370. [DOI] [PMC free article] [PubMed] [Google Scholar]
- 26. Nilsson D., et al. 2010. Spliced leader trapping reveals widespread alternative splicing patterns in the highly dynamic transcriptome of Trypanosoma brucei. PLoS Pathog. 6:e1001037. [DOI] [PMC free article] [PubMed] [Google Scholar]
- 27. Ouellette M., Papadopoulou B. 2009. Coordinated gene expression by post-transcriptional regulons in African trypanosomes. J. Biol. 8:100. [DOI] [PMC free article] [PubMed] [Google Scholar]
- 28. Prescott E. M., Proudfoot N. J. 2002. Transcriptional collision between convergent genes in budding yeast. Proc. Natl. Acad. Sci. U. S. A. 99:8796–8801 [DOI] [PMC free article] [PubMed] [Google Scholar]
- 29. Queiroz R., Benz C., Fellenberg K., Hoheisel J. D., Clayton C. 2009. Transcriptome analysis of differentiating trypanosomes reveals the existence of multiple post-transcriptional regulons. BMC Genomics 10:495. [DOI] [PMC free article] [PubMed] [Google Scholar]
- 30. Respuela P., Ferella M., Rada-Iglesias A., Aslund L. 2008. Histone acetylation and methylation at sites initiating divergent polycistronic transcription in Trypanosoma cruzi. J. Biol. Chem. 283:15884–15892 [DOI] [PMC free article] [PubMed] [Google Scholar]
- 31. Sabatini R., Cliffe L., Vainio S., Borst P. 2009. Enzymatic formation of the hypermodified DNA base J (β-d-glucopyranosyloxymethyluracil), p. 120–131In Grosjean H.(ed.), DNA and RNA modification enzymes: structure, mechanism, function and evolution. Landes Biosciences, Austin, TX [Google Scholar]
- 32. Siegel T. N., et al. 2009. Four histone variants mark the boundaries of polycistronic transcription units in Trypanosoma brucei. Genes Dev. 23:1063–1076 [DOI] [PMC free article] [PubMed] [Google Scholar]
- 33. Vainio S., Genest P. A., ter Riet B., van Luenen H., Borst P. 2009. Evidence that J-binding protein 2 is a thymidine hydroxylase catalyzing the first step in the biosynthesis of DNA base J. Mol. Biochem. Parasitol. 164:157–161 [DOI] [PubMed] [Google Scholar]
- 34. Reference deleted.
- 35. van Leeuwen F., Kieft R., Cross M., Borst P. 1998. Biosynthesis and function of the modified DNA base beta-d-glucosyl-hydroxymethyluracil in Trypanosoma brucei. Mol. Cell. Biol. 18:5643–5651 [DOI] [PMC free article] [PubMed] [Google Scholar]
- 36. Yu Z., et al. 2007. The protein that binds to DNA base J in trypanosomatids has features of a thymidine hydroxylase. Nucleic Acids Res. 35:2107–2115 [DOI] [PMC free article] [PubMed] [Google Scholar]
Associated Data
This section collects any data citations, data availability statements, or supplementary materials included in this article.