Abstract
In response to needs for in situ thermometry, a temperature-sensitive vector was adapted to report changes in the intracellular heat content of Escherichia coli in near-real time. This model system utilized vectors expressing increasing quantities of β-galactosidase in response to stepwise temperature increases through a biologically relevant range (22 to 45°C). As judged by calibrated fluorometric and colorimetric reporters, both whole E. coli cells and lysates expressed significant repeatable changes in β-galactosidase activity that were sensitive to temperature changes of less than 1°C (35 to 45°C). This model system suggests that changes in cellular heat content can be detected independently of the medium in which cells are maintained, a feature of particular importance where the medium is heterogeneous or nonaqueous, or otherwise has a low heat transfer capacity. We report here that the intracellular temperature can be reliably obtained in near-real time using reliable fluorescent reporting systems from cellular scales, with a 20°C range of detection and at least 0.7°C sensitivity between 35 and 45°C.
INTRODUCTION
Temperature is a master environmental variable, whose accurate measurement is critical for understanding biological processes from the molecular to the biome level (13, 15). At a molecular level, temperature in biological systems is typically measured by observing the surrounding growth medium, and while the rapid thermal relaxation of the cellular milieu and aqueous medium makes this approximation valid under many circumstances, there are notable exceptions. Rapid cellular and subcellular heat content changes have been theorized to result from alternating electromagnetic fields (EMF) (7), and the continued development of hyperthermia-based therapies combining nanomaterials and EMF (11) requires the development of in situ and in vivo temperature measurement for subcellular and tissue levels.
Cellular heat content affects biomolecular assembly, structure, and function. It has long been recognized that cellular systems sense temperature through various means, including transcription factor binding and mRNA secondary structure (3, 5, 13, 15, 16, 21). In vivo, these systems maintain homeostasis by responding to environmental temperature changes (5, 6, 16, 20–22). Subtle changes in biomolecular structure alter the temperature response, as evidenced by temperature-sensitive mutations (2). While these systems have been engineered or are otherwise exploited for functional studies and expression control, none of these heat-sensing systems have been developed for intracellular thermometry (15). We report here the first demonstration of a biomolecular intracellular thermometer. This system utilizes temperature-sensitive mutants of lacI controlling LacZ expression (3, 4), which accurately reports cellular temperature in an environmentally relevant range.
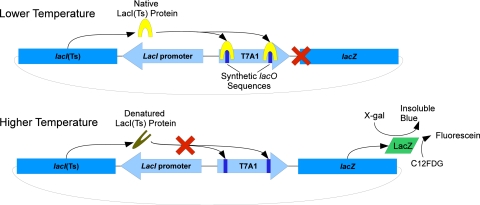
Constitutive expression of LacI(Ts) by a T7 promoter (derived from pET24; Novagen/EMD, Darmstadt, Germany) results in the availability of LacI(Ts) to bind lacO sites. At permissive temperatures, where LacI(Ts) is bound to the two lacO sites engineered into a T7A1 promoter, transcription of lacZ is blocked (Fig. 1). As the intracellular heat content is increased, structural changes cause LacI(Ts) to leave the lacO sites, leading to LacZ expression (Fig. 1). LacZ (β-galactosidase) then cleaves the lactose analog 5-bromo-4-chloro-3-indolyl-β-d-galactopyranoside (X-gal; Mallinckrodt Chemicals, Phillipsburg, NJ) into subunits that then react with one another to form an insoluble blue precipitate (5,5′-dibromo-4,4′-dichloro-indigo), a colorimetric indicator of LacZ activity. In addition to the conventional colorimetric assays, 5-dodecanoylaminofluorescein di-β-d-galactopyranoside (C12FDG; Invitrogen, Eugene, OR) can be utilized as a fluorogenic substrate for LacZ. C12FDG has 2 galactoside residues that are sequentially cleaved, yielding a fluorescein moiety that is retained in the cell membrane by its hydrophobic tail (23). These LacZ reporters were successfully employed to assay the intracellular temperature response.
Fig. 1.
Diagram of a LacI(Ts)-controlled thermometric system. At lower temperatures, the constitutively expressed LacI(Ts) can bind to the synthetic lacO sites engineered into the T7A1 promoter, preventing expression of LacZ. As temperatures increase, 2° and 3° structural changes in the LacI(Ts) molecules result in decreased binding at the lacO sites, leading to increasing expression of LacZ. LacZ expression can be detected using colorimetric (X-gal) or fluorometric (C12FDG) substrates.
The biomolecular nature of this temperature-sensing system reflects a fundamental manner in which other cellular components are likely to respond to intracellular heat content changes. When related to a relevant scale, in this case degrees Celsius, this heat-sensitive expression system becomes a viable thermometer. We demonstrate a colorimetric biomolecular thermometer with a physiologically relevant functional range between 25 and 45°C and with a sensitivity better than 0.7°C (35 to 45°C). LacZ cleavage of X-gal can be detected in less than 30 s after exposure to 40°C. Further, the fluorogenic reporter and LacZ substrate C12FDG can be used to identify individual cells that have been heated by fluorescence microscopy and can be readily applied to fluorescence-activated cell sorting (FACS) (12) and possibly even whole-body imaging (14).
MATERIALS AND METHODS
Cultivation. (i) Strains and culture.
Escherichia coli DH5α strains harboring the LacI(Ts) vector pA199A2-Its187 (Its187), pA199A2-Its233 (Its233), pA199A2-Its241 (Its241), or pA199A2-Its265 (Its265), carrying a Gly187Ser, Leu233Lys, Ala241Thr, or Gly265Asp point mutation in the lacI gene, respectively (3, 4), were isolated as individual colonies onto Luria-Bertani (Miller formulation) agar (LB agar; EMD Chemicals, Gibbstown, NJ) with 100 μg/ml carbenicillin (MBI Growcells, Irvine, CA). These plates were cultured at room temperature (RT; 22°C ± 1°C) for 48 h. A liquid culture of each strain was inoculated from a single colony. Five milliliters of each culture was incubated at RT with shaking at 135 rpm in LB medium with 100 μg/ml carbenicillin for 48 h. One milliliter of this initial liquid culture was then transferred to 200 ml LB medium with 100 μg/ml carbenicillin and was grown for 48 h with shaking at RT.
(ii) Chemostat.
For each of the four E. coli strains, a 2-liter chemostat, with a working volume of 150 ml of LB medium with 100 μg/ml carbenicillin and D of 1.3 h−1 (flow rate, 200 ml/h), and with shaking at 135 rpm at RT, was inoculated with 50 ml of the culture described above and was allowed to equilibrate for at least 16 h.
Assays.
Cultures were washed twice with phosphate-buffered saline (PBS). They were then normalized by spectrophotometry to an optical density at 600 nm (OD600) of 0.05 for the initial characterization and by direct microscopic count (10, 18) to 5.5 × 10⁹ cells/ml for all subsequent experiments utilizing the colorimetric assay. Five microliters of 8 mg/ml X-gal in dimethyl sulfoxide (DMSO; Fisher Scientific, Fair Lawn, NJ), freshly prepared, was added to 50-μl aliquots of cells, which were immediately placed in a MiniOpticon PCR machine (Bio-Rad, Hercules, CA) for heating at controlled temperatures. For the initial examination of thermal sensitivity, the block was held at discrete temperatures (±0.2°C) sequentially increased in 5°C steps in the range from 25 to 45°C, in addition to an RT control (Fig. 2). Once the mutant with the largest response was determined (Its265), the gradient function, with upper and lower limits of 45 and 35°C, respectively, was utilized (Fig. 3). Cell suspensions with X-gal were heated for 20 min, and then the cells were lysed and the reactions were stopped by the addition of 50 μl 1 M sodium carbonate (Sigma-Aldrich, St. Louis, MO). To observe the characteristic kinetic window, a cell suspension of Its265 with X-gal (as described above) was heated in a 40°C water bath (Precision Scientific Inc., Chicago, IL) for 30 s to 20 min and was then transferred to the PCR machine block at 35°C for an additional 20 min before the reaction was stopped. To confirm that the colorimetric responses observed were significantly greater than what could be associated with increases in LacZ/X-gal kinetics due to the Arrhenius effect, a subset of reaction mixtures were heated prior to the addition of a cell-disrupting agent, toluene, to fix the LacZ levels, after which X-gal was added and all reaction mixtures were held at the same temperature.
Fig. 2.
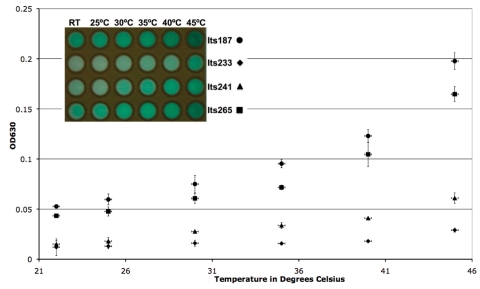
Temperature testing of all four LacI(Ts) vectors from 22 to 45°C with X-gal as the LacZ indicator substrate. Each point represents the average (n = 3) spectrophotometric measurement of the insoluble blue precipitate (OD630) at each temperature. Error bars along the x axis represent the temperature variability in the MiniOpticon (0.2°C). Error bars along the y axis represent 1 standard deviation. (Inset) Representative photograph of the LacZ expression responses of the four lacI mutants, showing the increased catalysis of X-gal with increasing temperature.
Fig. 3.
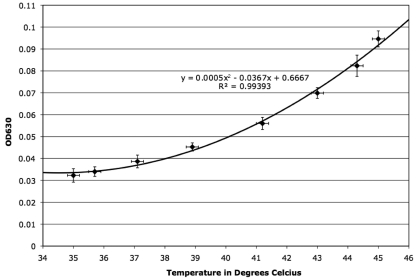
Sensitivity testing of Its265 using X-gal as the indicator substrate. Each point represents the average OD630 (n = 15). Significant differences in the OD630 between 44.3 and 45°C indicate an assay sensitivity of >0.7°C in this range. The equation represents a polynomial regression on a minimum of eight discrete temperatures (overlaid), with a correlation coefficient of 0.9939. Error bars along the x axis represent the temperature variability in the MiniOpticon (0.2°C). Error bars along the y axis represent 1 standard deviation.
All reaction mixtures were then incubated at 4°C for at least 12 h before colorimetric analysis to allow completion of the reaction of cleaved X-gal with the insoluble blue precipitate. This insoluble blue precipitate was quantitated spectrophotometrically with 2 μl of the well-mixed reaction mixture by measuring the OD630 on an ND-1000 spectrophotometer (NanoDrop, Wilmington, DE). Two microliters of a mixture of 50 μl PBS, 5 μl DMSO, and 50 μl sodium carbonate was used as the blank for spectrophotometry.
For the fluorometric assay, cells from the chemostat were diluted 10-fold into LB medium containing a final concentration of 20 μM C12FDG and were incubated for 1 h at RT with shaking at 135 rpm (procedure modified from flow cytometry as described in references 12, 17, and 23). An aliquot of cells was heated in a 40°C water bath for 20 min, while an aliquot of control cells was held at RT for 20 min. Cells were then filter immobilized on 0.4-μm-pore-size, 25-mm-diameter black polycarbonate membranes (GE Water & Process Technologies, Trevose, PA), counterstained, and mounted with 0.2 mg/ml 4′,6-diamidino-2-phenylindole, dilactate (DAPI; Invitrogen, Carlsbad, CA), in 95% glycerol. E. coli strains were then photographed/observed using a Nikon Eclipse E400 series epifluorescence microscope (Nikon Corp., Tokyo, Japan). Images were captured by a Spot Insight QE tricolor charge-coupled device (CCD) camera (Diagnostic Instruments Inc., Sterling Heights, MI) connected to a personal computer (Dell, Nashville, TN). Image analysis was performed using ImageJ (NIH, Bethesda, MD).
Statistical analysis.
Statistical analyses were performed using Microsoft Excel 2004 for Macintosh (version 11.5.5; Microsoft Corp., Redmond, WA). Averages presented represent the arithmetic mean. Standard deviations presented were calculated using the n − 1 degrees of freedom.
RESULTS
Comparison of the four LacI(Ts) strains.
Mutagenesis screens for the LacI(Ts) strains described above and other LacI(Ts) mutants are typically conducted with a 30°C to 40 or 42°C shift on X-gal-containing plates; colonies that are white at 30°C and blue at 40 or 42°C are temperature-sensitive mutants, and white/white or blue/blue colonies are wild type or have loss-of-function lacI mutations, respectively (1). In order to characterize these temperature-sensitive vectors in the context of a thermometric assay, a broad yet physiologically relevant temperature range between 22°C and 45°C was tested. For E. coli, this represents the range from the lowest practical culture temperature (RT) to the temperature at which the heat reservoir begins to affect viability (45°C) (19). All four strains carrying the LacI(Ts) vectors Its187, Its233, Its241, and Its265 were cultured, washed, mixed with X-gal and DMSO, and heated for 20 min at 5°C intervals in independent triplicates.
In all cases, the cultures responded to increasing temperature with increased expression of LacZ, as colorimetrically indicated by the insoluble blue product (Fig. 2, inset). As expected, each of the strains responded in a unique manner to the temperature increase; Its187 and Its265 were far more sensitive in this temperature range than Its233 and Its241 (Fig. 2). Its265 was thus utilized for all future experiments, because of its sensitivity and lower baseline expression of LacZ.
Its265 sensitivity.
A narrowed temperature range of 35 to 45°C was examined in order to determine reporting sensitivity using E. coli carrying pA199A2-Its265. The test was carried out utilizing the PCR gradient function of the MiniOpticon, with the temperatures in each row of the block corresponding to 35, 35.7, 37.1, 38.9, 41.2, 43, 44.3, and 45°C according to the accompanying gradient calculator software (Bio-Rad, Hercules, CA). The test was carried out three times with five independent replicates (n = 15) (Fig. 3). All responses were normally distributed, and significant differences (P ≤ 0.05) between colorimetric distributions at each temperature, observed using a two-tailed paired Student t test, indicate an assay sensitivity better than 0.7°C. In accordance with the observations of Chao et al. (3), the increases in LacZ production and activity, and in associated X-gal metabolism, were significantly greater than what could be attributed to increased kinetics in accordance with the Arrhenius effect. This was confirmed experimentally by heating and then disrupting the cells with toluene prior to the addition of X-gal, after which all reaction mixtures were held at the same temperature. The cell lysates demonstrated a significant increase in OD630 with heating (data not shown).
Time course of LacZ induction.
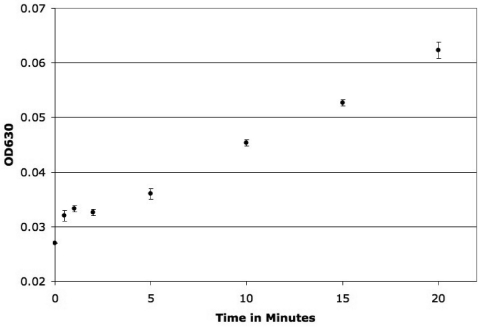
A time course experiment was carried out to determine how quickly a significant increase in LacZ expression could be detected. To measure LacZ expression, E. coli Its265 was incubated at 40°C in 4% DMSO with X-gal for 0 and 30 s and 1, 2, 5, 10, 15, and 20 min (repeated in at least triplicate). A subsequent incubation for 20 min at 35°C permitted any LacZ expressed during the 40°C exposure to catalyze the cleavage of X-gal and resultant formation of the insoluble blue precipitate. Spectrophotometric detection at 630 nm indicated a significant difference after 30 s (P = 0.013). Little difference was seen between 30 s and 2 min, followed by a steady increase in LacZ expression over the next 18 min (Fig. 4).
Fig. 4.
Spectrophotometry of the insoluble blue precipitate from a time course of a cell suspension exposed to 40°C, followed by an additional incubation for 20 min at 35°C. Points indicate the average OD630 (n = 3); error bars represent 1 standard deviation. Rapid induction of LacZ at 40°C, followed by a plateau at the earliest time points, is observed. Beyond 5 min, a linear increase in LacZ induction can be seen.
Fluorometric reporting.
Several indicator substrates are available for LacZ, including a wide variety of colorigenic and fluorogenic substrates. These are available with various chemical modifications that necessitate different methods of cellular introduction (loading). The particular fluorogenic substrate utilized in these studies, C12FDG, is a fluorescein molecule with 2 galactose molecules attached by β-galactoside linkages that can be cleaved by LacZ, leading to a fluorescent product, and a 12-carbon lipid tail that partitions into the cell membrane and serves to hold the cleaved product (23).
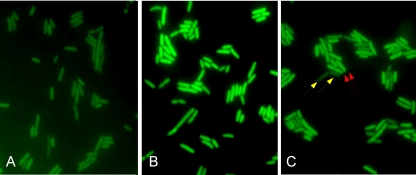
Following a 1-h incubation with C12FDG at RT to load the cells with the substrate, the cells were aliquoted into a heated (40°C for 20 min) fraction and an RT fraction. Cells were then filter immobilized for fluorescence microscopy and were mounted in 95% glycerol containing 0.2 mg/ml DAPI. Photomicrographs were taken using the same exposure settings for heated (Fig. 5B) and nonheated (Fig. 5A) samples. A mixed sample, containing a mixture of equal parts of the RT control (minimal fluorescence, yellow arrows) and heated cells (increased fluorescence, red arrows) was captured using different exposure settings in order to successfully juxtapose a broad range of intensities (Fig. 5C). Contrast adjustments were made using ImageJ (solely to reduce background), and all optical software adjustments were identical for all images captured. Differences in the fluorescence intensity are readily visible in response to the temperature exposure history, both in the separate micrographs and when RT and heated cells are mixed together in equal parts (Fig. 5), demonstrating the viability of this thermometric method where a fluorescence-based methodology would be beneficial.
Fig. 5.
Fluorescence microscopy of E. coli loaded for 1 h with 20 μM C12FDG in LB medium. (A) Cell suspension maintained at room temperature for 20 min. (B) Cell suspension heated to 40°C for 20 min. (C) A 1:1 mix of heated cells (as in panel B; examples indicated by red arrows) and room temperature cells (as in panel A; examples indicated by yellow arrows).
DISCUSSION
Prior to this study, the general approach to gauging intracellular heat content relied on measuring the temperature of the surrounding medium, assuming that the rapid thermal relaxation of a cell-medium system was such that the temperature cells experience would be uniform. As contextual challenges to this practice evolve (7) and therapies relying on accurate application of local heating have developed (11), the need for molecular-level thermometry in biological systems is an emerging and important frontier (15).
Recently, molecular-level thermometry has been demonstrated using fluorescent nanohydrogels (8, 9). While nanogels are effective for observing temperature changes at an intracellular level, their effective range and sensitivity are limited, and mid- to long-term biocompatibility studies have yet to be conducted (8, 9). We report here an alternative approach to intracellular thermometry, with a 20°C range of detection and at least 0.7°C sensitivity between 35 and 45°C. Furthermore, this method relies on temperature-sensitive mutants of native proteins, eliminating concerns about biocompatibility with the sensing mechanism. With a vast array of LacZ substrates—some of which have been utilized for decades—biocompatibility for reporting can be tailored to a variety of applications.
Adaptation of these vectors to other cellular systems is envisioned, since expression systems using the Lac operon have been developed for virtually every model system from bacteria to humans (17). Further, alternate genes can be engineered in place of the lacZ gene to provide different indicators; enhanced green fluorescent protein (EGFP) could be inserted, yielding a fluorescent reporter with low toxicity and no required indicator substrates. Development and characterization of this construct are under way.
One drawback of a biomolecular thermometer, and especially multistep expression-based systems, is the variability in the growth rate, cell stage, and metabolic state, which may affect the quantitative outcome of this type of assay; thus, standards under experimental conditions must accompany each experiment so as to provide a calibrated result. Again, it should be noted that this “drawback” results from the fact that the biomolecular thermometry better senses the effects of heating on the cellular milieu. The responses of cells to temperature changes will likely differ according to these culture conditions, permitting this method to better reflect the overall cellular response to heating. To a large extent, calibration variability can be mitigated with carefully controlled cultivation conditions, employing modern chemostats.
Conclusions.
Temperature is a master environmental variable that affects all biological activity. Conventional temperature monitoring relies on averaged material responses to heat that we detect visually or with the aid of simple electronics. Because thermal conduction is relatively rapid in most aqueous systems, we typically observe the temperature of the medium (or other environment) that hosts the cells of concern—and accept this as a relatively accurate surrogate for the temperature within the cells themselves. There are, however, a multitude of situations where temperature measurements of the immediate environment are impractical. Further, intercellular temperature may differ from the near-field surroundings on significant scales, particularly where large density differences exist between microorganisms and their environmental interface. Solid (polymeric) surfaces, filter media, and membranes constitute germane examples of common bioengineering applications where the presence of microbes in or on an environmental feature does not necessarily result in shared heat content in important time frames.
With respect to in situ biochemical conditions, procedures enabling cells to report nondestructively on certain aspects of their immediate status have been employed for decades. Indeed, vectors have been leveraged to report on a wide variety of intra- and intercellular metabolic and signaling activities; only relatively recently, however, have they been recruited for physical factors, including, but not limited to, microscale temperature assessment. If intracellular genetics-based reporters with adequate reporting sensitivity are engineered with optically active elements that do not require chemical primers, a cellular-scale level of physical temperature measurement may soon be available in real time.
ACKNOWLEDGMENTS
This work was supported by NIH grant RO1 EB 009115-01 A1, the State of Colorado, and the Leadership Alliance.
Footnotes
Published ahead of print on 4 March 2011.
REFERENCES
- 1. Bukrinsky M. I., Barsov E. V., Shilov A. A. 1988. Multicopy expression vector based on temperature-regulated lac repressor: expression of human immunodeficiency virus env gene in Escherichia coli. Gene 70:415–417 [DOI] [PubMed] [Google Scholar]
- 2. Chakshusmathi G., et al. 2004. Design of temperature-sensitive mutants solely from amino acid sequence. Proc. Natl. Acad. Sci. U. S. A. 101:7925–7930 [DOI] [PMC free article] [PubMed] [Google Scholar]
- 3. Chao Y. P., Chern J. T., Wen C. S., Fu H. 2002. Construction and characterization of thermo-inducible vectors derived from heat-sensitive lacI genes in combination with the T7 A1 promoter. Biotechnol. Bioeng. 79:1–8 [DOI] [PubMed] [Google Scholar]
- 4. Chao Y. P., Chiang C. J., Wang Y. L., Wang Z. W. 2003. Applicability of new expression vectors for both engineering uses and biological studies. Biotechnol. Prog. 19:1076–1080 [DOI] [PubMed] [Google Scholar]
- 5. Chowdhury S., Maris C., Allain F. H., Narberhaus F. 2006. Molecular basis for temperature sensing by an RNA thermometer. EMBO J. 25:2487–2497 [DOI] [PMC free article] [PubMed] [Google Scholar]
- 6. Chowdhury S., Ragaz C., Kreuger E., Narberhaus F. 2003. Temperature-controlled structural alterations of an RNA thermometer. J. Biol. Chem. 278:47915–47921 [DOI] [PubMed] [Google Scholar]
- 7. De Vita A., Croce R., Pierro V., Pinto I. 2009. Anomalous heating in a living cell with dispersive membrane capacitance under pulsed electromagnetic fields, abstr. P-205. In Abstract collection of the Joint Meeting of the Bioelectromagnetics Society and the European BioElectromagnetics Association, Davos, Switzerland, 14 to 19 June 2009 Bioelectromagnetics Society, Madrid, Spain: http://bioem2009.org/final-program-pdf/ [Google Scholar]
- 8. Gota C., Okabe K., Funatsu T., Harada Y., Uchiyama S. 2009. Hydrophilic fluorescent nanogel thermometer for intracellular thermometry. J. Am. Chem. Soc. 131:2766–2767 [DOI] [PubMed] [Google Scholar]
- 9. Hardison D., Deepthike H. U., Senevirathna W., Pathirathne T., Wells M. 2008. Temperature-sensitive microcapsules with variable optical signatures based on incorporation of quantum dots into a highly biocompatible hydrogel. J. Mater. Chem. 18:5368–5375 [Google Scholar]
- 10. Hobbie J. E., Daley R. J., Jasper S. 1977. Use of Nuclepore filters for counting bacteria by fluorescence microscopy. Appl. Environ. Microbiol. 33:1225–1228 [DOI] [PMC free article] [PubMed] [Google Scholar]
- 11. Ito A. 2009. Hyperthermia using functional magnetite nanoparticles, abstr. Plenary III. In Abstract collection of the Joint Meeting of the Bioelectromagnetics Society and the European BioElectromagnetics Association, Davos, Switzerland, 14 to 19 June 2009 Bioelectromagnetics Society, Madrid, Spain: http://bioem2009.org/final-program-pdf/ [Google Scholar]
- 12. Jasin M., Zalamea P. 1992. Analysis of Escherichia coli beta-galactosidase expression in transgenic mice by flow cytometry of sperm. Proc. Natl. Acad. Sci. U. S. A. 89:10681–10685 [DOI] [PMC free article] [PubMed] [Google Scholar]
- 13. Klinkert B., Narberhaus F. 2009. Microbial thermosensors. Cell. Mol. Life Sci. 66:2661–2676 [DOI] [PMC free article] [PubMed] [Google Scholar]
- 14. Li L., Zhang H. F., Zemp R. J., Maslov K., Wang L. 2008. Simultaneous imaging of a lacZ-marked tumor and microvasculature morphology in vivo by dual-wavelength photoacoustic microscopy. J. Innov. Opt. Health Sci. 1:207–215 [DOI] [PMC free article] [PubMed] [Google Scholar]
- 15. McCabe K. M., Hernandez M. 2010. Molecular thermometry. Pediatr. Res. 67:469–475 [DOI] [PMC free article] [PubMed] [Google Scholar]
- 16. Narberhaus F., Waldminghaus T., Chowdhury S. 2006. RNA thermometers. FEMS Microbiol. Rev. 30:3–16 [DOI] [PubMed] [Google Scholar]
- 17. Plovins A., Alvarez A. M., Ibanez M., Molina M., Nombela C. 1994. Use of fluorescein-di-β-d-galactopyranoside (FDG) and C12-FDG as substrates for β-galactosidase detection by flow cytometry in animal, bacterial, and yeast cells. Appl. Environ. Microbiol. 60:4638–4641 [DOI] [PMC free article] [PubMed] [Google Scholar]
- 18. Rodriguez G. C., Phipps D., Ishiguro K., Ridgway H. F. 1992. Use of a fluorescent redox probe for direct visualization of actively respiring bacteria. Appl. Environ. Microbiol. 58:1801–1808 [DOI] [PMC free article] [PubMed] [Google Scholar]
- 19. Ross A. I., Griffiths M. W., Mittal G. S., Deeth H. C. 2003. Combining nonthermal technologies to control foodborne microorganisms. Int. J. Food Microbiol. 89:125–138 [DOI] [PubMed] [Google Scholar]
- 20. Waldminghaus T., Fippinger A., Alfsmann J., Narberhaus F. 2005. RNA thermometers are common in alpha- and gamma-proteobacteria. Biol. Chem. 386:1279–1286 [DOI] [PubMed] [Google Scholar]
- 21. Waldminghaus T., Gaubig L. C., Klinkert B., Narberhaus F. 2009. The Escherichia coli ibpA thermometer is comprised of stable and unstable structural elements. RNA Biol. 6:455–463 [DOI] [PubMed] [Google Scholar]
- 22. Waldminghaus T., Gaubig L. C., Narberhaus F. 2007. Genome-wide bioinformatic prediction and experimental evaluation of potential RNA thermometers. Mol. Genet. Genomics 278:555–564 [DOI] [PubMed] [Google Scholar]
- 23. Zhang Y. Z., Naleway J. J., Larison K. D., Huang Z. J., Haugland R. P. 1991. Detecting lacZ gene expression in living cells with new lipophilic, fluorogenic beta-galactosidase substrates. FASEB J. 5:3108–3113 [DOI] [PubMed] [Google Scholar]


