Abstract
Alcelaphine herpesvirus 1 (AlHV-1), carried by wildebeest asymptomatically, causes malignant catarrhal fever (WD-MCF) when cross-species transmitted to a variety of susceptible species of the Artiodactyla order. Experimentally, WD-MCF can be reproduced in rabbits. WD-MCF is described as a combination of lymphoproliferation and degenerative lesions in virtually all organs and is caused by unknown mechanisms. Recently, we demonstrated that WD-MCF is associated with the proliferation of CD8+ cells supporting a latent type of infection in lymphoid tissues. Here, we investigated the macroscopic distribution of AlHV-1 infection using ex vivo bioluminescence imaging in rabbit to determine whether it correlates with the distribution of lesions in lymphoid and nonlymphoid organs. To reach that goal, a recombinant AlHV-1 strain was produced by insertion of a luciferase expression cassette (luc) in an intergenic region. In vitro, the reconstituted AlHV-1 luc+ strain replicated comparably to the parental strain, and luciferase activity was detected by bioluminescence imaging. In vivo, rabbits infected with the AlHV-1 luc+ strain developed WD-MCF comparably to rabbits infected with the parental wild-type strain, with hyperthermia and increases of both CD8+ T cell frequencies and viral genomic charge over time in peripheral blood mononuclear cells and in lymph nodes at time of euthanasia. Bioluminescent imaging revealed that AlHV-1 infection could be detected ex vivo in lymphoid organs but also in lung, liver, and kidney during WD-MCF, demonstrating that AlHV-1 infection is prevalent in tissue lesions. Finally, we show that the infiltrating mononuclear leukocytes in nonlymphoid organs are mainly CD8+ T cells and that latency is predominant during WD-MCF.
INTRODUCTION
Malignant catarrhal fever (MCF) is a fatal lymphoproliferative disease of a variety of species of the Artiodactyla order, which includes cattle. The main causative agents of MCF are two closely related gammaherpesviruses of the Rhadinovirus genus, Ovine herpesvirus 2 (OvHV-2) and Alcelaphine herpesvirus 1 (AlHV-1). These viruses cause no apparent disease in their natural host species. Sheep are naturally infected by OvHV-2, which is responsible for the sheep-associated form of MCF (SA-MCF) when cross-species transmitted to susceptible hosts, such as cattle. Wildebeest (Connochaetes taurinus) carry AlHV-1, responsible for the wildebeest-derived form of MCF (WD-MCF) (33, 34). In sub-Saharan Africa, cross-species transmission of AlHV-1 to susceptible host species occurs throughout wildebeest grazing areas and largely affects cattle. In addition, WD-MCF has also been reported throughout the world in zoological collections where mixed artiodactyl species, including wildebeest, are kept (7). Experimentally, WD-MCF can be induced in rabbits (6). The lesions observed are very similar to those described in the naturally susceptible species. Recent reports have demonstrated that the impact of WD-MCF cases on the pastoralist population has been largely underestimated, with WD-MCF being perceived to be the cattle disease with the most important impact in areas adjacent to wildebeest calving zones and the fourth most important pathology in areas where wildebeest are less common (2, 8).
WD-MCF has been described as a combination of lymphoproliferation and degenerative lesions caused by unknown mechanisms (33, 37, 39). Recently, we demonstrated that WD-MCF in rabbits is associated with a severe proliferation of CD8+ T cells in peripheral blood mononuclear cells (PBMC) and lymphoid organs (12). Moreover, we demonstrated that in PBMC the infection is restricted to CD8+ cells that support predominantly a latent type of infection (12). WD-MCF is very similar to the pathology observed in SA-MCF. A recent study of the viral gene expression profile in cattle developing SA-MCF demonstrated that open reading frame 73 (ORF73) and a nucleotidic sequence unpredicted before as a gene were the only viral RNA molecules detected in lymph nodes (27). The latter study further supports the hypothesis that viral infection is predominantly latent in lymphoid tissues of subjects developing MCF.
The studies described above were restricted to peripheral blood and lymphoid organs. The characteristic lesion in WD-MCF is the systematic perivascular infiltration of mononuclear cells (mainly T cells) in virtually all organs of susceptible species, such as cattle or rabbits (29, 37). Early studies based on immunofluorescence and in situ hybridization detected only few infected cells in the lesions (10−6 and 10−4, respectively). These observations led to the hypothesis that WD-MCF lesions could be due to uninfected cells dysregulated by very few infected cells (1, 4, 31). Recently, this hypothesis was challenged by the observation that ≥10% of CD8+ T cells in PBMC are infected during WD-MCF in rabbits (12).
In the present study, two important questions were addressed. First, we generated a recombinant AlHV-1 strain by insertion of a firefly (Photinus pyralis) luciferase (luc) expression cassette in an intergenic region. Ex vivo bioluminescence imaging was then used to investigate whether the macroscopic distribution of AlHV-1 infection correlates with the distribution of the lesions in lymphoid and nonlymphoid organs. Second, we sought to determine whether the predominant mode of infection in nonlymphoid organs is latency. Our results demonstrated that luciferase activity reported a multifocal distribution of AlHV-1 infection in all explants of lymphoid or nonlymphoid organs. Finally, we show that CD8+ T cells are the prominent lymphoid cell population infiltrating the liver, lung, and kidney and that AlHV-1 infection in these organs is predominantly latent. In light of these data, we discussed the mechanisms by which expansion of latently infected CD8+ cells could play a role in the pathogenesis of WD-MCF.
MATERIALS AND METHODS
Cell lines and virus strain.
Bovine turbinate fibroblasts (BT; ATCC CRL-1390) and embryonic bovine lung (EBL)-nuclear localization signal (NLS)-Cre cells (18) were cultured in Dulbecco's modified essential medium (DMEM; Invitrogen Corporation). Madin-Darby bovine kidney cells (MDBK; ATCC) were cultured in modified essential medium (MEM). All cells were cultured in the presence of 10% fetal calf serum (FCS) (Bio Whittaker). The pathogenic AlHV-1 C500 strain isolated from an ox with MCF (35) and the AlHV-1 C500 bacterial artificial chromosome (BAC) clone (13) were used throughout this study. Virus strains were maintained by limited passage (<5) in BT cells.
Production of a 247Nluc+ recombinant plasmid by galK recombineering technology.
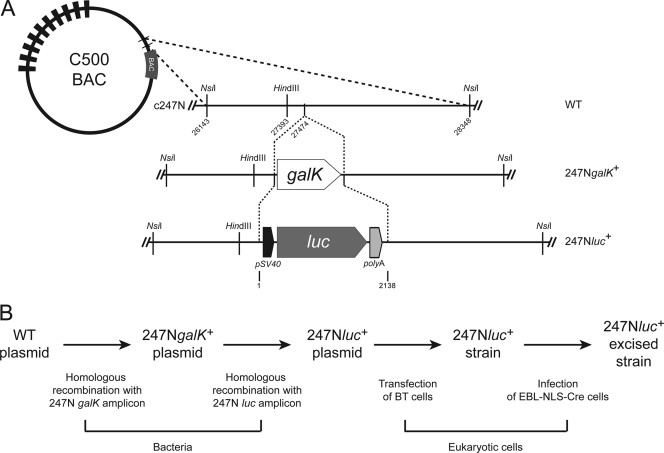
An AlHV-1 C500 BAC recombinant plasmid carrying a firefly luc expression cassette was produced using two-step galactokinase (galK) positive/negative selection in bacteria (Fig. 1) (42). The intergenic region 247N, located between ORF11 and the BAC cassette, was selected as the insertion site (nucleotide [nt] 27474 to 27475 of the AlHV-1 genome) (13, 15). The first recombination process (galK positive selection) was achieved using the 247N galK amplicon, consisting of the galK gene flanked by 50-bp homology sequences and produced by PCR using the pgalK vector and chimeric primers 247N-L-galkF and 247N-R-galkR (Table 1). The recombination process consisted of the insertion of the galK gene into the intergenic region, resulting in the 247NgalK+ plasmid (Fig. 1). The second recombination process (galK negative selection) was achieved using the 247N luc amplicon consisting of a luc expression cassette flanked by 50-bp homology sequences and produced by PCR using the pGL3 vector (Promega) and chimeric primers 247N-L-lucF and 247N-R-lucR (Table 1). The recombination process consisted of replacing the galK gene with a luc expression cassette, resulting in the 247Nluc+ plasmid (Fig. 1). Infectious virus was reconstituted by transfection of BAC plasmid DNA in BT cells. To excise the BAC cassette, reconstituted virus was propagated in EBL-NLS-Cre cells, as described previously (13).
Fig. 1.
Schematic representation of the strategy used to produce the AlHV-1 recombinant strain expressing a LUC reporter protein. (A) Recombineering methodology used to insert a firefly luc expression cassette into the intergenic region of the NsiI restriction fragment 247N (15). (B) Flowchart of stages performed to produce the 247Nluc+ plasmid and excised strain. WT, wild type; galK, galactokinase; luc, luciferase.
Table 1.
Oligonucleotides used for PCRs
| Sequence name | Primer | Primer sequence | Amplicon length (bp) | Reference |
|---|---|---|---|---|
| 247N galK | 247N-L-galKF | 5′-AAGAAGTTGCAAGTCTCTCATCTGATAGCATAGTAAAAATCAGTTCAGTACCTGTTGACAATTAATCATCGGCA-3′ | 1,331 | |
| 247N-R-galKR | 5′-TAAGTACTGATGGCTTGTCTTGTGTCACGATAGTTTAGAAAAAATCTGTATCAGCACTGTCCTGCTCCTT-3′ | 1,331 | ||
| 247N luc | 247N-L-lucF | 5′-AAGAAGTTGCAAGTCTCTCATCTGATAGCATAGTAAAAATCAGTTCAGTACGGTACCGAGATCTGCGATCTGC-3′ | 3,546 | |
| 247N-R-lucR | 5′-TAAGTACTGATGGCTTGTCTTGTGTCACGATAGTTTAGAAAAAATCTGTACGATTTTACCACATTTGTAGAGG-3′ | 3,546 | ||
| ORF3 | ORF3F | 5′-GGGCTAATTTGTGCAGTTTGTGA-3′ | 111 | 40 |
| ORF3R | 5′-AGGTGTTTCTGAAAAGAGGGGAA-3′ | 111 | 40 | |
| Beta-globin | GLOBF | 5′-GGTATCCTTTTTACAGCACAAC-3′ | 178 | 43 |
| GLOBR | 5′-CAGGTCCCCAAAGGACTCG-3′ | 178 | 43 | |
| 247N | pre-247Nluc | 5′-CATTTTAAAATAGCTTGTCGGG-3′ | 568 | |
| post-247Nluc | 5′-GACATGGTCTTCTGTTAAAGTC-3′ | 568 | ||
| ORF73 | ORF73F | 5′-GGACTAGACCCTCTTTATGACCC-3′ | 244 | 12 |
| ORF73R | 5′-GCAATGGGTTCCTATTTTGCTCG-3′ | 244 | 12 | |
| ORF50 | C500-3 | 5′-TCTGGCCCGTGCTGCAGCAAGACTCTCAG-3′ | 274 | 23 |
| C500-4 | 5′-TATAGTAGAATCCCGTCTGAGTGGTAGCTG-3′ | 274 | 23 | |
| ORF25 | ORF25F | 5′-GGCCGATGTGGCCTATTTTC-3′ | 465 | |
| ORF25R | 5′-TCGTCCAAGAGTACACGGTG-3′ | 465 | ||
| luc | luc-int F | 5′-GCCATTCTATCCGCTGGAAG-3′ | 641 | |
| luc-int R | 5′-TAGGATCTCTGGCATGCGAG-3′ | 641 | ||
| HPRT | HPRT-F | 5′-TGATAGATCCATTCCTATGACTGTAGA-3′ | 265 | 19 |
| HPRT-R | 5′-GGGTCCTTTTCACCAGCAG-3′ | 265 | 19 |
Southern blotting.
After digestion and separation on a 0.8% agarose gel, DNA was transferred to Amersham Hybond-XL blotting membranes (GE Healthcare) by capillary transfer as described previously (36). DNA fragments used as probes for hybridization were labeled with α-[32P]dCTP (specific activity, 3,000 Ci/mmol; Perkin Elmer) using the random-primed DNA labeling kit (Roche). Membranes were hybridized at 65°C for 18 h, washed, and used to expose an Amersham Hyperfilm MP (GE Healthcare).
Indirect immunofluorescent staining.
Cells grown on glass coverslips were fixed in phosphate-buffered saline (PBS) containing 4% (wt/vol) paraformaldehyde (Merck) for 10 min on ice followed by 20 min at room temperature. After being washed with PBS, the samples were permeabilized in PBS containing 0.1% NP-40 at 37°C for 10 min. Immunofluorescent labeling (incubation and washes) was performed in PBS containing 10% FCS. The samples were incubated at 37°C for 45 min with primary antibodies. After 3 washes, the samples were incubated at 37°C for 30 min with the secondary conjugates. After being washed, samples were incubated with 0.2 μg/ml Hoechst 33342 (Invitrogen) for 10 min and mounted with ProLong Gold antifade reagent (Invitrogen).
Flow cytometry.
For intracellular stainings, 106 cells were fixed in PBS containing 2% (wt/vol) paraformaldehyde for 20 min on ice. After being washed with PBS, the samples were incubated for 15 min on ice in permeabilization buffer (PBS [pH 7.4], 0.1% saponin, 0.1% bovine serum albumin [BSA], 0.05% NaN3). The samples were further washed and incubated in permeabilization buffer for 30 min on ice with monoclonal antibody (MAb) 15-A raised against AlHV-1 glycoprotein complex gp115 (0.2 μg/ml; mouse IgG2b; VMRD) and anti-LUC (5 μg/ml; goat IgG; Novus Biological) as primary antibodies. The samples were then washed and further incubated in permeabilization buffer for 20 min on ice with biotinylated rat anti-mouse (RtAM) IgG2b (0.5 μg/ml; R12-3; BD) and Alexa Fluor 488-conjugated rabbit anti-goat immunoglobulins (0.5 μg/ml; Invitrogen) as secondary antibodies. The cells were washed and incubated in permeabilization buffer for 10 min on ice with allophycocyanin (APC)-conjugated streptavidin (0.4 μg/ml; BD). For surface stainings on mononuclear leukocytes, washes and incubation steps were performed in FACS buffer (PBS [pH 7.4], 0.1% BSA, 0.05% NaN3). Per staining, 0.5 × 10⁶ cells were incubated with MAb anti-rabbit CD4 (2 μg/ml; mouse IgG2a; KEN-4), CD8 (1 μg/ml; mouse IgG1; 12C.7), and IgM (2 μg/ml; mouse IgG1; NRBM) antibody cocktail and left on ice for 10 min. Cells were washed and further incubated for 10 min on ice with isotype-specific phycoerythrin (PE)-conjugated rat anti-mouse IgG1 (0.2 μg/ml; A85-1; BD) and biotinylated rat anti-mouse IgG2a (0.5 μg/ml; R19-15; BD) antibodies. After an additional wash, cells were incubated with fluorescein isothiocyanate (FITC)-conjugated anti-rabbit T cells (0.2 μg/ml; mouse IgG1; KEN-5), Pacific Blue-conjugated anti-human CD14 (1 μg/ml; mouse IgG2a; TÜK-4), and APC-conjugated streptavidin (0.4 μg/ml; BD). All primary antibodies were from AbD Serotec except as noted otherwise. After a final wash, cells were incubated in 7-aminoactinomycin D (7-AAD; 0.5 μg/ml) before flow cytometry analysis.
Growth curves.
AlHV-1 is highly cell associated, and only very low titers of infectious particles can be harvested from supernatant and cells; an alternate procedure was therefore used to perform multistep growth experiments. Briefly, after transfection of permissive BT cells with BAC plasmids, single enhanced green fluorescent protein-positive (eGFP+) cells were sorted with a fluorescence-activated cell sorter (FACS) in order to inoculate triplicate cultures of BT cells with a ratio of one eGFP+ cell per 50 uninfected BT cells. Infected cultures (cells and supernatant) in triplicate were harvested at successive intervals after infection and stored at −80°C. The amount of infectious virus was then determined by plaque assay on MDBK cells as described previously (18). Syncytia were revealed by indirect immunofluorescent staining using a rabbit anti-AlHV-1 polyserum as the primary antibody.
Induction of MCF in rabbits.
Specific-pathogen-free New Zealand White rabbits were purchased from Harlan Nederland and housed individually throughout this study. Three groups, each comprising three rabbits, were used. Animals of each group were inoculated intravenously with 4 × 10⁶ mock-infected EBL-NLS-Cre cells or with 4 × 10⁶ EBL-NLS-Cre cells infected with the wild type (WT) or the 247Nluc+-excised strain, respectively. Infected cells for inoculation were harvested from cultures in which the cytopathic effect (CPE) reached 90% or more and normalized with real-time PCR (12). Rabbits were examined daily for clinical signs and body temperature. According to bioethical rules, rabbits were euthanized after 48 h of hyperthermia (≥40°C). The animal study was accredited by the local ethics committee of the University of Liège (Belgium).
Single-cell suspension preparation.
PBMC were isolated from 10 ml of blood collected from the ear central artery before and at different time points after infection. Immediately after euthanasia, single-cell suspensions were prepared from popliteal lymph node (pLN), spleen, liver, lung, and kidney as follows. Tissue biopsy specimens were delicately chopped in sterile RPMI medium and passed through a 70-μm-pore-size cell strainer. Mononuclear leukocyte suspensions from peripheral blood and tissue samples were prepared with Ficoll-Paque premium density gradient medium (GE Healthcare). Briefly, 10 ml single-cell suspension was diluted 1:1 in sterile PBS, overlaid onto an 8-ml Ficoll-Paque density cushion, and centrifuged (1,825 × g) for 20 min at room temperature. Mononuclear leukocytes at the interface were collected and washed twice in ice-cold PBS before further analysis.
Titration of infected cells and virions.
Single-cell suspensions were prepared from 200-mg tissue biopsy specimens as described above and split in two before titration. Infected cells were titrated by infectious center assays. Ten-fold dilution series of cell suspensions were seeded on MDBK cell monolayers. After overnight incubation, the cocultures were overlaid with complete medium containing 0.6% (wt/vol) carboxymethylcellulose (CMC) as described previously (18). In some experiments, cells were counted before coculture to determine the number of infectious centers per 106 cells. Virions were titrated by plaque assay. Single-cell suspensions were frozen on dry ice for 30 min and then thawed at 37°C. After removal of cell debris by centrifugation (350 × g, 10 min) the virions contained in the supernatant were titrated by plaque assay as described previously (18). In each assay, syncytia were revealed 4 days later by indirect immunofluorescent staining using a rabbit anti-AlHV-1 polyserum as the primary antibody.
AlHV-1 copy genome quantification.
Total DNA was extracted from PBMC or pLN cells using the QIAamp miniprep kit (Qiagen). AlHV-1 genomic DNA copies were quantified using an AlHV-1 ORF3 real-time PCR with normalization on the cellular beta-globin genomic sequence, as described previously (12). Viral and cellular gene-specific primers are listed in Table 1.
Quantitative reverse transcriptase PCR.
Total RNA was extracted and purified with the RNeasy miniprep kit (Qiagen). Five micrograms of RNA was subsequently digested with DNase I (10 units/μg; Roche) before further purification on RNeasy MinElute cleanup columns (Qiagen) and cDNA synthesis with the Transcriptor first-strand cDNA synthesis kit (Roche). Real-time PCR was performed using iQ SYBR green reaction mix (Bio-Rad), and the reactions were run on an iCycler system (Bio-Rad). Primers used are listed in Table 1. All PCRs were able to detect the equivalent of one genomic copy of AlHV-1 BAC plasmid DNA. Standard curves were generated using AlHV-1 BAC plasmid for viral gene detection or rabbit multigene plasmid for hypoxanthine phosphoribosyltransferase (HPRT) mRNA detection (kindly provided by S. Lukehart).
Bioluminescence imaging.
Imaging of firefly LUC was performed using the Xenogen in vivo imaging system (IVIS) (Xenogen; Caliper Life Sciences) as described previously with some modifications (11). For bioluminescence analysis of cell monolayers, the cell supernatant was replaced with fresh complete medium containing 150 μg/ml of d-luciferin (Xenogen). For ex vivo analysis, anesthetized rabbits (35 mg ketamine/kg of body weight and 5 mg xylazine/kg, intramuscularly [i.m.]) were injected with d-luciferin (150 mg/kg of body weight) (Xenogen). Rabbits were euthanized 15 min later, and organs were rapidly dissected for analysis. Relative intensities of transmitted light from in vivo bioluminescence were represented as a pseudocolor image. Corresponding gray-scale photographs and color luminescence images were superimposed and analyzed using Living Image analysis software version 3.1 (Xenogen).
Histological analysis.
Organ explants from mock-infected or infected rabbits were fixed in 4% buffered paraformaldehyde and embedded in paraffin. Five-micron sections were then stained with hematoxylin and eosin prior to microscopic analysis.
Flow cytometry and cell sorting.
Flow cytometry acquisitions and cell sorting were performed using a three-laser Becton Dickinson fluorescence-activated cell sorter (FACSAria). Data were analyzed with FlowJo software version 7.5.5 (Treestar).
Microscopy analysis.
Epifluorescent microscopy analysis was performed with an Eclipse TE2000S microscope (Nikon) equipped with a DC 300F charge-coupled-device (CCD) camera (Leica) as described previously (41).
Statistical analysis.
Statistical analyses were conducted using GraphPad Prism 5 software.
RESULTS
Generation of an AlHV-1 recombinant strain expressing LUC as a reporter.
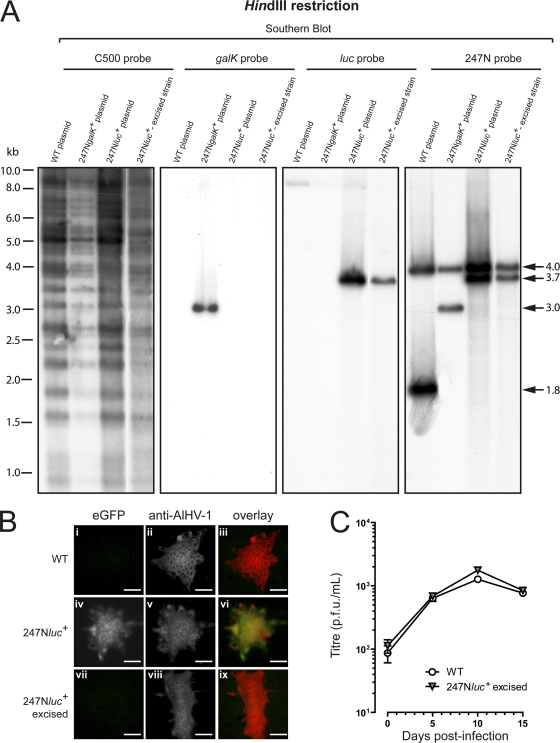
The intergenic region 247N, between ORF11 and the inserted BAC cassette of the AlHV-1 BAC plasmid (13), was selected for insertion of the luc expression cassette. The two-step procedure described in Materials and Methods (galK positive/negative selection) was used to generate the 247Nluc+ plasmid (Fig. 1) (13, 15). The 247Nluc+ recombinant strain was reconstituted from the 247Nluc+ plasmid (Fig. 1) by transfection into BT cells followed by infection and propagation of the obtained viral strain in EBL-NLS-Cre cells (13). Deletion of the BAC cassette was monitored by the disappearance of eGFP fluorescence (247Nluc+-excised strain) (Fig. 2 B). The molecular structures of the recombinant plasmid and strains were confirmed by a combined HindIII restriction endonuclease and Southern blotting approach (Fig. 2A). In the parental WT, the 247N region was contained in two DNA fragments of approximately 4.0 and 1.8 kb. In the C500 BAC 247NgalK+ or C500 BAC 247Nluc+ plasmids and derived reconstituted strains, the 1.8-kb fragment had a size of approximately 3.0 kb due to the insertion of the galK cassette or 3.7 kb due to insertion of the luc expression cassette (Fig. 2A). Sequencing of the regions used to target homologous recombination confirmed that the recombinant plasmids had the correct molecular structures (data not shown).
Fig. 2.
Characterization of the 247Nluc+ plasmid and derived recombinant strain. (A) The WT, 247NgalK+, and 247Nluc+ plasmids and the DNA extracts of cells infected with the 247Nluc+-excised strain were analyzed by HindIII restriction and further tested by Southern blotting using the indicated probes. (B) Epifluorescence analysis of AlHV-1 syncytia. MDBK cells were infected (MOI, 10−4 PFU/cell) with the WT (i to iii), 247Nluc+ (iv to vi), and 247Nluc+-excised (vii to ix) strains. The horizontal rows represent analyses of the same syncytium. Images i, iv, and vii and images ii, v, and viii were analyzed for eGFP and Alexa Fluor 568 fluorescent emissions, respectively. The merged eGFP and Alexa signals are shown in images iii, vi, and ix. Original magnification, ×200; bar, 50 μm. (C) Replication kinetics of the C500 BAC 247Nluc+-excised strain were compared with those of the parental AlHV-1 C500 WT strain as described in Materials and Methods. The data presented are the means ± standard deviations (SD) of results from triplicate measurements. Statistical analyses by two-way analysis of variance (ANOVA) and Bonferroni's posttest.
In vitro characterization of the 247Nluc+-excised recombinant strain.
Microscopic examination of immunostained viral syncytia revealed that insertion of the luc cassette did not affect the formation of syncytia compared to that of the parental WT strain (Fig. 2B). To investigate putative effects of the recombination processes on viral growth in vitro, the 247Nluc+-excised strain was compared to the parental WT strain using a multistep growth assay (Fig. 2C). The two viruses tested exhibited similar growth curves, leading to the conclusion that luc insertion did not affect AlHV-1 replication in vitro. Together, these results demonstrated that the 247Nluc+-excised recombinant strain and the parental strain exhibited similar in vitro characteristics.
In vitro expression of LUC by the AlHV-1 C500 BAC 247Nluc+-excised recombinant strain.
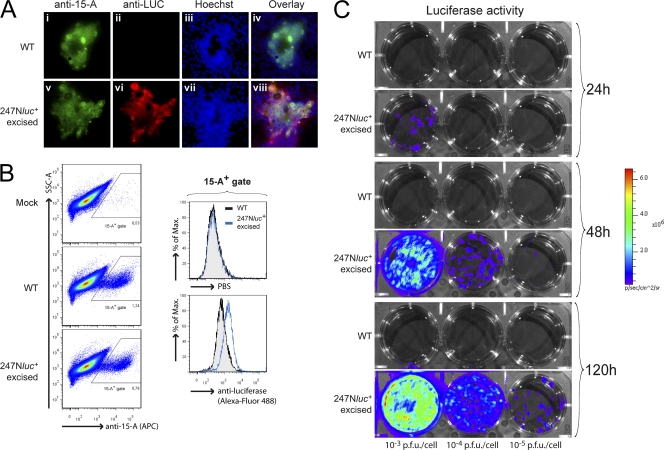
Double staining was conducted on infected cells with MAb 15-A and anti-LUC polyclonal goat IgG and examined by epifluorescence microscopy and flow cytometry. Syncytia expressed the transgene (Fig. 3A), and LUC was expressed in all infected cells (Fig. 3B). To further investigate the expression of LUC activity, MDBK cells were infected at multiplicities of infection (MOIs) ranging from 10−3 to 10−5 PFU/cell with the WT or 247Nluc+-excised strain (Fig. 3C). The cells were analyzed by bioluminescence imaging at 24 h, 48 h, and 120 h postinfection (p.i.). Bioluminescence signals could be detected in infected monolayers as early as 24 h. Together, these results demonstrated that in vitro infection with the 247Nluc+-excised strain is associated with LUC expression that can be detected by bioluminescence imaging.
Fig. 3.
In vitro expression of LUC by the 247Nluc+-excised strain. (A) Epifluorescence analysis of LUC expression by AlHV-1-infected syncytia. MDBK cells were infected (MOI, 10−4 PFU/cell) with the WT (i to iv) or 247Nluc+-excised (v to viii) strain. Five days p.i., the syncytia were revealed by indirect immunofluorescence costaining, using MAb 15-A and anti-LUC goat polyclonal IgG as primary antibodies. Secondary detection was performed with FITC-conjugated RtAM IgG2b and Alexa Fluor 568-conjugated rabbit anti-goat (RAG). Cells were counterstained with Hoechst 33342. Original magnification, ×200. (B) Flow cytometry analysis of LUC expression by AlHV-1-infected cells. MDBK cells were infected as described for panel A, followed by costaining using MAb 15-A and anti-LUC goat polyclonal IgG as described in Materials and Methods. Overlaid histograms show LUC expression of the 15-A-positive gated cell population. (C) MDBK cells were infected at the indicated MOI with the WT and 247Nluc+-excised strains and then overlaid with complete DMEM containing 0.6% CMC. Cells were analyzed by bioluminescence imaging at the respective time points. The images are presented with standardized minimum and maximum threshold values for photon flux.
Pathogenicity of the 247Nluc+-excised recombinant strain in rabbits.
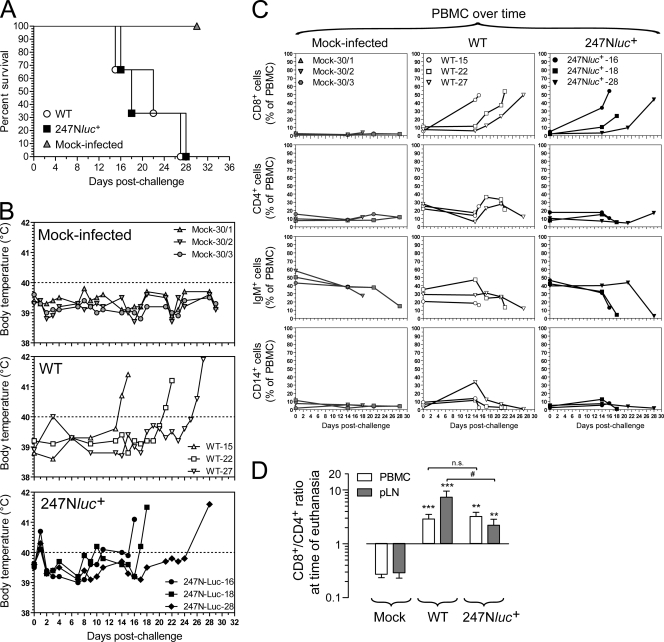
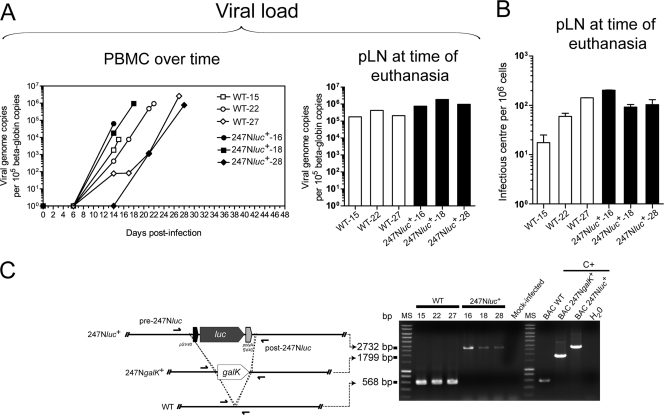
Rabbits were infected with the WT and 247Nluc+-excised strains. The two viral strains induced WD-MCF in rabbits comparably. Rabbits infected with the WT and 247Nluc+-excised strains developed persistent hyperthermia with palpable enlargement of pLN at 21.33 ± 6.02 and 21.67 ± 6.43 days p.i., respectively (Fig. 4A and B). Following infection, the percentage of CD8+ T cells increased comparably in both groups of infected rabbits. This increase in the percentage of CD8+ T cells was associated with a parallel reduction of B cell (IgM+) frequencies, whereas no major difference in the percentages of CD4+ cells or monocytes (CD14+) could be observed compared to those of mock-infected animals (Fig. 4C). At time of euthanasia and independently of the virus strain used for inoculation, ratios of CD8+ over CD4+ were inverted in PBMC and pLN cells (Fig. 4D). The increase of CD8+ T cell percentages correlated with an increase of the viral genomic charge in PBMC over time in both groups (Fig. 5A). Virus genomic copy numbers and infectious centers in pLN at time of euthanasia were also comparable between the two groups of infected animals (Fig. 5A and B).
Fig. 4.
Induction of WD-MCF in rabbits. (A) Cumulative incidence of survival of three groups of three rabbits challenged intravenously with mock-infected BT cells or BT cells infected with the WT or 247Nluc+-excised strain. (B) Body temperature was recorded daily following infection. Rabbits were identified according to the day of euthanasia postinfection (see numbers). (C) Monitoring by flow cytometry of cell subpopulations in PBMC at regular intervals postinoculation of rabbits with mock-infected BT cells (left column) or BT cells infected with the WT strain (middle column) or with the 247Nluc+-excised strain (right column). Cells were labeled for detection of CD8+, CD4+, and B cells and monocyte/macrophages, as described in Materials and Methods. (D) Ratio of CD8+/CD4+ cells from PBMC or pLN at time of euthanasia. Data show results from one out of two independent experiments with similar results. Error bars show means ± standard errors of the means (SEM) (n = 3 animals). Statistical analyses by two-tailed unpaired t test: **, P < 0.01; ***, P < 0.001, mock versus infected; #, P < 0.05, WT versus 247Nluc+; n.s., nonsignificant.
Fig. 5.
AlHV-1 viral load in PBMC and popliteal LN. (A) Real-time PCR quantification of viral genome copies in PBMC over time or at time of euthanasia in pLN postinoculation with the WT (open symbols) or 247Nluc+-excised (solid symbols) strain. Quantification was normalized on beta-globin cellular genomic sequence. (B) Quantification of infected cells in pLN single-cell suspensions by infectious center assay. The data presented are means ± SD of results from triplicate measures. (C) PCR detection of the AlHV-1 genome in DNA extracted from pLN cells of rabbits inoculated with the WT or 247Nluc+-excised strain. PCR was performed to distinguish the native insertion site in the WT from the region where the luc expression cassette was inserted by using the primers described in Table 1. C+, BAC plasmid DNA as positive controls.
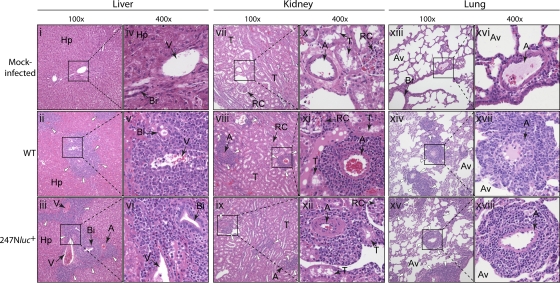
To exclude any virus cross-contamination between the two infected groups, PCR amplifications were performed on DNA extracted from pLN cells at the time of euthanasia. PCRs performed with the pre-247NlucF and post-247NlucF primers confirmed that the tissues of the infected rabbits contained only the expected virus genotype (Fig. 5C). Necropsy examination revealed WD-MCF characteristic gross lesions in both infected groups, including severe splenomegaly and generalized lymphadenopathy. Congestion and enlargement of the liver with greyish punctiform areas were similarly observed. Histological findings were also comparable between the two groups of infected rabbits (Fig. 6), with lymphocytic cells infiltrating the perivascular spaces as described previously (33). The three mock-infected rabbits survived and remained healthy throughout the course of the experiment and were euthanized at day 30 p.i. At necropsy, their organs were normal.
Fig. 6.
Histopathological characterization of WD-MCF lesions observed in liver (i to vi), kidney (vii to xii), and lung (xiii to xviii) explanted from mock-infected rabbits (top) or from rabbits infected with the WT strain (middle) or the 247Nluc+-excised strain (bottom). Images originally obtained with low (×100) and high (×400) magnifications are shown. Typical infiltrations of lymphoblastoid cells are indicated by white arrowheads. Each image is representative of lesions observed among rabbits of the same group. A, arterioles; Av, alveolar spaces; Bi, small bile ducts; Hp, hepatocytes; RC, renal corpuscles; T, uriniferous tubules; V, veins.
Macroscopic distribution of AlHV-1 infection in rabbits with WD-MCF.
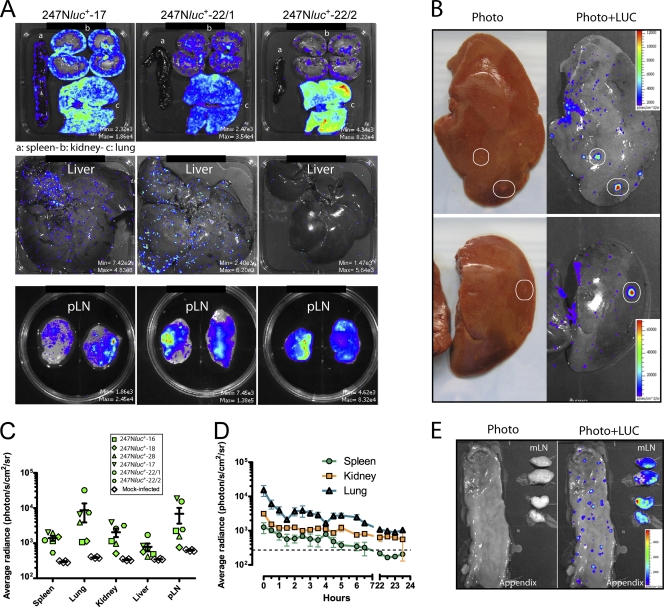
We next used the 247Nluc+-excised strain and ex vivo bioluminescence imaging to determine the macroscopic distribution of AlHV-1 infection in rabbits with WD-MCF. Spleen, lung, kidneys, liver, pLN, appendix, and mesenteric LN (mLN) were explanted and analyzed for bioluminescent signal detection. LUC activity was detected in all analyzed organs (Fig. 7A). In these organs, except for the lung, the bioluminescent signal had a multifocal pattern. In the latter, the signal was rather diffuse, with some areas showing higher signal intensities. In the kidney, bioluminescent foci were concentrated mainly in the cortical zone. Importantly, macroscopic infiltrates visible at the surface of the liver correlated with intense luminescent signals (Fig. 7B). Global average radiance of bioluminescent signal relative to the organ size revealed that luminescence signal intensities were comparable between analyzed organs but higher in lung and pLN (Fig. 7C). As dark colors absorb photons, the lower luminescent signals observed in the spleen, kidney, and liver than in the LN and lung could be explained by the color of the organs. Average radiance of photon emission relative to the organ size was further measured over time in lung, spleen, and kidney (Fig. 7D). Signal intensities slowly decreased over time but remained higher than the background signal up to 4 to 6 h after euthanasia. Finally, we also observed intense luminescent signals in mLN and focalized LUC activity in the appendix (Fig. 7E). Together, these results demonstrate that the macroscopic distribution of AlHV-1 infection in animals developing WD-MCF correlates with the distribution of the lesions in lymphoid and nonlymphoid organs.
Fig. 7.
Ex vivo detection of LUC activity by bioluminescence imaging. Three rabbits infected with the 247Nluc+-excised strain and presenting clinical signs of WD-MCF were given d-luciferin and euthanized 15 min later. Organs were explanted and analyzed for light emission. (A) Representative bioluminescent analyses of spleen, kidneys, lung, liver, and pLN explants of rabbits from two independent experiments (n = 3 animals) with similar results are shown. Rabbits were identified according to the day of euthanasia postinfection (see numbers). Images are presented with a relative photon flux scale adapted to each image in order to use the full dynamic range of the pseudocolor scale. (B) Luciferase signals in selected liver lobes and magnified for visualization of punctiform surface foci. The images are representative of data from two independent experiments and show either a standard photograph (Photo) or the same photograph overlaid with the luciferase signal (Photo+LUC). (C) Quantification of LUC bioluminescent signals per isolated organ. Each point shows the average radiance value of each organ for one individual rabbit of two independent experiments. Error bars show means ± SEM (n = 6 animals). (D) Kinetics of ex vivo bioluminescence emission of explanted organs analyzed at regular intervals. Results are shown as average radiance per organ. Error bars show means ± SEM (n = 3 animals). (E) Luciferase signals in appendix and mesenteric LN. The image shows either a standard photograph (Photo) or the same photograph overlaid with the luciferase signal (Photo+LUC).
Phenotyping of mononuclear leukocytes infiltrating lymphoid and nonlymphoid tissues during WD-MCF.
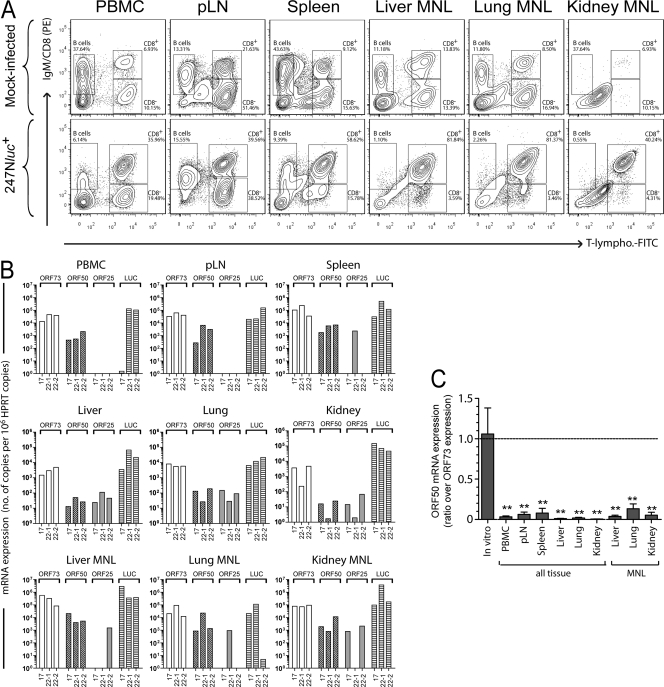
We previously observed that WD-MCF is associated with proliferation of CD8+ T cells that become the predominant cell type in lymphoid tissues with the progression of the disease (12). Here, we phenotyped the mononuclear leukocytes infiltrating lymphoid and nonlymphoid tissues during WD-MCF. Mononuclear leukocytes were isolated from PBMC, pLN, spleen, liver, lung, and kidney of rabbits infected with the 247Nluc+-excised recombinant strain or from mock-infected rabbits. Multicolor flow cytometry analyses of these cells demonstrated that CD8+ T cells represent the prominent mononuclear leukocytic population in all infected tissues (Fig. 8A).
Fig. 8.
Latency versus lytic replication viral gene expression levels in lymphoid and nonlymphoid tissues during WD-MCF. PBMC and mononuclear cells were isolated from pLN, spleen, liver, lung, and kidney of rabbits mock infected or infected with the 247Nluc+-excised strain and developing WD-MCF. (A) Multicolor flow cytometry staining of IgM+, T lymphocyte+, and CD8+ cells. The data of one rabbit representative of two independent experiments are shown (n = 3 animals). (B) Relative RNA expression of ORF73, ORF50, ORF25, and LUC. Expression levels normalized to 106 copies of the HPRT housekeeping gene are shown. Bars show individual measurements from three rabbits and are representative of results from two independent experiments. (C) RNA expression of ORF50 expressed as ratios over ORF73 expression. RNA was extracted from BT cells 96 h p.i. with 10−3 PFU/cell. Bars show means ± SEM (n = 3 animals). Statistical analyses by two-tailed unpaired t test: **, P < 0.01.
AlHV-1 infection in lymphoid and nonlymphoid tissues is predominantly latent during WD-MCF.
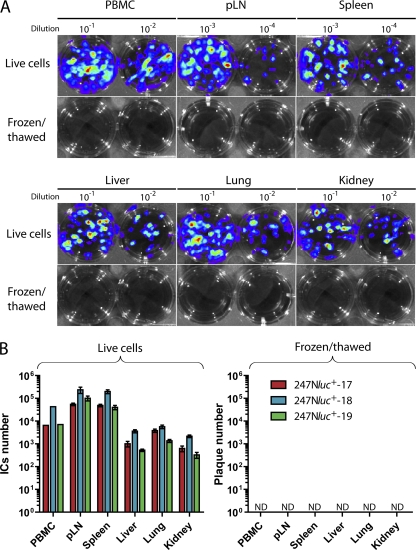
In an earlier study, we showed that among the mononuclear leukocytes isolated from peripheral blood of rabbits developing WD-MCF, AlHV-1 infection was restricted to CD8+ T cells (12). Analysis of viral gene expression revealed that CD8+ T cells supported a latent type of infection in lymphoid tissues. The ex vivo bioluminescence imaging data presented above demonstrated that AlHV-1 infection was distributed in lymphoid and nonlymphoid organs (Fig. 7). Here, we further investigated the expression of viral genes in lymphoid and nonlymphoid tissues to determine the mRNA expression levels of latency-associated ORF73 and lytic replication-related ORF50 and ORF25, as well as LUC mRNA expression. We observed high expression of ORF73 in all lymphoid and nonlymphoid tissues, whereas expression of genes associated with lytic replication was either reduced or absent (Fig. 8B). LUC was highly expressed in nonlymphoid tissues as well as in mononuclear leukocytes isolated from these tissues. ORF50 mRNA expression levels relative to ORF73 expression were further compared to BT cells supporting lytic replication 96 h p.i. (Fig. 8C). Analysis of the mRNA isolated from these cells revealed a higher expression of ORF50 than of ORF73, leading to an ORF50/ORF73 ratio close to 1. These results contrasted with the ratios observed for the tissues isolated from rabbits with WD-MCF, for which all ratios were below 0.15. Together, these results demonstrated that the expression of viral genes associated with lytic replication was either impaired or significantly reduced during WD-MCF in contrast to latency-associated ORF73. To further investigate whether infectious viral particles are produced in affected tissues, lymphoid and nonlymphoid tissue samples were analyzed by infectious center assay performed with live-cell suspension and by plaque assay following lysis of the cells by freezing/thawing (Fig. 9). Whereas infectious centers were detected in cocultures of fresh tissue homogenates, no virus plaque could be detected in cultures incubated with frozen/thawed samples. These results demonstrated that tissue lesions of rabbits developing WD-MCF contain latently infected cells but no detectable cells supporting a replicative infection.
Fig. 9.
Latent versus lytic infection in WD-MCF lesions. Three rabbits were infected with the 247Nluc+-excised strain. When rabbits developed WD-MCF clinical signs, PBMC corresponding to 10 ml of peripheral blood and homogenates from 200-mg biopsy specimens (in quadruplicates) of selected tissues were used fresh for infectious center assays or frozen/thawed for plaque assays, as detailed in Materials and Methods. (A) Cells were analyzed by bioluminescence imaging. A relative photon flux scale was adapted to each image in order to use the full dynamic range of the pseudocolor scale. Representative results are shown. (B) Infectious titers in selected tissues of individual rabbits according to infectious center assay or plaque assay, as described for panel A. Rabbits were identified according to the day of euthanasia postinfection (see numbers). Bars show means ± SEM (n = 4 animals). ND, not detected.
DISCUSSION
The pathogenesis of WD-MCF is still a matter of debate, due mainly to the lack of readily available tools to detect infected cells in vivo. Following infection with AlHV-1, rabbits develop clinical signs and lesions that are indistinguishable from those of the susceptible species, such as cattle, and are therefore used as an experimental model (6, 14, 32, 34, 37). Global in vivo imaging has become an invaluable tool for studying host-pathogen interactions in general and of virus infection in particular (5, 9–11, 22, 24, 26, 28, 30, 38). In vivo imaging studies can be performed only on sufficiently small-animal models to ensure effective transmission and detection of light (20), which renders rabbits difficult to use with this system. However, bioluminescent signals can effectively be detected from explanted organs of euthanized animals (28). In order to detect AlHV-1 infection ex vivo during WD-MCF, we used the recent BAC clone of the infectious and pathogenic C500 strain of AlHV-1 (13) and produced a recombinant strain expressing LUC as a reporter protein. We demonstrated that the recombinant strain replicated comparably to the parental WT strain in vitro and that LUC activity reported AlHV-1 infection in cell culture. Importantly, the 247Nluc+-excised strain induced WD-MCF in rabbits comparably to the parental WT strain. Ex vivo bioluminescence imaging of rabbits developing WD-MCF revealed that AlHV-1 infection could be detected in all tissues tested, including nonlymphoid organs that were infiltrated by CD8+ T cells. Finally, we demonstrated that latency-associated ORF73 is highly expressed, whereas the expression of lytic replication-related genes in lymphoid and nonlymphoid tissues remains low or absent. These observations correlated with the absence of detection of replicative infection in these tissues, strongly suggesting that latency is the predominant mode of AlHV-1 infection during WD-MCF.
Early studies based on immunofluorescence and in situ hybridization analyses detected only a very low number of infected cells in the infiltrating lesions (4, 31). Based on these observations, it had been proposed that the pathogenesis of WD-MCF could rely on the deregulation of noninfected cells by very few infected cells. This model could be called “from without,” as the cause of the deregulation is external to the dysregulated cells. According to this model, uninfected cells would be responsible for the lesions, the infected cells could be extremely rare, and their distribution could be unrelated to the localization of the lesions. Contrasting with these observations, we recently demonstrated that ≥10% of CD8+ T cells in peripheral blood carry the AlHV-1 genome (12), suggesting that a significant proportion of these cells in PBMC are infected during WD-MCF. The generation of an AlHV-1 recombinant strain expressing a LUC reporter protein allowed us to demonstrate that AlHV-1 infection can be detected ex vivo in most organs (lymphoid organs, such as spleen, LN, and appendix; nonlymphoid organs, such as lung, kidney, and liver). We observed that AlHV-1 infection was present in tissues with mainly multifocalized luminescent signals recalling the systemic infiltration of perivascular spaces observed microscopically during WD-MCF. In addition, macroscopic lesions present at the surface of the liver displayed intense LUC activity (Fig. 7B). These observations indicate that AlHV-1 infection is present in virtually all lesions during WD-MCF. Though it remains possible that the high sensibility of luciferase activity detection could enable the detection of only a few cells present in each lesion, our results demonstrate that AlHV-1 infection is highly prevalent in both lymphoid and nonlymphoid tissues. Experiments to determine the proportion and the phenotype of the infected cells in the lesions are in progress.
We recently demonstrated that WD-MCF is associated with proliferation of CD8+ T cells in PBMC and lymphoid organs (12). Such proliferation resulted in increased proportions of CD8+ T cells in these tissues. Here, we also observed heightened percentages of CD8+ T cells and inverse CD8+/CD4+ T cell ratios in PBMC and lymphoid organs of rabbits developing WD-MCF (Fig. 4). In addition, the cells infiltrating nonlymphoid organs, such as liver, lung, and kidney, were predominantly CD8+ T cells (Fig. 8A). We further observed that CD8+ T cells isolated from lymphoid and nonlymphoid organs of rabbits developing WD-MCF have an activated T-cell phenotype revealed by high expression of CD25 and gamma interferon production (B. Dewals, unpublished data). These observations suggest that WD-MCF is associated with the expansion of a homogenous population of activated CD8+ CD4− T cells infiltrating the perivascular spaces. Future experiments should address the role of CD8+ T cells in the induction of the disease. In the present study, infiltration of CD8+ T cells in organs was associated with the detection of bioluminescent signals in these tissues and organs (Fig. 7 and 8). Moreover, careful sampling of macroscopic infiltrates present at the surface of the liver displaying intense luciferase activity and analysis by flow cytometry of the cells present in these infiltrates revealed a high proportion (≥85%) of CD8+ CD4− T cells, with almost undetectable numbers of CD4+ T cells or IgM+ B cells (data not shown). According to these findings, the apparent deregulation of CD8+ T cells during WD-MCF could result from their latent infection by AlHV-1, resulting in an activated phenotype and uncontrolled proliferation of the infected cells. This model could be called “from within,” as the cause of dysregulation is internal to the deregulated cells.
Proliferation of CD8+ T cells in PBMC, spleen, and LN during WD-MCF was associated with the expression of ORF73 in these tissues (12). In gammaherpesviruses, ORF73 encodes LANA homologs that have been demonstrated to be essential for the maintenance of viral episome in latently infected cells (3). Though ORF73 has essential roles during latency, it is also expressed during lytic viral replication of gammaherpesviruses. The high luciferase activity observed could then be also attributed to AlHV-1 lytic replication (Fig. 7). Our data demonstrated that ORF73 was highly expressed in the cells isolated from all tissues, whereas lytic replication-associated gene expression was reduced (ORF50) and/or only sporadically detectable (ORF25) (Fig. 8). Though ORF50 expression was detected in all tissues, its relative expression compared to ORF73 was significantly lower in tissues than in cell culture, supporting a lytic infection. Supporting this conclusion, a recent microarray study on bovine lymph node tissue reported the expression of only two viral genes during SA-MCF, among which ORF73 expression was predominant (27). In another study, ORF25 RNA was detected in organs of rabbits infected with OvHV-2 (16). However, its expression was not related to the expression levels of ORF73. These data are therefore difficult to interpret. Expression of ORF25 was only sporadically detected in lymphoid tissues and in mononuclear leukocytes isolated from liver, lung, and kidney and could be detected at low levels in nonfractionated tissues. Such low lytic replication-related gene expression levels could reflect abortive infection and/or replication events occurring in vivo during the development of WD-MCF. However, such a phenomenon must be extremely rare compared to latently infected cells, as no virion could be isolated following plaque assays of frozen/thawed tissue homogenates as opposed to the high numbers of infectious centers obtained from live-cell suspensions (Fig. 9). Our results therefore strongly suggest that latency is the predominant mode of infection during WD-MCF and support a model “from within” for the pathogenesis of WD-MCF. According to this model, WD-MCF would be caused by a dysfunction of latently infected CD8+ T cells, and the expression of viral genes during latency would be responsible for the transformation/deregulation of the infected cells.
Latency is essential for herpesvirus persistence in vivo. Based on our hypothesis, the pathogenesis of WD-MCF might be dependent on latency and viral persistence in CD8+ T cells. However, it remains to be determined whether latency is sufficient for long-term persistence in actively dividing cells or if rare basal lytic virus replication is necessary to allow de novo infection of cells. In human herpesvirus 8 infection (HHV-8; Kaposi's sarcoma-associated herpesvirus), ORF73-mediated genome maintenance is inefficient, and rapidly dividing cells lose the HHV-8 genome within 5 to 10 doublings (21). In addition, systemic ganciclovir treatment of AIDS patients reduced the incidence of Kaposi's sarcoma during the follow-up period (25). These observations suggest that lytic replication is also important for viral persistence and, in the case of HHV-8, for Kaposi's sarcoma progression (17). Though our observations show that latency is the predominant mode of AlHV-1 infection during WD-MCF, the role of lytic AlHV-1 replication in WD-MCF remains unknown. The recent cloning of the AlHV-1 genome as an infectious and pathogenic BAC clone is an invaluable tool to produce the desired recombinants and address this question (13).
Together with the results of other studies, our findings suggest that the pathogenesis of WD-MCF relies on the proliferation of dysregulated CD8+ T cells as the consequence of their latent infection by AlHV-1.
ACKNOWLEDGMENTS
B.D. and L.P. are postdoctoral researchers of the University of Liège. F.M. and L.G. are a research fellow and a research associate of the Fonds National Belge de la Recherche Scientifique (FNRS), respectively.
We are thankful to François Massart for technical assistance.
This work was supported by grants from the University of Liège (Crédit classique) and from the FNRS (2.4623.09). The work was partially funded by the Swiss National Science Foundation grant 310030_130456 to M.A.
Footnotes
Published ahead of print on 18 May 2011.
REFERENCES
- 1. Anderson I. E., et al. 2007. Immunohistochemical study of experimental malignant catarrhal fever in rabbits. J. Comp. Pathol. 136:156–166 [DOI] [PubMed] [Google Scholar]
- 2. Bedelian C., Nkedianye D., Herrero M. 2007. Maasai perception of the impact and incidence of malignant catarrhal fever (MCF) in southern Kenya. Prev. Vet. Med. 78:296–316 [DOI] [PubMed] [Google Scholar]
- 3. Blake N. 2010. Immune evasion by gammaherpesvirus genome maintenance proteins. J. Gen. Virol. 91:829–846 [DOI] [PubMed] [Google Scholar]
- 4. Bridgen A., Munro R., Reid H. W. 1992. The detection of alcelaphine herpesvirus-1 DNA by in situ hybridization of tissues from rabbits affected with malignant catarrhal fever. J. Comp. Pathol. 106:351–359 [DOI] [PubMed] [Google Scholar]
- 5. Burgos J. S., Guzman-Sanchez F., Sastre I., Fillat C., Valdivieso F. 2006. Non-invasive bioluminescence imaging for monitoring herpes simplex virus type 1 hematogenous infection. Microbes Infect. 8:1330–1338 [DOI] [PubMed] [Google Scholar]
- 6. Buxton D., Reid H. W. 1980. Transmission of malignant catarrhal fever to rabbits. Vet. Rec. 106:243–245 [DOI] [PubMed] [Google Scholar]
- 7. Castro A. E., Heuschele W. P., Schramke M. L., Dotson J. F. 1985. Ultrastructure of cellular changes in the replication of the alcelaphine herpesvirus-1 of malignant catarrhal fever. Am. J. Vet. Res. 46:1231–1237 [PubMed] [Google Scholar]
- 8. Cleaveland S., Kusiluka L., ole Kuway J., Bell C., Kazwala R. 2001. Assessing the impact of malignant catarrhal fever in Ngorongoro district, Tanzania. Community-based Animal Health and Participatory Epidemiology Unit (CAPE), OAU, Nairobi, Kenya [Google Scholar]
- 9. Contag P. R. 2008. Bioluminescence imaging to evaluate infections and host response in vivo. Methods Mol. Biol. 415:101–118 [DOI] [PubMed] [Google Scholar]
- 10. Contag P. R., Olomu I. N., Stevenson D. K., Contag C. H. 1998. Bioluminescent indicators in living mammals. Nat. Med. 4:245–247 [DOI] [PubMed] [Google Scholar]
- 11. Costes B., et al. 2009. The major portal of entry of koi herpesvirus in Cyprinus carpio is the skin. J. Virol. 83:2819–2830 [DOI] [PMC free article] [PubMed] [Google Scholar]
- 12. Dewals B., Boudry C., Farnir F., Drion P. V., Vanderplasschen A. 2008. Malignant catarrhal fever induced by alcelaphine herpesvirus 1 is associated with proliferation of CD8+ T cells supporting a latent infection. PLoS One 3:e1627. [DOI] [PMC free article] [PubMed] [Google Scholar]
- 13. Dewals B., et al. 2006. Cloning of the genome of alcelaphine herpesvirus 1 as an infectious and pathogenic bacterial artificial chromosome. J. Gen. Virol. 87:509–517 [DOI] [PubMed] [Google Scholar]
- 14. Edington N., Patel J., Russell P. H., Plowright W. 1979. The nature of the acute lymphoid proliferation in rabbits infected with the herpes virus of bovine malignant catarrhal fever. Eur. J. Cancer 15:1515–1522 [DOI] [PubMed] [Google Scholar]
- 15. Ensser A., Pflanz R., Fleckenstein B. 1997. Primary structure of the alcelaphine herpesvirus 1 genome. J. Virol. 71:6517–6525 [DOI] [PMC free article] [PubMed] [Google Scholar]
- 16. Gailbreath K. L., Taus N. S., Cunha C. W., Knowles D. P., Li H. 2008. Experimental infection of rabbits with ovine herpesvirus 2 from sheep nasal secretions. Vet. Microbiol. 132:65–73 [DOI] [PubMed] [Google Scholar]
- 17. Ganem D. 2010. KSHV and the pathogenesis of Kaposi sarcoma: listening to human biology and medicine. J. Clin. Invest. 120:939–949 [DOI] [PMC free article] [PubMed] [Google Scholar]
- 18. Gillet L., et al. 2005. Development of bovine herpesvirus 4 as an expression vector using bacterial artificial chromosome cloning. J. Gen. Virol. 86:907–917 [DOI] [PubMed] [Google Scholar]
- 19. Godornes C., Leader B. T., Molini B. J., Centurion-Lara A., Lukehart S. A. 2007. Quantitation of rabbit cytokine mRNA by real-time RT-PCR. Cytokine 38:1–7 [DOI] [PMC free article] [PubMed] [Google Scholar]
- 20. Greer L. F., III, Szalay A. A. 2002. Imaging of light emission from the expression of luciferases in living cells and organisms: a review. Luminescence 17:43–74 [DOI] [PubMed] [Google Scholar]
- 21. Grundhoff A., Ganem D. 2004. Inefficient establishment of KSHV latency suggests an additional role for continued lytic replication in Kaposi sarcoma pathogenesis. J. Clin. Invest. 113:124–136 [DOI] [PMC free article] [PubMed] [Google Scholar]
- 22. Hwang S., et al. 2008. Persistent gammaherpesvirus replication and dynamic interaction with the host in vivo. J. Virol. 82:12498–12509 [DOI] [PMC free article] [PubMed] [Google Scholar]
- 23. Li H., Dyer N., Keller J., Crawford T. B. 2000. Newly recognized herpesvirus causing malignant catarrhal fever in white-tailed deer (Odocoileus virginianus). J. Clin. Microbiol. 38:1313–1318 [DOI] [PMC free article] [PubMed] [Google Scholar]
- 24. Luker G. D., Prior J. L., Song J., Pica C. M., Leib D. A. 2003. Bioluminescence imaging reveals systemic dissemination of herpes simplex virus type 1 in the absence of interferon receptors. J. Virol. 77:11082–11093 [DOI] [PMC free article] [PubMed] [Google Scholar]
- 25. Martin D. F., et al. 1999. Oral ganciclovir for patients with cytomegalovirus retinitis treated with a ganciclovir implant. Roche Ganciclovir Study Group N. Engl. J. Med. 340:1063–1070 [DOI] [PubMed] [Google Scholar]
- 26. Matthews Q. L., et al. 2006. Genetic incorporation of a herpes simplex virus type 1 thymidine kinase and firefly luciferase fusion into the adenovirus protein IX for functional display on the virion. Mol. Imaging 5:510–519 [PMC free article] [PubMed] [Google Scholar]
- 27. Meier-Trummer C. S., et al. 2009. Malignant catarrhal fever of cattle is associated with low abundance of IL-2 transcript and a predominantly latent profile of ovine herpesvirus 2 gene expression. PLoS One 4:e6265. [DOI] [PMC free article] [PubMed] [Google Scholar]
- 28. Milho R., et al. 2009. In vivo imaging of murid herpesvirus-4 infection. J. Gen. Virol. 90:21–32 [DOI] [PMC free article] [PubMed] [Google Scholar]
- 29. Nakajima Y., Ishikawa Y., Kadota K., Kodama M., Honma Y. 1994. Surface marker analysis of the vascular and epithelia lesions in cattle with sheep-associated malignant catarrhal fever. J. Vet. Med. Sci. 56:1065–1068 [DOI] [PubMed] [Google Scholar]
- 30. Oliver S. L., Zerboni L., Sommer M., Rajamani J., Arvin A. M. 2008. Development of recombinant varicella-zoster viruses expressing luciferase fusion proteins for live in vivo imaging in human skin and dorsal root ganglia xenografts. J. Virol. Methods 154:182–193 [DOI] [PMC free article] [PubMed] [Google Scholar]
- 31. Patel J. R., Edington N. 1981. The detection and behaviour of the herpesvirus of malignant catarrhal fever in bovine lymphocytes. Arch. Virol. 68:321–326 [DOI] [PubMed] [Google Scholar]
- 32. Plowright W. 1968. Malignant catarrhal fever. J. Am. Vet. Med. Assoc. 152:795–803 [Google Scholar]
- 33. Plowright W. 1990. Malignant catarrhal fever virus, p. 123–150 In Dinter Z., Morein B. (ed.), Virus infections of ruminants. Elsevier, Amsterdam, Netherlands [Google Scholar]
- 34. Plowright W., Ferris R. D., Scott G. R. 1960. Blue wildebeest and the aetiological agent of bovine malignant catarrhal fever. Nature 188:1167–1169 [DOI] [PubMed] [Google Scholar]
- 35. Plowright W., Herniman K. A., Jessett D. M., Kalunda M., Rampton C. S. 1975. Immunisation of cattle against the herpesvirus of malignant catarrhal fever: failure of inactivated culture vaccines with adjuvant. Res. Vet. Sci. 19:159–166 [PubMed] [Google Scholar]
- 36. Sambrook J., Russell D. W. 2001. Molecular cloning: a laboratory manual, 3rd ed. Cold Spring Harbor Laboratory Press, Cold Spring Harbor, NY [Google Scholar]
- 37. Schock A., Reid H. W. 1996. Characterisation of the lymphoproliferation in rabbits experimentally affected with malignant catarrhal fever. Vet. Microbiol. 53:111–119 [DOI] [PubMed] [Google Scholar]
- 38. Smith P. G., et al. 2005. Herpesvirus saimiri-based vector biodistribution using noninvasive optical imaging. Gene Ther. 12:1465–1476 [DOI] [PubMed] [Google Scholar]
- 39. Swa S., Wright H., Thomson J., Reid H., Haig D. 2001. Constitutive activation of Lck and Fyn tyrosine kinases in large granular lymphocytes infected with the gamma-herpesvirus agents of malignant catarrhal fever. Immunology 102:44–52 [DOI] [PMC free article] [PubMed] [Google Scholar]
- 40. Traul D. L., et al. 2005. A real-time PCR assay for measuring alcelaphine herpesvirus-1 DNA. J. Virol. Methods 129:186–190 [DOI] [PubMed] [Google Scholar]
- 41. Vanderplasschen A., Bublot M., Dubuisson J., Pastoret P. P., Thiry E. 1993. Attachment of the gammaherpesvirus bovine herpesvirus 4 is mediated by the interaction of gp8 glycoprotein with heparinlike moieties on the cell surface. Virology 196:232–240 [DOI] [PubMed] [Google Scholar]
- 42. Warming S., Costantino N., Court D. L., Jenkins N. A., Copeland N. G. 2005. Simple and highly efficient BAC recombineering using galK selection. Nucleic Acids Res. 33:e36. [DOI] [PMC free article] [PubMed] [Google Scholar]
- 43. Zhao T. M., Hague B., Caudell D. L., Simpson R. M., Kindt T. J. 2005. Quantification of HTLV-I proviral load in experimentally infected rabbits. Retrovirology 2:34. [DOI] [PMC free article] [PubMed] [Google Scholar]


