Abstract
We describe a method for imaging individual mRNA molecules in fixed cells by probing each mRNA species with 48 or more short, singly labeled oligonucleotide probes. This makes each mRNA molecule visible as a computationally identifiable fluorescent spot via fluorescence microscopy. We demonstrate simultaneous detection of three mRNA species in single cells and mRNA detection in yeast, nematodes, fruit fly wing discs, mammalian cell lines and neurons.
As it is becoming increasingly apparent that gene expression in individual cells deviates significantly from the average behavior of cell populations1, new methods that provide accurate integer counts of mRNA copy numbers in individual cells are needed. Ideally, such methods should also reveal the intracellular locations of the mRNAs, as mRNA localization is often used by cells to spatially restrict the activity of proteins2. One candidate for such a method is in situ hybridization followed by microscopic analysis3, 4. A conventional practice is to link probes to enzymes that catalyze chromogenic or fluorogenic reactions5. However, because the products of these reactions are small molecules or precipitates that diffuse away from the probe, the location of the target molecule is not precisely determined. Conversely, probes labeled directly with a few fluorophores maintain spatial resolution, but the sensitivity that can be achieved is relatively poor.
To circumvent these problems, Robert Singer and colleagues developed a fluorescence in situ hybridization (FISH) procedure that is sensitive enough to detect single mRNA molecules6. They simultaneously hybridize five oligonucleotide probes, each about 50-nucleotides long and labeled with five fluorophore moieties, to each mRNA target which then becomes visible as a diffraction limited fluorescent spot. Yet, while other groups have successfully used these probes7, the system has not been widely adopted. One reason for this is difficulty in the synthesis and purification of heavily labeled oligonucleotides: the amine groups used for coupling fluorophores to the probe are prone to loss and it is hard to purify fully coupled probes from partially coupled ones8. Also, when some fluorophores are present in multiple copies on the same oligonucleotide, they interact with each other altering the hybridization characteristics of the oligonucleotides and resulting in severe self-quenching9.
Another issue with the use of small numbers of heavily labeled probes is that the signals are more prone to variability. For instance, when using 5 fluorescent probes targeted to a single mRNA, Femino et al6 estimated that the majority of the fluorescent spots observed have intensities corresponding to the presence of only 1 or 2 probes. This makes it difficult to unambiguously identify all the fluorescent spots as mRNA molecules, since it is impossible to determine whether the detection of an individual probe arises from legitimate binding to the target mRNA or non-specific binding.
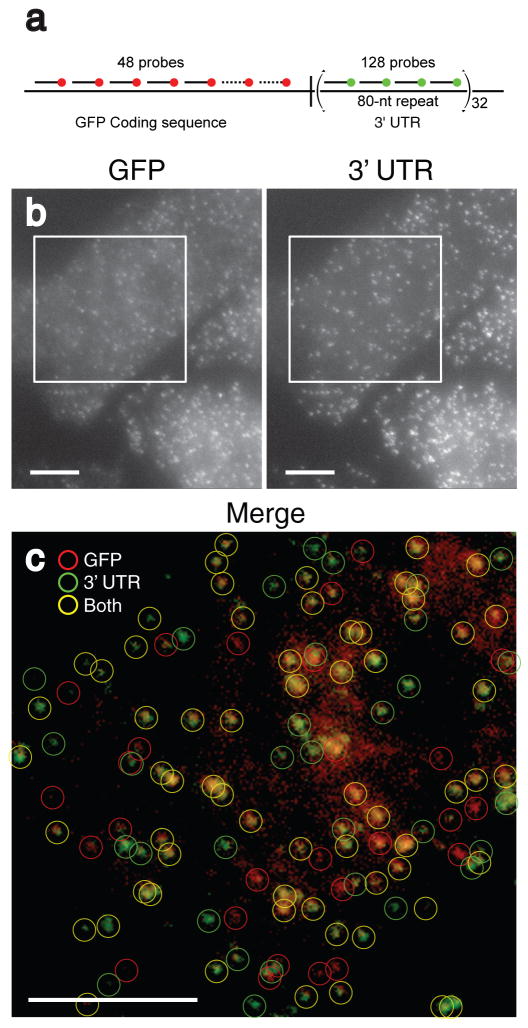
To address these issues, we reasoned that by taking advantage of the high throughput of 96-position DNA synthesizers, one could synthesize a large number of probes and reliably label them with a single fluorophore moiety at their 3′-terminii to detect individual mRNA molecules. For the initial test of our hypothesis, we constructed a doxycycline-controlled gene that produced an mRNA encoding green fluorescent protein (GFP) and possessed 32 tandemly repeated 80 nucleotide-long sequences in its 3′-UTR; we then stably integrated this engineered gene into the genome of a Chinese hamster ovary cell line (Fig. 1a). Previously, we have shown that fluorescent probes targeted to tandemly repeated copies of probe binding sequence results in FISH signals corresponding to individual molecules using a variety of methods, including a demonstration that the number of fluorescent spots per cell was about the same as the number of mRNA per cell as measured by quantitative real-time RT-PCR10, 11. We targeted the coding region of the GFP mRNA with 48 oligonucleotides labeled with Alexa 594 fluorophores and targeted the repeat sequence with 4 oligonucleotides labeled with tetramethylrhodamine (TMR).
Figure 1.
Simultaneous detection of a unique sequence and a repeated sequence in individual mRNA molecules. a) Schematic depiction of the construct used. The 48 probes used to detect the GFP coding sequence were labeled with Alexa 594 and the four different probes used to detect the tandem repeat in the 3′ UTR were labeled with TMR. b) Maximum intensity merges of a pair of z-stacks of fluorescent images of CHO cells taken in the Alexa 594 channel (left) and the TMR channel (right) corresponding to GFP coding region probes and UTR probes, respectively. c) False color merge of the images in b) enclosed by the squares, with circles representing computationally identified mRNA particles. All scale bars are 5 μm long.
After hybridization the cells were imaged with a pair of filter sets that could clearly distinguish between the two fluorophores. We found many “particles” with a diameter of about 0.25 micrometers that appeared in both the TMR and Alexa 594 channels (Fig. 1b). The particles were identified computationally using an image processing program (Supplementary Fig. 1 online, Supplementary Methods online and Supplementary Software online) that categorizes particles as being labeled with either the GFP-coding-sequence probes (TMR), the UTR-specific probes (Alexa-594), or both (Fig. 1c). Upon identifying and localizing particles in four fields of view similar to the ones shown in Figure 1c, we counted a total of 599 particles corresponding to GFP-coding sequence-specific probes and 565 particles corresponding to the UTR-specific probes. Of these particles, 85% of the “UTR particles” co-localized with the “GFP particles,” whereas 81% of the GFP particles co-localized with the UTR particles. The high degree of co-localization between particles detected by the previously established tandem repeat detection method10 and the particles detected via simultaneous probing with 48 different singly-labeled oligonucleotides demonstrates the validity of using multiple single-labeled probes for the detection of endogenous transcripts. The fraction of particles that did not display co-localization likely correspond to mRNA molecules that lost either their coding sequence or their 3′-UTR in the natural processes of mRNA degradation. An analysis of fluorescent intensity of the colocalized spots showed that the spot intensities displayed a unimodal distribution (Supplementary Fig. 2 online), arguing that the particles detected are individual molecules10.
We also explored how the signal intensity would vary with the number of probes by performing FISH using either the first 12, 24, 36 probes or all 48 probes in our set. For this particular target mRNA, we found that particles could be detected with fewer numbers of probes, albeit with decreased intensity (Supplementary Fig. 3a online). However, our automatic spot detection algorithm performed particularly well with 48 probes, detecting the same number of spots over a broad range of thresholds (Supplementary Fig. 3b online). The number of probes required for robust signal is likely to depend on the target sequence, though, as accessibility to probes depends on the secondary structure in the RNA. We found our method to be at least as sensitive as the method of Femino et al.6 (Supplementary Fig. 4 online).
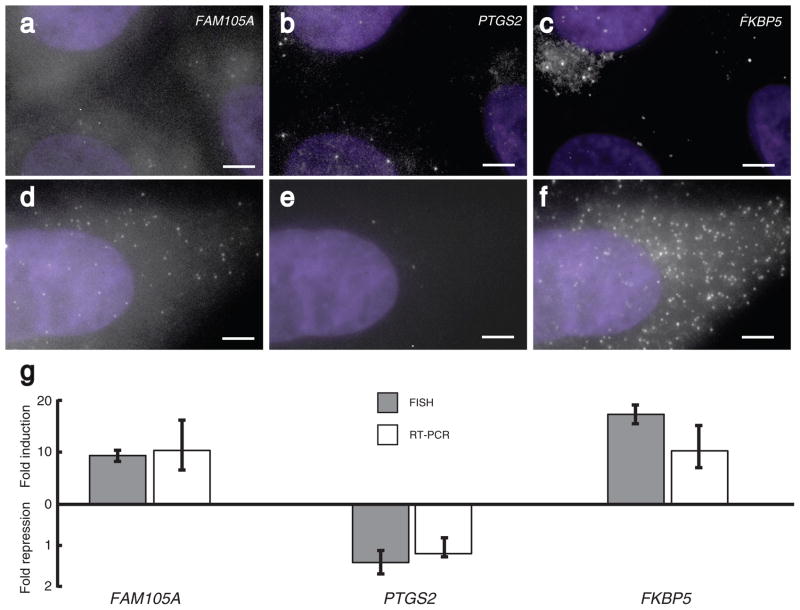
A potential use of our method is the simultaneous detection of single molecules of multiple mRNAs in individual cells. To demonstrate the ability to detect three different mRNAs at the same time, we designed probes specific for mRNAs encoding FKBP5, PTGS2 and FAM105A in the human carcinoma cell line A549. These probes were coupled to the spectrally distinct fluorophores Cy5, Alexa 594 and TMR, respectively. Upon performing FISH with all three probes simultaneously, individual spots were visible in the three different fluorescence channels (Fig. 2a–f). The spots corresponding to different mRNAs did not overlap with each other. An intensity analysis showed that fluorescent spots did not bleed through into other channels (Supplemantary Fig. 5 online) and the use of a oxygen-scavenging mounting buffer ensured the stability of all fluorophores during the acquisition of image stacks (Supplementary Fig. 6 online).
Figure 2.
Simultaneous imaging of three different mRNAs in mammalian cells. a–c) Images showing FAM105A, PTGS2 and FKBP5 mRNA particles in the same set of A549 cells not treated with dexamethasone. d–f) Images showing FAM105A, PTGS2 and FKBP5 particles in cells treated for 8 hours with 24 nM dexamethasone. g) Fold induction for all three genes as measured by FISH and real-time RT-PCR; error bars for FISH were obtained by bootstrapping and those for RT-PCR were obtained by repetition as described in the supplementary information. All images are maximum merges of a z-stack of fluorescent images spanning the extent of the cells with nuclear DAPI counterstaining in purple, and all scale bars are 5 μm long.
To demonstrate that our method of mRNA detection was specific and quantitative, we added a cell-permeable glucocorticoid, dexamethasone, to the growth medium, thus upregulating the expression of FKBP5 and FAM105A while mildly downregulating the expression of PTGS2 in this particular cell-line12. We found that the mean number of FKBP5 and FAM105A mRNAs measured by combining FISH with our spot detection algorithm increased while the mean number of PTGS2 mRNAs decreased (compare Figs. 2a–c to 2d–f). These numbers corresponded well to RT-PCR measurements of the fold induction and repression of these genes performed on the same samples, demonstrating that the fluorescent spots are the appropriate mRNAs and that we were detecting a majority of the mRNA molecules (Fig. 2g). Moreover, this further demonstrates the effectiveness of our spot detection algorithm for accurate gene expression quantification.
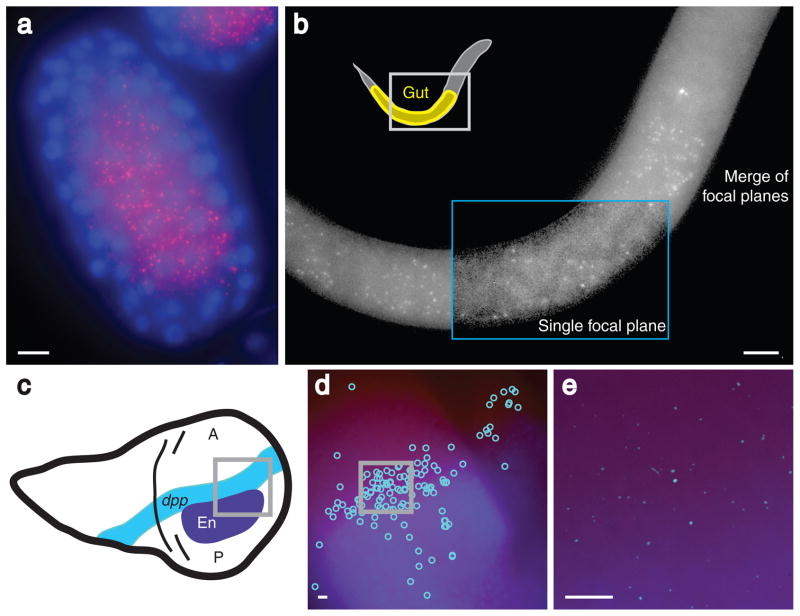
Our method also captures spatial information about the location of the mRNAs detected, a particularly important feature for studying development, in which mRNAs often display spatial patterning. We tested our method for efficacy in two commonly studied developmental systems: the nematode, Caenorhabditis elegans, and the fruit fly, Drosophila melanogaster. In the nematode, we constructed probes to detect mRNA molecules transcribed from the gene elt-2, a transcription factor that is expressed only in the nematode gut and only after the embryo has developed to the 45-cell stage13. After hybridization of the probe set to both embryos and larvae, we found that elt-2 mRNA molecules were present only within the gut region (Fig. 3a) of both the embryos and the larvae (Fig. 3b). Consistent with the known timing of the onset of expression13, we only detected elt-2 mRNAs in the gut of embryos older than the 45-cell stage. In the fruit fly, one of the most well-studied examples of the localization of gene expression occurs in wing imaginal disc development14. The wing discs of fruit fly larvae display a remarkable set of gene expression patterns, one of which is the formation of a stripe of expression of the gene dpp in response to gradients of the morphogenic proteins Hedgehog and Engrailed14 (Fig. 3c). To check whether this narrow stripe of dpp mRNA synthesis can be imaged, we constructed a set of singly labeled probes against dpp mRNA and performed FISH on imaginal wing discs isolated from third instar larvae while simultaneously performing immunofluorescence against Engrailed protein (shown in blue). We detected dpp mRNA in a stripe along the boundary of Engrailed protein expression (Fig. 3d–e), demonstrating both that the method can work in wing imaginal discs and that the method can be easily combined with immunofluorescence.
Figure 3.
Imaging localized mRNAs in C. elegans and D. melanogaster. a) elt-2 mRNA molecules (red) in an early stage embryo (~100 cell stage) from C. elegans; the nuclei have been counterstained with DAPI (blue). b) elt-2 mRNA molecules in an L1 larva from C. elegans. Inside the blue box, a single focal plane is shown in which the intestinal track is visible. c) A schematic depiction of dpp and engrailed expression in the imaginal wing discs of third instar larvae from D. melanogaster. d) Image showing the locations of the computationally identified dpp mRNA molecules (light blue circles) and Engrailed expression detected by immunofluorescence (dark blue). e) Image containing enhanced dpp mRNA molecule signals (light blue) and Engrailed protein expression detected by immunofluorescence (dark blue). All images except the boxed portion of (b) are maximum merges of a z-stack of fluorescent images, and all scale bars are 5 μm long.
Further tests of our method showed that it was also applicable to Saccharomyces cerevisae and cultured hippocampal neurons, showing specificity in the behavior of the STL1 gene and β-actin mRNA and Map2 genes, respectively (Supplementary Fig. 7 online).
In summary, we have described here a FISH method that allows for multiplex gene expression profiling of transcripts across a host of model organisms. By using large numbers of singly labeled probes, our method generates uniform signals that can be computationally identified to yield accurate mRNA counts. In contrast, methods using heavily labeled probes (such as dendrimers) can suffer from false positives and negatives owing to individual probe misbinding or nonbinding events, respectively. Another advantage is the simplicity of probe generation and purification; by pooling, coupling and purifying the probes en masse, much of the complexity of probe preparation can be avoided. We have deployed a web-based program for designing probe sets with optimally uniform GC content (www.singlemoleculefish.com). The simplicity of our method will likely facilitate genomic-scale studies of mRNA number and localization with applications in systems biology, cell biology, neurobiology and developmental biology.
Supplementary Material
Supplementary Figure 1. Computational identification of mRNA spots.
Supplementary Figure 2. Intensity analysis of colocalized spots.
Supplementary Figure 3. Sensitivity of method when using different numbers of probes.
Supplementary Figure 4. Comparison with the mRNA detection method of Femino et al.
Supplementary Figure 5. Examination of fluorescent spot bleed through.
Supplementary Figure 6. Demonstration that the oxygen-scavenger increases photostability of Cy5.
Supplementary Figure 7. Imaging single mRNA molecules in yeast and neurons.
Acknowledgments
We thank Salvatore AE Marras, Fred R. Kramer, Diana Vargas, Saurav Sinha, Erik Andersen, Gregor Neuert and Qiong Yang. This work was supported by National Institute of Mental Health grant MH079197, National Institute of General Medicine grants GM068957, GM077183 and GM070357, National Science Foundation Grant PHY0548484. Arjun Raj is supported by NSF Fellowship DMS-0603392 and a Burroughs Wellcome Fund Career Award at the Scientific Interface.
References
- 1.Kaufmann BB, van Oudenaarden A. Stochastic gene expression: from single molecules to the proteome. Curr Opin Genet Dev. 2007;17:107–112. doi: 10.1016/j.gde.2007.02.007. [DOI] [PubMed] [Google Scholar]
- 2.St Johnston D. Moving messages: the intracellular localization of mRNAs. Nat Rev Mol Cell Biol. 2005;6:363–375. doi: 10.1038/nrm1643. [DOI] [PubMed] [Google Scholar]
- 3.Gall JG. Differential synthesis of the genes for ribosomal RNA during amphibian oogenesis. Proc Natl Acad Sci U S A. 1968;60:553–560. doi: 10.1073/pnas.60.2.553. [DOI] [PMC free article] [PubMed] [Google Scholar]
- 4.Levsky JM, Singer RH. Fluorescence in situ hybridization: past, present and future. J Cell Sci. 2003;116:2833–2838. doi: 10.1242/jcs.00633. [DOI] [PubMed] [Google Scholar]
- 5.Raap AK, et al. Ultra-sensitive FISH using peroxidase-mediated deposition of biotin- or fluorochrome tyramides. Hum Mol Genet. 1995;4:529–534. doi: 10.1093/hmg/4.4.529. [DOI] [PubMed] [Google Scholar]
- 6.Femino AM, Fay FS, Fogarty K, Singer RH. Visualization of single RNA transcripts in situ. Science. 1998;280:585–590. doi: 10.1126/science.280.5363.585. [DOI] [PubMed] [Google Scholar]
- 7.Maamar H, Raj A, Dubnau D. Noise in gene expression determines cell fate in Bacillus subtilis. Science. 2007;317:526–529. doi: 10.1126/science.1140818. [DOI] [PMC free article] [PubMed] [Google Scholar]
- 8.Femino AM, Fogarty K, Lifshitz LM, Carrington W, Singer RH. Visualization of single molecules of mRNA in situ. Methods Enzymol. 2003;361:245–304. doi: 10.1016/s0076-6879(03)61015-3. [DOI] [PubMed] [Google Scholar]
- 9.Randolph JB, Waggoner AS. Stability, specificity and fluorescence brightness of multiply-labeled fluorescent DNA probes. Nucleic Acids Res. 1997;25:2923–2929. doi: 10.1093/nar/25.14.2923. [DOI] [PMC free article] [PubMed] [Google Scholar]
- 10.Vargas DY, Raj A, Marras SA, Kramer FR, Tyagi S. Mechanism of mRNA transport in the nucleus. Proc Natl Acad Sci U S A. 2005;102:17008–17013. doi: 10.1073/pnas.0505580102. [DOI] [PMC free article] [PubMed] [Google Scholar]
- 11.Raj A, Peskin CS, Tranchina D, Vargas DY, Tyagi S. Stochastic mRNA synthesis in mammalian cells. PLoS Biol. 2006;4:e309. doi: 10.1371/journal.pbio.0040309. [DOI] [PMC free article] [PubMed] [Google Scholar]
- 12.Wang JC, et al. Chromatin immunoprecipitation (ChIP) scanning identifies primary glucocorticoid receptor target genes. Proc Natl Acad Sci U S A. 2004;101:15603–15608. doi: 10.1073/pnas.0407008101. [DOI] [PMC free article] [PubMed] [Google Scholar]
- 13.Fukushige T, Hawkins MG, McGhee JD. The GATA-factor elt-2 is essential for formation of the Caenorhabditis elegans intestine. Dev Biol. 1998;198:286–302. [PubMed] [Google Scholar]
- 14.Sanicola M, Sekelsky J, Elson S, Gelbart WM. Drawing a stripe in Drosophila imaginal disks: negative regulation of decapentaplegic and patched expression by engrailed. Genetics. 1995;139:745–756. doi: 10.1093/genetics/139.2.745. [DOI] [PMC free article] [PubMed] [Google Scholar]
Associated Data
This section collects any data citations, data availability statements, or supplementary materials included in this article.
Supplementary Materials
Supplementary Figure 1. Computational identification of mRNA spots.
Supplementary Figure 2. Intensity analysis of colocalized spots.
Supplementary Figure 3. Sensitivity of method when using different numbers of probes.
Supplementary Figure 4. Comparison with the mRNA detection method of Femino et al.
Supplementary Figure 5. Examination of fluorescent spot bleed through.
Supplementary Figure 6. Demonstration that the oxygen-scavenger increases photostability of Cy5.
Supplementary Figure 7. Imaging single mRNA molecules in yeast and neurons.


