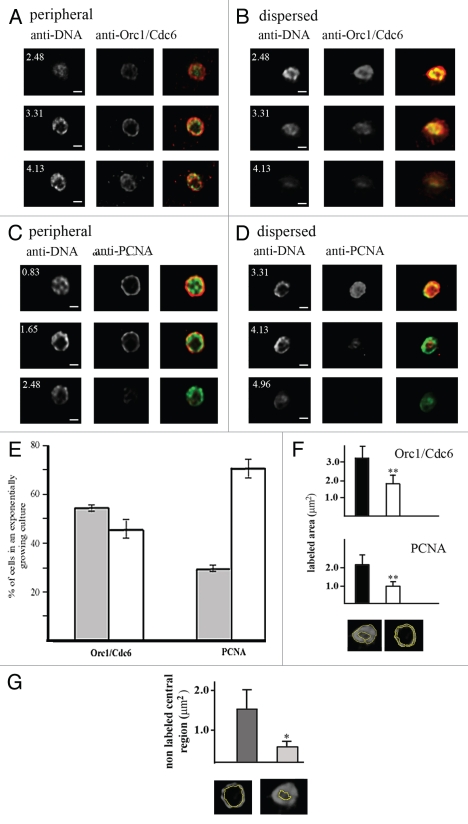
Figure 2.
There are two patterns of TcOrc1/Cdc6 and TcPCNA distribution in the nuclei of T. cruzi epimastigote cells. Epimastigote cells were fixed with 2% paraformaldehyde, permeabilized with Triton X-100 and incubated with (A and B) anti-TcOrc1/Cdc6 (red) or (C and D) anti-TcPCNA antibodies (red). All cells were labeled with mAbB17 (green), a monoclonal anti-DNA antibody. Images shown for each pattern were acquired at different Z-sections by a confocal microscope. The white numbers indicate the distance between the section and the top limit of each nucleus. N indicates nuclei, k indicates kinetoplasts and bars represent 1 µm. (E) Graph shows average ± standard deviation of three independent experiments (n = 100), indicating the proportion of cells in an exponentially growing culture presenting TcOrc/Cdc6 or TcPCNA constrained at the nuclear periphery (gray box) or dispersed throughout the entire nucleus (white box). (F) Graphs show labeled area by anti-TcOrc1/Cdc6 or anti-TcPCNA in dispersed (black) or peripheral (white) patterns (n = 50). To perform this analysis the labeled areas were circled as exemplified in the bottom of (F) and these areas were quantified using the Image J program. **p < 0.01. (G) Graph shows the central non-labeled area by anti-TcOrc1/Cdc6 (dark gray) or anti-TcPCNA (light gray) antibodies. To perform this analysis the central non-labeled areas were circled as exemplified in the bottom of (G) and these areas were quantified by Image J. *p < 0.05.

