

Abstract
Lipid interfaces, ranging from cell membranes to thin surfactant layers that stabilize lung alveoli, are integral to living systems. Such interfaces are often subjected to mechanical forces, and because of their membrane-like geometry, they can easily deform by bending into localized folds. In this work, we explore the role of small molecules (i.e., glycerol) on the mechanical stability of model lung surfactant monolayers. We demonstrate that the presence of glycerol increases local monolayer bending stiffness by orders of magnitude. Our x-ray and neutron reflectivity measurements indicate that water is preferentially depleted, or glycerol is preferentially enriched, at the lipid headgroup/solvent interface, and that this glycerol-enriched layer extends beneath the monolayer with an adsorption free energy of −2.5 to −4.6 kJ/mol. The dramatic change in membrane bending stiffness in the presence of the sugar adlayer is understood in terms of two models: 1), lipid antiplasticization by glycerol; and 2), a continuum mechanical model of the viscous adlayer.
Introduction
Interfaces abound in living matter, ranging from tough outer coverings such as skin, scales, and cell walls to softer ones such as lungs, blood vessels, and cell membranes. Proteins and biopolymers play an important role in the structure and function of these interfaces; however, the majority of interfaces are largely composed of self-assembled lipid molecules. Our study was motivated by the immense structural challenge posed by the need to maintain adequate gas exchange in animals with lungs. For example, to adequately exchange gas, the interfacial area of human lungs must be large and easily expandable (1). However, any such air-water interface will be dominated by surface tension. Lung surface areas remain large and compliant because the effects of surface tension are minimized by a self-assembled film of lipids and proteins called lung surfactant (LS) (1). Although LS stabilizes lung tissue overall, it is itself subjected to mechanical stress during the breathing cycle as the lung surface area changes (2,3). When the locally flat LS membrane is highly compressed (as upon exhalation), it moves out of the interface plane into deep folds (phenomenologically termed collapse) (1–8). Recent work by our group showed that surfactant folding is part of a more general surface phenomenon: any compressed elastic thin membrane resting on a fluid substrate initially undergoes gentle out-of-plane buckling (wrinkling), such that the interfacial energy is evenly distributed across the interface. At larger strains, the wrinkled surface transforms into sharp folds in which energy is focused (4,9).
The wrinkle-to-fold model provides a tool to probe the governing parameters of lipid membrane mechanics in highly compressed and condensed lipid phases. Temperature can dramatically change membrane folding by influencing the global phase behavior of lipid molecules (2,4). Moreover, extensive work by Zasadzinski's group showed that LS mechanics is sensitive to additives from tobacco smoke and subphase ionic strength (10–14). In this work, we explore the ability of nonionic sugary molecules (i.e., glycerol) to change lipid membrane mechanics. The role played by small sugary molecules in membrane structure has not been fully explored, despite their supposed influence on membrane stability (e.g., anhydrobiosis) and disease processes such as diabetes (15–18). In the case of LS, it is known that the alveolar lining fluid (ALF) is devoid of glucose because of the action of apical sodium-glucose cotransporters; however, the physiological role of this depletion is poorly understood (19,20). Nevertheless, the deleterious effect of high sugar levels on lung tissue is well appreciated (21,22). In particular, there is evidence that lungs may become less compliant due to a decrease in surfactant function in diabetics (22).
Here, we report that the stiffness of model LS monolayers becomes orders of magnitude greater in solutions of glycerol (the simplest carbohydrate) compared with pure water. Using x-ray (XR) and neutron reflectivity (NR), we show that the perfect miscibility of water and glycerol breaks down in the adjacent layer of fluid, resulting in a glycerol-enriched layer extending beneath the interfacial lipid layer. To the best of our knowledge, this is the first experimental report of the existence of such demixing boundary layers for sugary molecules next to lipid layers, and the profound impact of these layers on monolayer mechanical properties.
Materials and Methods
Lipids, subphase, and superphase
Dipalmitoylphosphatidylcholine (DPPC), palmitoyloleoylphosphatidylglycerol (POPG), and the deuterated lipids DPPC-d62 and DPPC-d75 were obtained in powder form from Avanti Polar Lipids (Alabaster, AL) and used without further purification as described previously (2,4). Different deuteration schemes were used to achieve maximum contrast and reveal the glycerol adlayer. For all Langmuir trough experiments, the subphase was ultrapure water (resistivity = 18 MΩ-cm) processed by a Milli-Q ultrapurification setup (A-10 gradient; Millipore, Bedford, MA), D2O obtained from Cambridge Isotopes (Andover, MA), or a wt/wt percentage water/glycerol or D2O/glycerol mixture. The glycerol used was spectrophotometric grade (Sigma-Aldrich, St. Louis, MO) with no further purification. However, each batch was tested with surface tension measurements to ensure that no surface-active contaminants were present.
Instrumentation
The Langmuir trough setup used for isotherm collection and fluorescence imaging is described elsewhere (2,4), and previous studies provided details regarding the dedicated XR and NR beamline assemblies of ChemMatCARS at the Advanced Photon Source (APS) at Argonne (23,24), and SPEAR at the Los Alamos National Laboratory (25). Configurations for XR and pinhole grazing incidence diffraction (GID) experiments can be found in Lin et al. (26) and Meron et al. (27). For isotherm, fluorescence, XR, and neutron experiments, a similar method of preparing the lipid interface is followed. The Langmuir monolayer is spread at the (Ar, He, air)/water interface by drop-wise addition of the lipid spreading solution and allowed to equilibrate for 20 min (water) or 60 min (glycerol mixtures). Compression is carried out at 10 mm2/s until the system reaches its compression limit (isotherms and fluorescence) or the desired target pressure (scattering).
Image tracking
In brief, the analog fluorescence video of the motion of the monolayer is digitized into a series of 8-bit grayscale bitmaps of 640 × 480 pixels at a rate of 30 frames/s. The series of images are subsequently analyzed with the use of a custom-made tracking program whose output is the two-dimensional (2D) displacement field of the monolayer as a function of time (28). The program achieves a spatial precision of 0.8 pixel by independently tracking separate regions of the image. To distinguish different folding events and quantitate the amount of material displaced during an event, each vector component is processed using a simple exponential moving average. The final output is the total amount of material displaced into a fold (ℓ). Further details about the tracking are available in the Supporting Material.
Scattering data analysis and modeling
We performed both XR and NR to obtain out-of-plane electron density and scattering length density (SLD) distribution information, respectively, regarding the samples. Analysis of such data provides information about the chemical composition of an interface with angstrom-level resolution (29,30). Because contrast can be enhanced by deuteration in NR, and the high brilliance of XR beams can provide data out to high qz (the wave vector in the direction perpendicular to the interface), the two techniques provide complementary information. To extract physical parameters such as thicknesses and refractive indices from a spectrum, one must model the data (29,30). Therefore, we analyzed the XR and NR data as described below.
Because of the high brilliance of the XR beam at the APS, high-quality XR data can be collected for qz-values up to 0.75 Å−1. The extended spectral range allows us to use a modeling approach (StochFit) developed at the University of Chicago, whereby a stochastic Monte Carlo algorithm is used to search through the solution space of all possible electron density profiles (30). See the Supporting Material for further details about the modeling approach.
In contrast to the XR data, our NR data extend only to qz = 0.12 Å−1. Because StochFit is not well equipped to handle data with such a low spectral range, we use a well-validated kinematical approach instead (29,30). The SLD , which is laterally averaged over both the ordered and disordered parts in the footprint of the beam, can be modeled by a stack of homogeneous slabs (or boxes), each with a constant SLD and thickness. The interfaces between boxes are smoothed with a Gaussian function of standard deviation σ to account for roughness at the boundary due to thermally excited capillary waves and the atomic roughness of the interface.
We improve the reliability of our modeling by using the model-independent XR analysis described above to further constrain the parameter space over which the Parratt recursion and subsequent minimization are done within the framework of Motofit (31). Using information gleaned from XR to guide the analysis of NR data is justifiable because, thanks to its ability to obtain data up to very high qz, XR can provide more detailed information about the interfacial profile. This methodology allows us to co-refine the two sets of data together and provide better confidence in our results. In particular, the lengths of the tail and headgroup boxes extracted from StochFit electron density profiles are used as a starting point in modeling the neutron data for both DPPC-d62 and DPPC-d75. See Supporting Material for further details.
We used standard calculation to calculate the XR and neutron SLDs of our pure subphase components. Mixture SLDs () can be calculated as a weighted sum of the SLDs of pure components (), with weighting factors defined as the ratios of the partial mass density () of a component in the mixture divided by the natural density () of that component: . See Supporting Material for further details.
We carried out GID experiments to obtain in-plane electron density distribution information about the samples. The GID intensity resulting from a powder of 2D crystallites can be represented by its projection onto the qxy axis to yield Bragg peaks, or onto the qz axis to yield Bragg rods (where qxy and qz are the horizontal and vertical components of the scattering vector q, respectively (32)). The horizontal positions of the Bragg peaks (qxy) allow us to determine the spacings for the 2D lattice of the alkyl chains. The width of Bragg peaks, corrected for the instrumental resolution, gives the finite size of the crystalline domains in the direction of the reciprocal scattering vector qxy (the 2D crystalline coherence length L).
Results
Effect of glycerol on lipid monolayer folding
When the locally flat LS membrane is highly compressed (as upon the end of exhalation), it moves out of the interfacial plane into deep folds (1–4). We study the folding of model LS monolayers composed of DPPC and POPG in a 7:3 molar ratio at 25°C on water and glycerol mixtures (see Movie S1 and Movie S2). By tracking surface displacement fields of a monolayer undergoing folding, we measure the distribution of fold amplitudes as a function of glycerol content and time. On pure water, and in agreement with Gopal et al. (28), fold amplitudes for the model LS system span from , with the most probable size being , followed by an anomalously broad decay in probability for larger amplitudes (Figs. 1 A and 2 A). On a subphase containing 40 wt % glycerol, the most probable fold amplitude remains ; however, the probability distribution has an even broader tail spanning into the very-high-amplitude region. As shown in Figs. 1 B and 2 A, fold amplitudes several orders of magnitude larger than those seen on water are observed on glycerol mixtures. The duration of each fold τ (also termed fold on-time in Gopal et al. (28)) is plotted in Fig. 1, C and D. The majority of folds occur on a timescale of ; however, on glycerol, the largest folds extend to longer on-times.
Figure 1.
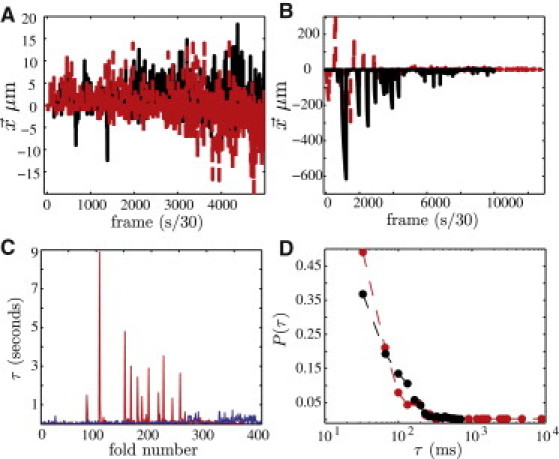
Displacement field seismogram for fold formation on (A) pure water subphase and (B) 40 wt % glycerol subphase (red/dashed and black/solid indicate two separate monolayers). The y axis is the amount of material displaced in the direction parallel to compression () during a given folding event. On the x axis is a running time log with zero corresponding to the first folding during collapse. Panels C and D show the duration of each folding event (τ) and the corresponding probability distributions (). The most probable folds on water (black/darker) and 40 wt % glycerol (red/lighter) occur with a characteristic on-time of .
Figure 2.

(A) Distribution of folding events represented in Fig. 1 for water (black diamonds) and 40 wt % glycerol (red circles) subphases. The largest number of events (N) occur for m, where the data for water and glycerol overlap rather well. Beyond this point, the number of folding events on water decays to zero with no events recorded for m, whereas on the glycerol subphase large amplitude events continue to occur. Inverting the fold scaling law (3), as shown in the upper corner of panel A, we derive the distribution of membrane bending stiffnesses, as plotted in B. The most probable bending stiffness in both systems is ; however, as shown in the inset in B, on glycerol (red/dashed curve) the distribution tail extends into higher-magnitude values.
Lastly, changes in fold size distribution as a function of compression are seen only on subphases containing glycerol (see Fig. S1). Monolayers on water fold rather homogeneously throughout, as evidenced by the even distribution of events in Fig. 1 A (again, this is consistent with data for this monolayer presented by Gopal et al. (28)). However, on glycerol, very-high-amplitude folds tend to occur at the beginning of collapse, i.e., when monolayer compression first reaches collapse surface pressures. As shown in Fig. 1 B and Fig. S1, once half the monolayer has collapsed, the folding behaviors on glycerol and water become nearly identical.
In previous work we showed that the monolayer fold amplitude (ℓ) is proportional to the ratio between the elastic bending stiffness (B) of the lipids and the gravitational weight of the subphase fluid: , with a proportionality coefficient (3,4). Because the equation clearly relates fold amplitudes to the mechanical properties of the system, data in Fig. 2 B demonstrate that a lipid monolayer can be orders of magnitude stiffer with glycerol present in the subphase than on water alone. To understand the origin of this dramatic mechanical change, we probe the interactions between the surfactant lipids and the water/glycerol subphase at the molecular level.
Effect of glycerol on lipid monolayer isotherms
Fig. 3 A shows a set of 14 DPPC isotherms taken at 25°C on subphases with increasing amounts of glycerol. These measurements focus on changes in the lift-off areas with glycerol content. The area per molecule where surface pressure is first generated (called lift-off) corresponds to the minimal surface density at which lipid molecules begin to interact (2). The rightward shift of lift-off in Fig. 3 A with increasing subphase glycerol indicates that the lipids begin to interact at increasingly lower surface densities. At such low densities, the largest contribution to the lipid-lipid interaction comes from the subphase-embedded headgroups, which include the hydrophilic part of the lipid molecule and any associated solvation shell. Assuming ideal surface mixing of the subphase components, the lift-off area on mixed subphases (a) is a linear combination of the lift-off areas on the two pure subphases (aglyc and ): , where θ is the mole fraction of glycerol in the solvation shell. Using our measured θ and the known mole fraction of glycerol in the bulk subphase (x), we constructed the adsorption isotherm for glycerol to a DPPC monolayer shown in Fig. 3 B. Its convex shape indicates that glycerol is enriched in the DPPC solvation shell compared with its bulk concentration. Fitting to the Gibbs equation gives an equilibrium partition constant of 2.8 and an adsorption free energy of −2.5 kJ/mol (2.5 kB T/molecule at 25°C). Also plotted is the surface excess isotherm ( versus x), which shows that the largest concentration difference between solvation and bulk glycerol exists at x = 0.3 or 70 wt % glycerol. At higher compression, as the interaction between molecules becomes dominated by hydrocarbon tail-tail interactions, the large difference in Langmuir isotherms seen above diminishes. To probe the structure of the glycerol-enriched solvation shells at higher lipid surface densities, we performed XR and NR experiments.
Figure 3.
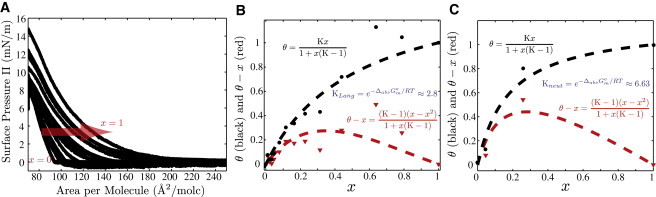
(A) DPPC isotherms on increasing amounts of glycerol from 0 wt % (mole fraction ), including 5, 10, 15, 20, 30, 40, 50, 60, 70, 80, 90, 95, and 100 wt % (x = 1), with isotherms shifting to the right and lift-off occurring at greater areas per molecule. (B) Adsorption isotherms based on the Π-A isotherms in (A). θ is the mole fraction of glycerol at the surface, and is the amount of excess glycerol at the surface. Points on the adsorption isotherm are generated using the lift-off area per molecule (measured when Π = 0.5 mN/m) and an ideal surface mixing model. The adsorption isotherm shows that an excess amount of glycerol is present on the surface. The equilibrium constants for the adsorption of glycerol to the interface (K) are measured by fitting the data to a Gibbs adsorption isotherm (black/upper curve) and excess adsorption isotherm (red/lower). (C) Adsorption isotherms constructed from NR data for DPPC-d62 and DPPC-d75. The SLD of the boundary layer from the best-fit profiles is used to back-calculate the mole fraction of glycerol (θ) and D2O () in the layer. The points at x = 1 are not measured, but are assumed based on conservation of mass. The data are fit to Gibbs adsorption isotherms (black/upper formula) and the excess adsorption isotherm (red/lower).
XR and NR
Fig. 4 shows specular XR data for DPPC/POPG 7:3 at 30 mN/m at 25°C on four different subphases (water with 0, 20, 40, and 64 wt % glycerol). The XR spectra show a global shifting of the reflectivity fringes to lower values of the wave-vector transfer in the z direction, qz, upon addition of glycerol into the subphase. Generally, such a shift indicates an increase in the thickness of the interface (29). The electron SLD profiles that give the best fits to the measured reflectivities are shown in Fig. 4 B. The densities of the lipid tails and headgroups are rather similar under all four subphase conditions, indicating that glycerol does not penetrate into the headgroup or tail regions. On the pure water subphase, the electron-dense phosphate headgroup region decays smoothly to the lower electron density water subphase. However, in the presence of glycerol, there is an ∼10 Å region, around z = 75 Å, of elevated density between the headgroup and the subphase (see inset of Fig. 4 B). With an increase in the fraction of glycerol, this region becomes more pronounced and develops into a third layer separating the lipid headgroups from the bulk subphase. Because the electron SLD of glycerol (11.36 × 10⁻⁶ Å−2) is higher than that of water (9.37 × 10⁻⁶ Å−2), our data suggest that this layer is enriched in glycerol. The existence of this layer and its composition can be better determined from NR experiments performed on fully deuterated DPPC-d75 monolayers with a subphase containing D2O and hydrogenated glycerol.
Figure 4.
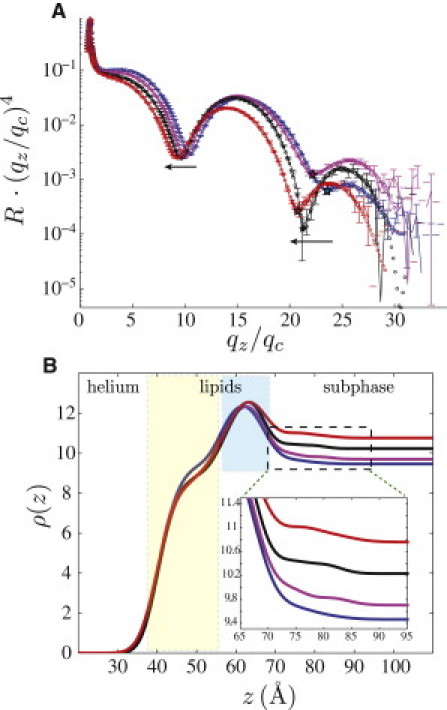
(A) XR spectra for DPPC/POPG 7:3 on water (blue, right-most curve at qz/qc =10) and 20 wt % (magenta, second from right), 40 wt % (black, second from left), and 64 wt % (red, left-most curve) glycerol. The x axis qz is normalized by the critical qc calculated for each subphase mixture. The y axis is the reflectivity intensity multiplied by . The arrows indicate the overall shift of the spectra to lower q-values upon addition of glycerol. (B) XR SLD of the best fits to the data in A generated via StochFit. Yellow region: lipid tails (centered at z ∼ 48); blue region: headgroups (centered at z ∼ 62); boxed region (centered at z ∼ 80): subphase adjacent to the monolayer. The most notable difference in the profiles for the four subphase conditions occurs in a boundary layer region extending 10 Å beneath the headgroups. As the inset in B shows, on water (bottom curve) there is a smooth connection between the electron-rich phosphate headgroup layer and the bulk subphase. However, with increasing amounts of glycerol, a more electron-dense third layer appears (from bottom to top: water, 20 wt %, 40 wt %, and 64 wt % glycerol).
Fig. 5 shows NR data for such systems on subphases containing D2O with 0, 20, and 64 wt % glycerol. Because neutron SLDs are highly sensitive to isotopic composition, we can distinguish the relative amounts of the two subphase components within the glycerol-enriched layer. The best-fit model on the D2O subphase does not require the existence of an intermediate layer between the headgroups and the subphase. However, as glycerol is added, a layer with low SLD becomes necessary to fit the data. Previous data showed minimal H/D exchange between glycerol and D2O (33); therefore, the low SLD of this layer can be explained by enrichment in hydrogenated glycerol. By inverting the mixture density equation (see Materials and Methods), we can determine the amount of glycerol and D2O in the enrichment layer. On both 20 wt % (x = 0.05) and 64 wt % (x = 0.25) glycerol, the enrichment layer contains three times more glycerol ( and 0.8) as compared with that in the bulk subphase.
Figure 5.

NR data for DPPC-d75 at Π = 30 mN/m (25°C) on (A) pure D2O subphase, (C) 20 wt % glycerol/D2O, and (E) 64 wt % glycerol/D2O. (B, D, and F) SLD profiles calculated using a three-box model with the Parratt method. The best-fit models (solid red/bold in the profiles) give rise to the solid black model reflectivities. The dashed profiles are for boundary layers whose composition is identical to that of the bulk subphase. In C and D, the ratio of χ2-values of the dashed model to the best fit is 1.23, and similarly for E and F, it is 16.6. See “Neutron Reflectivity Data” in the Supporting Material for all values.
A second set of data collected using DPPC molecules with only the alkyl tails deuterated (DPPC-d62) is shown in Fig. S2, and the same trend is observed. In the case of a DPPC-d62 monolayer measured on a pure D2O subphase, no intermediate layer between the headgroups and the subphase is required, but such a layer is necessary for subphases containing glycerol. It is important to note that the best fits were obtained only when the headgroup of DPPC-d62 contained two to three D2O molecules. Using the mole fraction of glycerol in the bulk subphase and our NR results, we can generate a glycerol adsorption isotherm similar to that carried out for the low lipid densities described above (see Fig. 3 C). Hence, our NR results unequivocally show the presence of a thermodynamically stable, glycerol-enriched layer extending 10 Å below the headgroups with an equilibrium constant of 6.6. Correspondingly, the adsorption free energy for glycerol is found to be −4.6 kJ/mol.
GID-probed glycerol-induced ordering
Fig. 6 shows pinhole GID spectra for DPPC/POPG 7:3 as a function of temperature and subphase composition. At 25°C, the monolayer has in-plane crystalline order on both a water subphase and 64 wt % glycerol. Upon heating to 37°C, no crystalline order remains in the monolayer on water, as indicated by the lack of a Bragg peak. However, crystallinity is retained on the glycerol solution. Given only one Bragg peak, a hexagonal packing geometry is assumed, and the following relations can be used to determine the d-spacing d, unit cell length a, and unit cell area A: , , and . The average size of the crystalline grains (L) is obtained by inverting the full width at half-maximum of the Bragg peaks: . See Fig. 6 C for the respective values in our systems.
Figure 6.

Pinhole (GID) spectra for DPPC/POPG 7:3 (Π = 30 mN/m) on (A) water and (B) 64 wt % glycerol at 25°C and 37°C. The presence of a Bragg peak for both subphases at the lower temperature (red; upper in A and right in B) indicates that in-plane crystalline order exists within the monolayer at both conditions. At 37°C (blue; lower in A and left in B), the monolayer on water melts, losing its Bragg peak whereas the monolayer on the glycerol mixture retains its signature of crystalline order. (C) Table of peak parameters outlined in the text.
Discussion
Glycerol adlayer
Our isotherm data show a rightward shift in the lift-off area for DPPC on glycerol solutions. This is in agreement with much earlier isotherm-based studies of glycerol solutions (15,18). The conventional interpretation of such isotherm shifts is that glycerol exerts a fluidizing effect on the lipid monolayer, because of their similarity to isotherm scaling with increasing temperature. In light of the condensing and stiffening effects we observe at higher packing densities, we propose an alternative to this fluidizing model. By allowing for free diffusion of glycerol or water molecules into and out of the solvation shell, the rightward isotherm shifts with increasing glycerol can be accounted for by the increasing size of the solvation shell as bulkier glycerol molecules are incorporated. Moreover, the nonlinear shift in lift-off area with glycerol concentration is explained by a preferential enrichment of glycerol in the solvation shell even at low surface densities, which provides thermodynamic evidence () for the earlier hypothesis that carbohydrates may compete with and replace water in the lipid headgroup region by hydrogen bonding with its polar moieties (18). In more-recent monolayer work with DPPC on fructose and sucrose, Krasteva et al. (34,35) used a 2D Clausius-Clapeyron equation to show that the presence of subphase carbohydrates leads to the formation of up to six additional hydrogen bonds per lipid molecule. Their interpretation, based on the change in latent heat for the liquid-expanded to condensed phase transition as a function of subphase composition, is that carbohydrate molecules bind to the hydration shell of DPPC but do not actually displace water from the headgroup. Our NR data support the idea that the hydration shell retains two to three water molecules per lipid headgroup (as on a pure water subphase) despite high subphase concentrations of carbohydrate.
The XR and NR data show that at packing densities well into the lipid condensed phase, the lipid/subphase interface on glycerol-containing subphases remains substantially different from that on pure water, with an ∼10 Å adlayer enriched in glycerol (). The thermodynamic driving force for such demixing is the surface energy difference between water and glycerol: , where μ is the chemical potential of each species in the bulk and at the surface (s superscript) (36,37). This surface energy reduces to the difference in the surface tension of the two subphase components. When this difference is mN/m, a binary liquid is considered to exist in the strong field regime with saturation of the lower surface tension component at the surface (37). Fisher and de Gennes (36) were the first to consider how such concentration gradients would change as one moved away from the surface, and proposed the algebraic scaling law , where z is the distance from the surface and ξ is the bulk correlation length of the binary mixture. Taking ξ as the cube root of the glycerol molecular volume (Å), the predicted surface concentration should approach that of the bulk within 10–15 Å, in agreement with our measurements.
At low lipid densities, the surface field driving demixing and glycerol enrichment has contributions from glycerol-air, water-air, glycerol-lipid, water-lipid, and glycerol-water interactions. Without lipids at the interface, the surface field is approximately the difference in pure water-air and glycerol-air surface tensions, which, at 25°C, comes to 8 mN/m, placing a water-glycerol solution in contact with air into the strong field regime. In spectroscopic work on pure glycerol-water/air interfaces, Baldelli et al. (38) showed an enrichment of glycerol at the interface. Moreover, they obtained a glycerol surface excess free energy of –1.5–3.5 kJ/mol, in agreement with our isotherm-derived adsorption free energy at low lipid densities (38). The question of whether the dominant surface field contributions are from glycerol-air or glycerol-lipid interactions becomes irrelevant at higher lipid densities because the hydrophobic lipid tails screen any subphase liquid/air contact. A parsing of the molecular contributions to the surface tension in a lipid-covered interface becomes exceedingly complex. However, molecular-dynamics simulations by Sum et al. (39) of DPPC bilayers in the presence of trehalose and sucrose showed sugar enrichment near the headgroups and strong hydrogen bonding between sugar hydroxyls and the lipid phosphate. These simulations are in qualitative agreement with the above-mentioned thermodynamic data of Krasteva et al. (34,35). Structurally, glycerol, like the disaccharides, has a carbon backbone enriched in hydroxyl groups that are capable of hydrogen bonding, which makes it possible for our experimentally observed water/glycerol demixing to be driven by the energetics of glycerol/phosphate hydrogen bonding.
Lastly, our diffraction data show small but significant changes in lattice packing for model LS lipids at 25°C, with the unit cell area A decreasing by 2.6% on glycerol compared with water. The unit cell area is a very local measure of lipid hydrocarbon tail density, which glycerol increases. Because no glycerol penetrates into the tail region, as is clearly demonstrated by our NR data, this increase in density must be exerted by the adlayer through its interaction with the lipid headgroups. At 37°C, the monolayer on water melts completely with no local crystalline ordering, the glycerol adlayer prevents this melting, and the local density remains 1.6% greater than on water at 25°C. The adlayer increases not only the local densities but also the long-range ordering of the lipid tails, as signified by the average size of crystalline grains on the surface. is more than double , indicating that the glycerol adlayer significantly increases the long-range ordering of surface tail groups; again, this effect must be transferred from the adlayer/headgroup region to the hydrocarbon tails.
In their molecular-dynamics study, Sum et al. (39) showed that not only do trehalose and sucrose partition into an adlayer adjacent to DPPC bilayers, the dynamics of the lipid molecules is slowed down. In particular, the normal motion of the headgroup phosphorous atom is significantly reduced in the presence of carbohydrates. This effective lipid cooling in the presence of the adlayer is strongly supported by the trends seen in our diffraction data.
Lipid monolayer mechanics
We now turn to understanding how the adsorption layer alters the lipid monolayer's mechanical response. As shown in Fig. 2 A, on both water and glycerol the fold size distributions are broad and nearly overlapping, with the notable exception that monolayers on glycerol show a broader extension into higher-amplitude folds. These higher-amplitude folds, which are not present on water, also differ from their lower-amplitude counterparts on glycerol in that they occur only early on in the collapse plateau. The surface perturbation that leads to the large folds is thus sensitive to continued folding, indicating that whatever leads to the larger folds is eventually disrupted by monolayer translation along the surface.
The broad distribution of fold sizes even on water has received only limited attention in the literature. However, Gopal et al. (28) noted that the particular statistics of folding can be explained by a cascade of folds whereby one fold topples another. In this model, the distribution peak at represents a single folding event, and the distribution broadens as multiple events occur simultaneously. The wrinkle-to-fold model () is the only physical model in which fold size can be linked to material parameters in the system (3,4,9). Within this model, the fold size distribution can arise if the assumption of monolayer homogeneity is relaxed, thereby allowing for multiple values of B in the same monolayer. Physically, given that lipid monolayers are self-assembled, glass-like materials, it is justifiable to assume a degree of elastic constant heterogeneity.
Working within the wrinkle-to-fold model, we now seek to explain the difference in B-values seen with water and glycerol (see Fig. 2 B). As a membrane folds, the principal forces generated are bending moments arising from the variation of stress across the membrane: , where the integration of the in-plane stress tensor σxx is carried out across the membrane thickness t (40–43). Treating the lipid monolayer as an incompressible elastic solid () and the glycerol adlayer as an incompressible Newtonian fluid (), the corresponding bending moments are and , where κ is curvature, uxx are in-plane strains, E is the lipid monolayer Young's modulus, η is glycerol viscosity within the adlayer, and τ is the characteristic timescale over which the fold forms (see Fig. 1, C and D). By definition, the lipid bending stiffness is and the effective bending stiffness of the adlayer is . Assuming the bending stiffness that enters the fold scaling law is to first order , we now discuss two models that consider the interfacial physics that influences the cohesion of the lipids and glycerol.
Vitrified glycerol adlayer
The first model focuses directly on the mechanics of the adlayer. Using our measured adlayer thickness of 10 Å and from the fold analysis (see Fig. 1, C and D), we can see that Badlayer approaches 1000 kT only if its viscosity diverges to 1010 Pa·s, which is equivalent to its vitrification (46). The glass transition temperature (Tg) of bulk glycerol is −80°C (46); however, when glycerol is confined in thin layers, its Tg can increase (47,48). Previous work with glycerol in nanoporous silica showed that increases in glycerol Tg in such geometries are a function of strong hydrogen bonding between the glycerol hydroxyls and those of the silica surface (47,48). The dynamically supercooled interfacial layer was shown to extend on the order of 10 Å from the silica surface (47,48). Moreover, Sum et al. (39) also noted in their simulations substantially lower diffusion coefficients of carbohydrates in the adlayer compared with bulk solutions. In the light of this literature, it is plausible to consider that the large folds seen with LS on glycerol solutions are due to the glassy nature of the adsorbed glycerol owing to its strong hydrogen bonding with the phosphate headgroups. In this case, the distribution of fold sizes can be accounted for by possible spatial fluctuations in adlayer viscosity and adsorption.
Antiplasticized lipids
The second model focuses on how glycerol in the adlayer might change the material properties of the lipids. Any variation in the bending stiffness of the lipids should come from variation in the monolayer Young's modulus, given that the thickness of the layer is rather uniform, as shown by reflectivity data. Qualitatively, thermodynamics relates E to density via derivatives of the equation of state for a given system. Because surface pressure measurements break down in highly condensed monolayers (4,44), it is difficult to determine experimental equations of state for our monolayers near collapse. However, our GID data show that glycerol increased the local hydrocarbon tail density of the monolayer by 2.6%. Borrowing from the polymer literature, small-molecule additives that increase the density of the bulk material are termed antiplasticizers (45). In a recent simulation study, Riggleman et al. (45) examined how a ∼2.5% increase in polymer density via addition of an antiplasticizer affected the local spatial distribution of elastic moduli in the glass. Of interest, they found that in the antiplasticized case, the distribution of local elastic moduli was nearly identical to the pure polymer system except for a longer tail toward higher moduli values. This is qualitatively very similar to the change in P(B) with the addition of glycerol (see inset in Fig. 2 B). The intriguing conclusion we can draw from this is that the glycerol adlayer may behave as a lipid antiplasticizer. To enable more-quantitative predictions allowing for the calculation of , a simulation study with lipids and glycerol, much like that performed for polymers, would be of great value and interest.
The above two models focus on how Blipid and Badlayer independently change in the presence of glycerol. However, in the actual system, it is likely that some combination of both effects plays a role, i.e., the glycerol adlayer itself could support mechanical stresses on the timescales of folding while also changing the material properties of the lipids. Our conclusion that the glycerol adlayer must play a dominant role in changing lipid folding is supported by the temporal distribution of large folds at the beginning of the collapse regime and the return of water-like folding by the end. If purely bulk effects of the glycerol/water solution were at play, we would expect a homogeneous perturbation with large folds evenly distributed throughout the folding regime, because it is unlikely that a nanometer-sized system would significantly affect the bulk properties of the deep subphase. The return to water-like behavior at the tail end of folding on glycerol solutions may point to disruption of the adlayer through persistent viscous shearing parallel to the interface, caused by translation of the monolayer surface as folds form.
We now return to the role of small carbohydrates in biological systems. Although we have focused here on the simplest of these carbohydrates, glycerol, the similarity of our structural data with simulations (39) and preliminary experiments in our laboratory with sucrose and glucose showing similar behavior allow us to conclude that most small, strongly hydrogen-bonding molecules should follow the trends presented in this work. Given the dramatic impact carbohydrates can have on the mechanical stability of LS, it is possible that nature's purpose in keeping glucose concentrations low in the ALF is to prevent the large-scale folds described here. Such large-scale folds could potentially lead to a very rapid depletion of surfactant from the alveolar interface, leading to increased work of breathing. Lipid membrane mechanics, cell mechanics, and mechanical stresses that affect cell differentiation and signaling are all evolving, if not exploding, fields of study. In this work, we add viscous adlayers to the array of physical tools, such as composition, pressure, and temperature, that nature has at its disposal to shape the structure and mechanics of lipid membranes.
Acknowledgments
We thank Jack F. Douglas for introducing us to the antiplasticization polymer literature and providing insight into possible similarities between our system and that fascinating field. We also thank T. A. Witten, K. F. Freed, H. Frauenfelder, H. Diamant, and S. Danauskas for fruitful discussions, and Eugene Gavrilov for help with the fold-tracking program.
This work was supported in part by the UChicago MRSEC program of the NSF (DMR-0820054) and the US-Israel Binational Foundation (2006076). LP thanks the UChicago MSTP for support (NIGMS/MSNRSA 5T32GM07281). KYCL is grateful for support from March of Dimes (No. 6-FY07-357) and NSF (MCB-0920316). KG acknowledges of the NIH Roadmap Training Program (T90 DK070076) and James Franck Institute Undergraduate Research. ChemMatCARS is principally supported by the National Science Foundation/Department of Energy under Grant No. CHE0087817. The APS is supported by the U.S. Department of Energy, Basic Energy Sciences, Office of Science under contract No. W-31-109-Eng-38. This work benefited from the use of the Lujan Neutron Scattering Center at LANSCE funded by the DOE Office of Basic Energy Sciences and Los Alamos National Laboratory under DOE Contract DE-AC52-06NA25396.
Supporting Material
References
- 1.Zasadzinski J.A., Ding J., Waring A.J. The physics and physiology of lung surfactant. Curr. Opin. Colloid Interface Sci. 2001;6:506–513. [Google Scholar]
- 2.Gopal A., Lee K.Y.C. Morphology and collapse transitions in binary phospholipid monolayers. J. Phys. Chem. B. 2001;105:10348–10354. [Google Scholar]
- 3.Pocivavsek L., Dellsy R., Cerda E. Stress and fold localization in thin elastic membranes. Science. 2008;320:912–916. doi: 10.1126/science.1154069. [DOI] [PubMed] [Google Scholar]
- 4.Pocivavsek L., Frey S.L., Lee K.Y. Lateral stress relaxation and collapse in lipid monolayers. Soft Matter. 2008;4:2019–2029. doi: 10.1039/b804611e. [DOI] [PMC free article] [PubMed] [Google Scholar]
- 5.Lipp M.M., Lee K.Y.C., Waring A.J. Coexistence of buckled and flat monolayers. Phys. Rev. Lett. 1998;81:1650–1653. [Google Scholar]
- 6.Piknova B., Schram V., Hall S.B. Pulmonary surfactant: phase behavior and function. Curr. Opin. Struct. Biol. 2002;12:487–494. doi: 10.1016/s0959-440x(02)00352-4. [DOI] [PubMed] [Google Scholar]
- 7.Robertson B., Halliday H.L. Principles of surfactant replacement. Biochim. Biophys. Acta. 1998;1408:346–361. doi: 10.1016/s0925-4439(98)00080-5. [DOI] [PubMed] [Google Scholar]
- 8.Alonso C., Alig T., Zasadzinski J.A. More than a monolayer: relating lung surfactant structure and mechanics to composition. Biophys. J. 2004;87:4188–4202. doi: 10.1529/biophysj.104.051201. [DOI] [PMC free article] [PubMed] [Google Scholar]
- 9.Leahy B.D., Pocivavsek L., Lin B. Geometric stability and elastic response of a supported nanoparticle film. Phys. Rev. Lett. 2010;105:058301. doi: 10.1103/PhysRevLett.105.058301. [DOI] [PubMed] [Google Scholar]
- 10.Bringezu F., Pinkerton K.E., Zasadzinski J.A. Environmental tobacco smoke effects on the primary lipids of lung surfactant. Langmuir. 2002;19:2900–2907. [Google Scholar]
- 11.Stenger P.C., Alonso C., Pinkerton K.E. Environmental tobacco smoke effects on lung surfactant film organization. Biochim. Biophys. Acta. 2009;1788:358–370. doi: 10.1016/j.bbamem.2008.11.021. [DOI] [PMC free article] [PubMed] [Google Scholar]
- 12.Stenger P.C., Zasadzinski J.A. Enhanced surfactant adsorption via polymer depletion forces: a simple model for reversing surfactant inhibition in acute respiratory distress syndrome. Biophys. J. 2007;92:3–9. doi: 10.1529/biophysj.106.091157. [DOI] [PMC free article] [PubMed] [Google Scholar]
- 13.Alig T.F., Warriner H.E., Zasadzinski J.A. Electrostatic barrier to recovery of dipalmitoylphosphatidylglycerol monolayers after collapse. Biophys. J. 2004;86:897–904. doi: 10.1016/S0006-3495(04)74165-X. [DOI] [PMC free article] [PubMed] [Google Scholar]
- 14.Zasadzinski J.A., Alig T.F., Taeusch H.W. Inhibition of pulmonary surfactant adsorption by serum and the mechanisms of reversal by hydrophilic polymers: theory. Biophys. J. 2005;89:1621–1629. doi: 10.1529/biophysj.105.062646. [DOI] [PMC free article] [PubMed] [Google Scholar]
- 15.Cadenhead D.A., Bean K.E. Selected lipid monolayers on aqueous-glycerol and aqueous-urea substrates. Biochim. Biophys. Acta. 1972;290:43–50. doi: 10.1016/0005-2736(72)90050-8. [DOI] [PubMed] [Google Scholar]
- 16.Crowe J.H., Whittam M.A., Crowe L.M. Interactions of phospholipid monolayers with carbohydrates. Biochim. Biophys. Acta. 1984;769:151–159. doi: 10.1016/0005-2736(84)90018-x. [DOI] [PubMed] [Google Scholar]
- 17.Crowe J.H., Crowe L.M., Chapman D. Preservation of membranes in anhydrobiotic organisms: the role of trehalose. Science. 1984;223:701–703. doi: 10.1126/science.223.4637.701. [DOI] [PubMed] [Google Scholar]
- 18.Bianco I.D., Fidelio G.D., Maggio B. Effect of glycerol on the molecular properties of cerebrosides, sulphatides and gangliosides in monolayers. Biochem. J. 1988;251:613–616. doi: 10.1042/bj2510613. [DOI] [PMC free article] [PubMed] [Google Scholar]
- 19.de Prost N., Saumon G. Glucose transport in the lung and its role in liquid movement. Respir. Physiol. Neurobiol. 2007;159:331–337. doi: 10.1016/j.resp.2007.02.014. [DOI] [PubMed] [Google Scholar]
- 20.Saumon G., Martet G. Effect of changes in paracellular permeability on airspace liquid clearance: role of glucose transport. Am. J. Physiol. 1996;270:L191–L198. doi: 10.1152/ajplung.1996.270.2.L191. [DOI] [PubMed] [Google Scholar]
- 21.Foster D.J., Ravikumar P., Hsia C.C. Fatty diabetic lung: altered alveolar structure and surfactant protein expression. Am. J. Physiol. Lung Cell. Mol. Physiol. 2010;298:L392–L403. doi: 10.1152/ajplung.00041.2009. [DOI] [PMC free article] [PubMed] [Google Scholar]
- 22.Inselman L.S., Chander A., Spitzer A.R. Diminished lung compliance and elevated surfactant lipids and proteins in nutritionally obese young rats. Lung. 2004;182:101–117. doi: 10.1007/s00408-003-1048-4. [DOI] [PubMed] [Google Scholar]
- 23.Lin B., Schultz D., Viccaro P. Langmuir monolayers of gold nanoparticles. Thin Solid Films. 2007;515:5669–5673. [Google Scholar]
- 24.Schultz D.G., Lin X.M., Lin B. Structure, wrinkling, and reversibility of Langmuir monolayers of gold nanoparticles. J. Phys. Chem. B. 2006;110:24522–24529. doi: 10.1021/jp063820s. [DOI] [PubMed] [Google Scholar]
- 25.Majewski J., Kuhl T.L., Smith G.S. Structure of phospholipid monolayers containing poly(ethylene glycol) lipids at the air-water interface. J. Phys. Chem. B. 2009;101:3122–3129. [Google Scholar]
- 26.Lin B., Meron M., Viccaro P.J. The liquid surface/interface spectrometer at ChemMatCARS synchrotron facility at the Advanced Photon Source. Physica B Condens. Matter. 2003;336:75–80. [Google Scholar]
- 27.Meron M., Gebhardt J., Brewer H., Viccaro J.P., Lin B. Following transient phases at the air/water interface. Eur. Phys. J. Spec. Top. 2009;167:137–142. [Google Scholar]
- 28.Gopal A., Belyi V.A., Lee K.Y. Microscopic folds and macroscopic jerks in compressed lipid monolayers. J. Phys. Chem. B. 2006;110:10220–10223. doi: 10.1021/jp0618983. [DOI] [PubMed] [Google Scholar]
- 29.Als-Nielsen J., McMorrow D. John Wiley & Sons; New York: 2001. Elements of Modern X-Ray Physics. [Google Scholar]
- 30.Danauskas S., Li D., Lee K.Y.C. Stochastic fitting of specular X-ray reflectivity data. J. Appl. Cryst. 2008;41:1187–1193. [Google Scholar]
- 31.Nelson A. Co-refinement of multiple contrast neutron / X-ray reflectivity data using MOTOFIT. J. Appl. Crystallogr. 2006;39:273–276. [Google Scholar]
- 32.Als-Nielsen J., Jacquemain D., Leiserowitz L. Principles and applications of grazing incidence X-ray and neutron scattering from ordered molecular monolayers at the air-water interface. Phys. Rep. 1994;246:252–513. [Google Scholar]
- 33.Mudalige A., Pemberton J.E. Raman spectroscopy of glycerol/D2O solutions. Vib. Spectrosc. 2007;45:27–35. [Google Scholar]
- 34.Krasteva N., Vollhardt D. Morphology and phase behavior of monoglyceride monolayers on aqueous sugar substrates. Colloids Surf. A Physicochem. Eng. Asp. 2000;171:49–57. [Google Scholar]
- 35.Krasteva N., Vollhardt D., Mohwald H. Effect of sugars and dimethyl sulfoxide on the structure and phase behavior of DPPC monolayers. Langmuir. 2001;17:1209–1214. [Google Scholar]
- 36.Fisher M.E., de Gennes P.G. Phenomenes aux parois dans un melange binaire critique. C. R. Acad. Sci. Paris. 1978;287:207–209. [Google Scholar]
- 37.Cho J.H.J., Law B.M., Gray K. Strong critical adsorption at the liquid-vapor surface of a non-polar mixture. J. Chem. Phys. 2002;116:3058–3062. [Google Scholar]
- 38.Baldelli S., Schnitzer C., Shultz M.J. Sum frequency generation investigation of glycerol/water surfaces. J. Phys. Chem. B. 1997;101:4607–4612. [Google Scholar]
- 39.Sum A.K., Faller R., de Pablo J.J. Molecular simulation study of phospholipid bilayers and insights of the interactions with disaccharides. Biophys. J. 2003;85:2830–2844. doi: 10.1016/s0006-3495(03)74706-7. [DOI] [PMC free article] [PubMed] [Google Scholar]
- 40.da Silveira R., Chaieb S., Mahadevan L. Rippling instability of a collapsing bubble. Science. 2000;287:1468–1471. doi: 10.1126/science.287.5457.1468. [DOI] [PubMed] [Google Scholar]
- 41.Skorobogatiy M., Mahadevan L. Folding of viscous sheets and filaments. Europhys. Lett. 2000;287:1468–1471. [Google Scholar]
- 42.Buckmaster J.D., Nachman A., Ting L. The buckling and stretching of a viscida. J. Fluid Mech. 1975;69:1–20. [Google Scholar]
- 43.Boudaoud A., Chaïeb S. Singular thin viscous sheet. Phys. Rev. E. 2001;64:050601. doi: 10.1103/PhysRevE.64.050601. [DOI] [PubMed] [Google Scholar]
- 44.Witten T.A., Wang J., Lee K.Y. Wilhelmy plate artifacts in elastic monolayers. J. Chem. Phys. 2010;132:046102. doi: 10.1063/1.3298997. [DOI] [PubMed] [Google Scholar]
- 45.Riggleman R.A., Douglas J.F., de Pablo J.J. Antiplasticization and the elastic properties of glass-forming polymer liquids. Soft Matter. 2010;6:292–304. [Google Scholar]
- 46.Schroter K., Donth E. Viscosity and shear response at the dynamic glass transition of glycerol. J. Chem. Phys. 2000;113:9101–9108. [Google Scholar]
- 47.Trofymluk O., Levchenko A.A., Navrotsky A. Interfacial effects on vitrification of confined glass-forming liquids. J. Chem. Phys. 2005;123:194509. doi: 10.1063/1.2110155. [DOI] [PubMed] [Google Scholar]
- 48.Arndt M., Stannarius R., Kremer F. Dielectric investigations of the dynamic glass transition in nanopores. Phys. Rev. E. 1996;54:5377–5390. doi: 10.1103/physreve.54.5377. [DOI] [PubMed] [Google Scholar]
Associated Data
This section collects any data citations, data availability statements, or supplementary materials included in this article.