

Abstract
We perform a detailed investigation of the force × deformation curve in tether extraction from 3T3 cells by optical tweezers. Contrary to conventional wisdom about tethers extracted from cells, we find that actin filaments are present within them, so that a revised theory of tether pulling from cells is called for. We also measure steady and maximum tether force values significantly higher than previously published ones for 3T3 cells. Possible explanations for these differences are investigated. Further experimental support of the theory of force barriers for membrane tube extension is obtained. The potential of studies on tether pulling force × deformation for retrieving information on membrane-cytoskeleton interaction is emphasized.
Introduction
Nanotubular membrane formations are ubiquitous in cells, both internally, as in the endoplasmic reticulum (1) and Golgi apparatus (2), and externally, in cellular protrusions such as filopodia (3) and intercellular nanotubes (4,5). They play a variety of roles (6), such as pathways for cargo transportation; environment probes; motility; cell-cell communication; and tracks for opportunistic pathogen invasion.
Spontaneously or artificially generated cell nanotubes, as well as artificial vesicles, have often been investigated to gather information about membrane elastic properties. In particular, this has been done by applying optical tweezer (OT) forces to extract tethers or to pull on existing nanotubes (7–9). The force is applied by attaching a trapped microsphere to the membrane, as a force transducer (Fig. 1).
Figure 1.
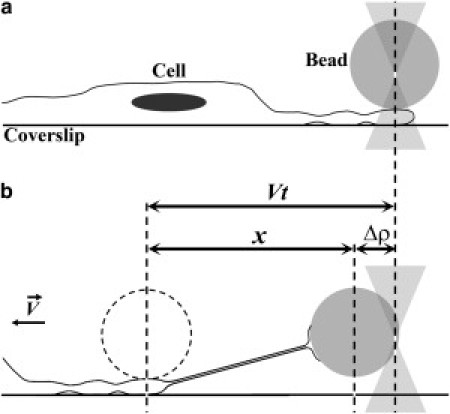
Schematic representation of the tether extraction experiment. (a) Initial equilibrium position. (b) Change in equilibrium position due to sample movement.
A typical force × deformation curve in tether extraction from cells by optical tweezers (see Fig. 2 d) shows a monotonically rising part, broken by a nearly discontinuous drop, followed by a plateau. Theories developed to describe this process are akin to the treatment of Plateau's problem in soap film formation, but cell membranes, unlike soap films, develop bending resistance. The cylindrical shape of membrane nanotubes results from a compromise between surface tension and bending rigidity. Existing theories (10,11) deal with the neighborhood of the pulling region as a passive elastic medium.
Figure 2.

Tether extraction experiment in Fibroblast NIH 3T3 cell. (a) Initial situation, t = 0. (b) Final situation, showing the image of the extracted tether in bright field with ImageJ shadow north processing filter applied. Scale bar for panels a and b is 10 μm. (c) Montage of images from the video recording (see Movie S1). (d) The force curve of the tether extraction experiment, with numbers in the plot indicating the corresponding bead position in panel c; scale bar 1 μm.
The discontinuous drop is interpreted as signaling the formation of the cylindrical nanotube, as a first-order shape transition. The plateau force, the tether radius, the membrane surface tension, and its bending rigidity are connected by relations that allow us to determine one of these parameters given the other three.
A proposed interpretation of the magnitude of the percentage drop (12) relates it with the ratio of the radius of the attachment patch of the microsphere to the membrane (acting as a force barrier to nanotube formation) to the radius of the cylindrical tether. In the limit of a point attachment, this relation has been experimentally verified by pulling on intercellular nanotubes (9).
In this work, we examine the process of tether extraction from 3T3 cells with optical tweezers, attempting to account for all aspects of the observed force × deformation curves. In contrast with prior observations (13), we find that the extracted tethers do contain actin filaments, and we measure significantly larger values for the tether forces. Possible sources of these discrepancies are experimentally investigated. We also determine the radius of the attachment patch of the microspheres to the cell to further test the force barrier effect. The results are in good agreement with the proposed model (12).
We emphasize the need of a dynamical model for the rising part of the force curve, taking into account the reaction of the cell. In this connection, detailed tether pulling studies can be a valuable source of information on membrane-cytoskeleton interaction. In the Conclusion, we also discuss possible mechanisms to account for F-actin presence in tethers pulled from cells.
Materials and Methods
Cell culture
Swiss mouse embryo fibroblast NIH 3T3 cell lineage (ATCC No. CRL-1658; American Type Culture Collection, Manassas, VA) was cultured in Dulbecco's modified Eagle's medium (DMEM-F12) containing L-glutamine, 10% fetal bovine serum, and 1% penicillin/streptomycin. All culture reagents were obtained from Invitrogen (Carlsbad, CA). Cells were maintained at 37°C and 5% CO2. For all the experiments, cells were harvested with phosphate-buffered saline (PBS)/EDTA 0.02%, and, on the day before the observations, 5 × 10⁴ cells were plated on an 18 × 18-mm glass coverslip placed within a special 35-mm glass-bottom culture dish.
Optical tweezers setup
The OT system used in all the experiments was the same one described previously and extensively tested with a view to absolute calibration (14,15). In summary, the system employs an infrared Nd:YAG laser with wavelength 1.064 μm (Quantronix, East Setauket, NY). The laser has a Gaussian intensity profile (TEM00 mode) with a maximum power of 3 W and a beam half-width of 2.3 ± 0.2 mm at the back focal-plane of the objective lens (15). The infrared laser system is attached to an inverted Eclipse TE300 microscope (Nikon, Melville, NY), equipped with a PLAN APO 60× 1.4 NA DIC H objective (Nikon), employed to create the optical trap.
Trap calibration
To calibrate the OT, an uncoated polystyrene bead with radius a = 1.52 ± 0.02 μm (Polysciences, Warrington, PA) was first captured and then the sample was set to move with velocity V. Images of the entire process were recorded with a model No. C2400 charge-coupled device camera (Hamamatsu, Hamamatsu City, Japan) and digitalized by a model No. FG7 frame grabber (Scion, Torrance, CA). The center-of-mass (CM) position of the trapped bead, ρ, was obtained by image analysis using the centroid-finding algorithm of the ImageJ software (National Institutes of Health, Bethesda, MD). The value Δρ is defined as the difference between the bead CM position when the bead is moving with velocity V through the fluid and its position when the bead is not moving:
| (1) |
For small transverse displacements of the bead in the trap (∼1 μm), we have
| (2) |
where k⊥ is the trap stiffness on the plane of the image (perpendicular to the beam direction of propagation) and β is the Stokes fluid friction coefficient, given by the Stokes-Faxen law (16),
| (3) |
where a is the bead radius, η is the solution viscosity, and h is the distance from the bead CM to the glass coverslip of the sample. By moving the sample with different values of V and measuring the respective bead CM displacement, the trap transverse stiffness k⊥ is obtained.
The value of k⊥ decreases as h increases, because of focal degradation arising from spherical aberration at the interface between the coverslip and the water inside the chamber. Using the first-principles Mie-Debye Spherical Aberration theory of OT, this effect has been evaluated and experimentally verified for our OT setup (15). Calibration is performed at microsphere distance from coverslip h – a = 2.7 μm to avoid spurious interface effects. At this distance, for a = 1.52 μm, we find k⊥ = 0.72 ± 0.07 pN μm−1 mW−1.
In tether-pulling experiments, h – a remains at an approximately constant value (see Fig. 1). This value is difficult to determine precisely, but is estimated, based on confocal microscopy scanning, to be ∼0.5 μm. According to Mie-Debye Spherical Aberration theory (15), the spherical aberration correction factor relative to the calibration distance of 2.7 μm is ∼1.1. This would increase our results for force measurements by ∼10%, but given the difficulty of direct experimental verification, our quoted values are based on the measured stiffness at h – a = 2.7 μm.
Using this trap calibration, a displacement of a trapped bead in relation to its trap equilibrium position multiplied by the value of the trap stiffness gives the force on the bead:
| (4) |
The trap stiffness value can be increased or decreased in proportion to the laser beam power (15).
Tether extraction experiments
A quantity of 5 × 10⁴ NIH3T3 cells were plated on a glass-bottom dish as described above. Twenty-four hours after plating, the same uncoated polystyrene beads (a = 1.52 ± 0.02 μm) were added to the culture medium and the glass-bottom dish was placed in the optical tweezers microscope. The above-described OT was used to grab a given uncoated bead and to press it against a chosen cell membrane for 5 s, to attach the bead to the cell. Then, the microscope motorized stage (Prior Scientific, Rockland, MA) was set to move with a controlled velocity V = 0.076 ± 0.005 μm/s. Images of the entire process were collected by a charge-coupled device C2400 camera (Hamamatsu) and digitalized by a model No. FG7 frame grabber (Scion) with a capture frame rate of two frames/s.
The trapped bead equilibrium position as a function of stage displacement was determined using ImageJ software (National Institutes of Health). Using the trap calibration described above, the measured bead CM displacement was converted to measured force. Two different cell groups were compared: cells in the control group (with no treatment), and cells previously treated for 2 h with 5 μM of Cytochalasin D (Sigma-Aldrich, St. Louis, MO), a drug that disrupts the actin filaments in the cytoskeleton. All these experiments were performed in a homemade CO2 chamber adapted to the microscope, maintaining optimal culture conditions during the experiments (37°C and 5% CO2 pressure). All the data analysis described was performed with Kaleidagraph software (Synergy Software, Essex Junction, VT).
For comparison with prior experiments (13,17,18) which employed different bead coating methods (see the Discussion), 5 × 10⁴ NIH3T3 cells were plated on a glass-bottom dish as described above. Twenty-four hours after plating, normal or carboxylated polystyrene beads (a = 1.52 ± 0.02 μm) (Polysciences) uncoated or previously coated with bovine serum albumin (BSA), Mouse Immunoglobulin G, or Mouse Laminin (all obtained from Sigma-Aldrich) were added to the culture medium and the glass-bottom dish was placed in the optical tweezers microscope. All measurements and data analysis were performed as before.
Two bead coating protocols were used. In the first one, based on Dai and Sheetz (19), that was apparently the basis for the protocols in Raucher and Sheetz (17), 40 μL of normal polystyrene bead solution were mixed with 100 μL of each coating protein solution (0.1 mg/mL) and incubated overnight at 4°C. Next day, they were centrifuged at 10,000g for 10 min, resuspended in 1 mL solution of PBS-BSA (1 mg/mL), washed three times with 1 mL PBS, finally resuspended again in 200 μL of PBS, and then stored at 4°C for use. The other protocol was based on Raucher et al. (13) and Raucher (18). Briefly, 40 μL of 2.5% carboxylated polystyrene beads were mixed with 1 mL solution of 0.1 M carbonate buffer pH 9.6 and centrifuged at 2000g and 4°C for 10 min; the supernatant was removed, and the pelleted beads resuspended again in fresh carbonate buffer and recentrifuged.
Then, beads were washed twice in 0.02 M sodium phosphate buffer pH 4.5 using the same centrifugation procedure. The pellet was resuspended in 0.625 mL of 2% carbodiimide solution (1-(3-dimethylaminopropyl)-3-ethyl)) carbodiimide hydrochloride dissolved in phosphate buffer) and 0.625 mL of sodium phosphate buffer. The beads were then gently stirred for 3–4 h at room temperature using a shaker. These beads were washed twice with 1 mL phosphate solution, washed two more times with 1 mL PBS, finally resuspended in 100 mL of PBS, and incubated overnight at 4°C with 20 μL of each one of the coating proteins solutions (1 mg/mL). Next day, coated beads were pelleted by centrifugation and washed twice in PBS to remove unbound proteins and resuspended in 1 mL of 1 mg/mL BSA-PBS. Finally, the beads were washed three times and diluted in 200 μL of PBS to be used.
Fluorescence microscopy
For phalloidin-FITC (Sigma-Aldrich), commonly used as a cytochemical marker of polymerized actin tether staining, 5 × 10⁴ NIH3T3 cells of each one of the two cell groups used (control and cytochalasin-D-treated) were plated in a glass-bottom dish 24 h before the experiment. The same procedures to extract the tethers from the cell were performed as described. Immediately after the tether pulling experiment, the cells of each group were fixed in PBS-paraformaldehyde 4% for 15 min, then, treated with PBS-triton X100 0.2% for 5 min, blocked with PBS+5% BSA (Sigma-Aldrich) for 1 h at 37°C, and incubated for 1 h with phalloidin-FITC at 37°C.
Finally, the two NIH3T3 cell groups, control cells and cytochalasin-D-treated (referred to hereafter as “cytoD” cells), with tethers stained for phalloidin-FITC, were visualized using a TCS-SP5 II confocal microscope (Leica Microsystems, Wetzlar, Germany). Confocal fluorescence images were captured employing LAS AF 2.2.0 Software (Leica Microsystems). Staining and illumination conditions were adjusted to be the same for the two cell groups, so that their relative image intensities are representative of the relative amount of actin in each group.
We measured the fluorescence mean green-level (GL) associated to F-actin in the tether region (area of ∼1.6 μm2) for tethers extracted in control [GLcontrol(tether)] and cytoD [GLcytoD(tether)] situations. The green-level values obtained were considered the (mean ± standard error) of three different tethers for each situation (Fig. 3 c). The same procedure was used to analyze the fluorescence mean green-level inside the control cell [GLcontrol(cell)] and the cytoD-treated cell [GLcytoD(cell)]. For each situation, the value of GL obtained was considered the (mean ± standard error) of 20 different regions. All values were normalized by the fluorescence mean green-level of the control cell [GLcontrol (cell)].
Figure 3.
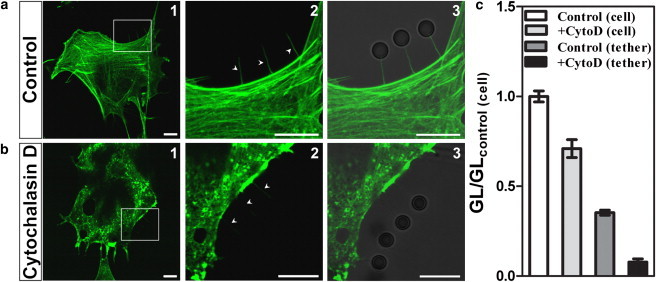
Presence of F-actin inside the tether. In control cells. (a1) Actin staining (phalloidin-FITC. (a2) Zoom showing the presence of F-actin in the extracted tethers. (a3) Bright-field/fluorescence merge image from NIH 3T3 cells. (b1–b3) Same as panel a for cytoD cells. All the scale bars are 10 μm. (c) Plot representing the green-level fluorescence (GL) of each condition, as indicated in the legend, normalized by the green-level fluorescence inside the control cell (GLcontrol(cell)) (open bar).
Scanning electron microscopy: measurement of the bead immersion angle
A quantity of 5 × 10⁴ NIH3T3 cells was plated in a glass-bottom dish as described before. Twenty-four hours after plating, uncoated polystyrene beads (a = 1.52 ± 0.02 μm) were added to the culture medium of cells for the two different groups: control cells and cytoD cells (after the procedure described above). Each glass-bottom dish in its turn was placed in the optical tweezers microscope. The optical trap was used to grab uncoated beads in solution and place them in contact with a chosen cell in the plates, by just pressing the beads against the cell membrane for 5 s with an estimated force of 200 pN (21). Note that the axial stiffness κℓ‖ of an optical trap is approximately half the transverse stiffness (21). Considering a bead displacement Δ = 1 μm and using our optical tweezers calibration for transverse optical force measurements (14,15) κ⊥ ≈ 400 pN/μm, we estimate the axial force Fa as 200 pN.
After the beads attachment, the cell cultures were immediately fixed with 2.5% glutaraldehyde in 0.1 M cacodylate buffer (pH 7.4) for 40 min at room temperature. They were then rinsed in the same buffer, and postfixed in OsO4 1% and 1.25% FeCNK for 40 min, rinsed again, and dehydrated in an ethanol series. After removing the coverslip from the petri dish, the samples were critical-point-dried using a model No. CPD 030 Critical Point Drier (BAL-TEC, Fuerstentum, Liechtenstein) and the coverslips were mounted on specimen stubs. The samples were then gold-sputtered using a model No. SCD 050 Sputter Coater (BAL-TEC) and observed in an EVO 40 scanning electron microscope (Carl Zeiss, Jena, Germany). Image acquisition was performed using SmartSEM software (Carl Zeiss). The image of the bead adhered to the cell membrane defines an arc of circle of length lθ in the contact region. The immersion angle (θ) has its vertex in the center of the bead and magnitude corresponding to one-half of lθ, θ= lθ/(2a) (see Fig. 4 b). The corresponding radius Rp of the bead-cell adhesion patch, taken to be circular, is given by
| (5) |
where a is the bead radius.
Figure 4.
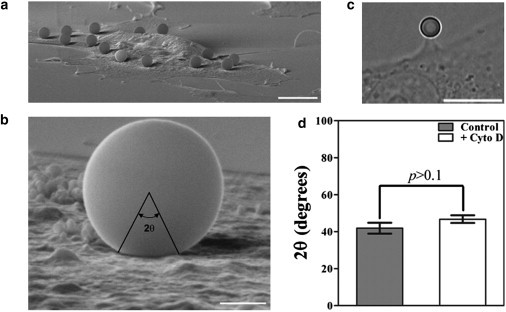
Cell-bead immersion angle measurements using scanning electron microscopy (SEM). (a) SEM panoramic image of the entire cell showing the beads attached to its surface. Scale bar: 10 μm. (b) High magnification SEM of a bead showing the immersion angle (θ) in the cell. Scale bar: 1 μm. (c) Bright-field image of an optically trapped bead adhered to a Cytochalasin-D-treated cell. The adhesion angle measured in this case is 38° in agreement with SEM measurements. Scale bar: 10 μm. (d) Results for angle measurements in control (shaded) and Cytochalasin-D-treated cells (open). Standard errors were used as error bars. At least 20 different experiments for each situation (p > 0.1 means no significant statistical differences using the t-test).
Measurement of tether radius
A quantity of 5 × 10⁴ NIH3T3 cells of each one of the two cell groups (control and cytochalasin-D-treated) were plated in a glass-bottom dish 24 h before the experiment. The same procedures to extract the tethers from the cells were performed as described. Immediately after the tether pulling experiment, the cells of each group were fixed and prepared for scanning electron microscopy, as described before. The samples were observed in an EVO 40 scanning electron microscope (Carl Zeiss) and image acquisitions were performed using SmartSEM software (Carl Zeiss). To measure the tether radius, we define g(y) as the average gray level along the tether length in the direction perpendicular to the tether axis (profile direction). Here y is the distance between a point in the profile direction and the symmetry axis of the tether.
As may be seen in Fig. 5 b and other images (not reproduced), g(y) is not quite symmetric about its peak. We attribute this to one-sided secondary electron detector positioning in the scanning electron microscope. In view of the asymmetry, we adopt a convenient fit, by left and right half-hyperbolic tangent curves (kink profiles),
| (6) |
where Bi > 0, i = 0,1,2, yL, yR, and ξ are parameters determined by Kaleidagraph (Synergy Software, Essex Junction, VT) fitting. Some of them are graphically represented in Fig. 5 c. (Note that the values of the fitting parameters found are B0 = 47.586, B1 = 23.440, B2 = −23.472, yL = 0.749, yR = 0.838, and ξ = 0.023.)
Figure 5.

Tether radius measured by scanning electron microscopy (SEM). (a) SEM representative image of a tether extracted from NIH 3T3 cell in control group. Scale bar: 1 μm. (b) SEM representative image of a tether extracted from Cytochalasin-D-treated NIH 3T3 cell. Scale bar: 1 μm. (c) Plot profile of the gray-level intensity in the tether for panel a. The plot profile was adjusted to half-hyperbolic tangent fits and the radius was determined as indicated in Eqs. 6 and 7. (d) Results for the tether radius (R) in control (shaded) and Cytochalasin-D-treated cells (open). At least 10 different measurements were performed for each situation (∗∗∗ means p < 0.001 in t-test statistics).
The tether radius is taken to be given by
| (7) |
Statistical analysis
All data are presented as mean ± standard error. Data were analyzed using GraphPad Prism statistics software (GraphPad Software, La Jolla, CA). Student's t-test was used to compare the measured values described. A value of p < 0.05 is considered significant.
Results
Presence of F-actin in the tethers
In contrast with conventional wisdom, we find that our tethers contain actin, even after cytoskeleton disruption by treatment with cytochalasin D. Fig. 3 shows phalloidin-FITC-stained NIH 3T3 fibroblasts. In Fig. 3 a, untreated cells (labeled as control), on the left, show an undisturbed cytoskeleton. The detail at the center shows the fluorescent actin inside three tethers, indicated by arrows. On the right, the bright-field image, merged with the confocal fluorescence image, shows the microspheres to which the tethers are attached.
Fig. 3 b shows corresponding results for cytoD cells. As explained in Materials and Methods, identical observation conditions were employed for the two cell groups, so that the fluorescence intensities are directly comparable. We see on the left that the actin cytoskeleton has been disrupted. Nevertheless, the detail at the center shows that the tethers still contain actin, although in a much smaller amount.
A quantitative comparison is displayed in Fig. 3 c, where green fluorescence levels within the tethers, normalized to the level within the control cell, are plotted both for control and for cytoD cells.
Tether radius
A scanning electron microscopy (SEM) representative image of a tether extracted from a control group cell is shown in Fig. 5 a. Corresponding data for the gray-level intensity profile function g(y), defined in Materials and Methods, are shown in Fig. 5 c, together with the fit to Eq. 6. A SEM image for a cytoD group cell appears in Fig. 5 b.
By applying Eq. 7, we obtain the tether radius R for the two cell groups, illustrated in Fig. 5 d:
| (8) |
Bead-cell adhesion patch radius
Steps in the determination of the cell-bead adhesion angle θ are illustrated in Fig. 4. In Fig. 4 a, a panoramic SEM view of the cell shows several attached beads. A high magnification view (Fig. 4 b) shows how θ is defined; a bright-field image in Fig. 4 c shows an adhesion angle in agreement with the SEM measurements. Results for 2θ, shown in Fig. 4 d with corresponding error bars, lead to the following values of the patch radius Rp given by Eq. 5:
| (9) |
Because the patch radius is determined by adhesion just to the cell membrane, it is expected that it should not be very sensitive to the cytochalasin treatment.
Force × deformation curve
The geometry for a typical tether extraction experiment is illustrated in Fig. 1. Fig. 1 a shows the initial situation (time t = 0), with the trapped microsphere attached to the cell, just before deformation begins. We exclude time periods during which the sphere appears to be sliding along the cell surface with no average apparent resistance. We interpret them as effectively frictionless sliding on top of the cell membrane. Therefore, the origins of time, deformation, and force are taken to coincide.
After a time interval t > 0, in which the microscope stage is displaced with velocity V, the microsphere CM would be at position Vt in the absence of cell resistance, but it is actually at position x < Vt (Fig. 1 b). The difference (Eq. 1)
| (10) |
with the corresponding force F(Δρ) given by Eq. 4, defines the force × deformation curve.
Results of a typical tether extraction experiment are shown in Fig. 2. Initial and final situations appear in Fig. 2, parts a and b, respectively, in bright field, employing an Image J (NIH) shadow north processing filter to enhance the tether image. Fig. 2 c is a montage of images from the video recording of the experiment (see Movie S1 in the Supporting Material), with the vertical white line indicating position Vt for zero force on the trap, so that Δρ is the distance to this line. The corresponding F(Δρ) curve is shown in Fig. 2 d, where the points marked by arrows correspond to the numbered positions in Fig. 2 c.
The main purpose of this article is to undertake a detailed analysis of such a force curve, trying to elucidate the origin of different features and to determine what information they may provide concerning the cell membrane and cytoskeleton. Neglecting Brownian fluctuations, we distinguish the following features in the force curve (Fig. 2 d):
Region I, a rising portion, from the origin to the maximum (point 4 in Fig. 2 d);
Fm, the maximum force;
Tether force, (following a sharp drop to a much lower value) F0; and
Region II, a nearly flat plateau region.
Our discussion proceeds backward, starting from Region II.
Tether (plateau) region
A nearly flat portion of the plateau region, in which the tether lengthens at nearly constant pulling force, is usually taken as indicating the presence of a cell membrane reservoir (17), which may take the form of membrane invaginations. We find
| (11) |
At least 20 different experiments were performed for each situation. Comparing control with cytoD cells in t-test statistics gives a p < 0.01. Standard errors were used as error values. The reduction of the tether force by almost a factor 2 in cytochalasin-treated cells is consistent with a much smaller contribution from the cytoskeleton remnants left inside. Again, however, our results differ from those of Raucher et al. (13) and Raucher (18), that find a tether force for normal cells of 7 pN.
For a long cylindrical tether formed by pure membrane, minimization of the Helfrich-Canham free energy (6) yields the relations (10,11)
| (12) |
where σ is the membrane surface tension and κ is its bending rigidity. It follows that
| (13) |
If we employ the measured values Eqs. 8 and 11, cautioning however that, because our tethers contain actin, the theoretical results Eq. 13 are not strictly applicable (see Discussion), we find
| (14) |
| (15) |
Typical orders of magnitude of σ for biological membranes (6) are in the range 10−6−10−3 N/m and for κ the range is 10−20−10−18 J (6,23), which are consistent with Eqs. 14 and 15. In Raucher et al. (13), a lower value of κ, 6.8 × 10⁻²⁰ J, was obtained in tethers pulled from blebs, with no cytoskeleton content.
Maximum force and force drop
The theoretical treatments in Powers et al. (10) and Derényi et al. (11) describe the initial growth of a (pure membrane) tether as a catenoidal-like surface merging into a cylindrical tube after a small (13%) force dip. However, they assume a point contact between the microsphere and the cell surface. In reality, there is a finite attachment area, which may be approximated by a circle of radius Rp.
It was proposed in Koster et al. (12) that the much larger force drop signaling tube formation seen in force curves like Fig. 2 d arises from a force barrier for membrane tube formation, originating from this patch. Its rim, the end ring of the catenoid, is able to support a maximum force
| (16) |
where Eq. 13 has been employed.
A more accurate estimate based on numerical solution of the shape equations from Koster et al. (12) leads to
| (17) |
These results are expected to hold asymptotically, for Rp/R >> 1. Experimental tests of Eq. 17 with artificial vesicles (12) are consistent with it, though with relatively large measurement errors.
Tests employing our data are summarized in Table 1. We see that our results are in good agreement with Eq. 17. To measure Fm, at least 20 different force curves were obtained and analyzed for each situation. Comparing control with cytoD cells in t-test statistics gives a p < 0.001. Standard errors were used as error values.
Table 1.
Summary of the results obtained
| NIH3T3 cell | Fm pN | F0 pN | R nm | Rp μm | Fm/F0 | 1+0.5Rp/R |
|---|---|---|---|---|---|---|
| Control | 220 ± 19 | 39 ± 4 | 49 ± 4 | 0.54 ± 0.04 | 5.6 ± 0.8 | 6.5 ± 0.6 |
| + Cyto D | 73 ± 6 | 23 ± 3 | 144 ± 14 | 0.59 ± 0.03 | 3.2 ± 0.5 | 3.0 ± 0.2 |
It may be mentioned that a test in the limiting case of a point contact, employing intercellular nanotubes (9), is also in good agreement with Powers et al. (10) and Derényi et al. (11).
Rising portion
The rising portion of the force curve is the most difficult one to treat. It is associated with the catenoidal-like shapes that may be partially visualized in Fig. 4 c. For vesicles, it has been modeled (11) by numerical solution of the shape equations (10) and by a Monte Carlo simulation in which the fluid membrane is represented by a network of hard spheres (24,25).
These treatments deal with lipid vesicles rather than cells, so that no account is taken of membrane-cytoskeleton interaction. In our experiments, as may be seen in Fig. 2 d, pulling forces reach hundreds of picoNewtons. Thus, it is to be expected that such interaction cannot be ignored, and that we should consider the response at the level of the whole cell, rather than just a local membrane patch.
In view of the still preliminary nature of our discussion, it is presented in Appendices A and B, and in Fig. S1.
Discussion
It is usually stated in the literature (reviewed in (6,26)) that tethers extracted from cells in vitro are formed from pure membrane, not containing any actin. What evidence is there for this contention?
Early studies (27,28) concerned red blood cells, which have an unusual cytoskeleton, anchored by a spectrin mesh. A more recent study, focused on cytoskeleton-plasma membrane adhesion (13) (reviewed in (18)), employs NIH 3T3 fibroblasts and tether pulling by OT-trapped microspheres as we do. Evidence presented for the absence of F-actin in tethers is an image in which rhodamine-phalloidin-stained tethers show no apparent fluorescence ((13), Fig. 1 D).
How may we account for the differences between our results and those of Raucher et al. (13) and Raucher (18)?
Concerning measured force values, our orders of magnitude are consistent with those found for a variety of cell types and lipid vesicles (29): for a variety of different cells and vesicles, tether forces range from 30 to 300 pN.
It has been remarked by Koster (30) that “the formation of membrane tethers in biological cells strongly depends on the details of how forces are applied.” We have attempted to trace possible sources for these disagreements by testing the effects of differences in experimental procedures.
We refer mainly to Raucher (18), which presents an extended account of materials and methods employed in Raucher et al. (13). We have also endeavored to reproduce procedures employed in Dai and Sheetz (19), that were apparently the basis for those in Raucher and Sheetz (17). The chief differences concern the presence of F-actin within the tethers and the tether force values.
Differences in bead coating do not alter tether characteristics
We employ uncoated polystyrene beads with 1.52 ± 0.02 μm radius, whereas Raucher (18) made use of carboxylated polystyrene beads with 0.5-μm radius coated with IgG. It is stated in Raucher (18), however, that the tether force was the same for different coatings (IgM, ConA), as well as for different types of cell plating supports. Here we check the effects of carboxylation and different cell coatings. For this purpose, as described above in the Materials and Methods, two different bead coating protocols were used.
Force measurements were performed as described before. The results, displayed in Fig. 6, show that neither carboxylation nor coating affect the values of the tether force and of the maximum force.
Figure 6.
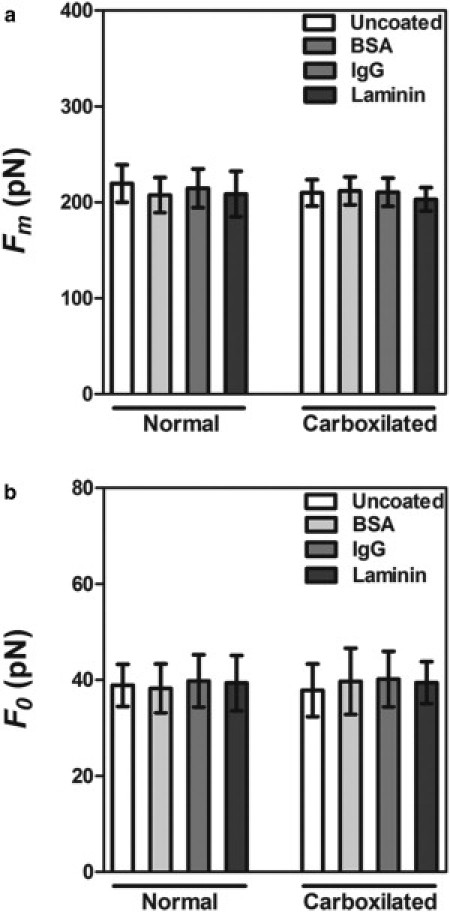
Bead coating does not alter force characteristics in Fibroblast NIH 3T3 cells. Results for maximum force values (a) and tether force values (b) using 1.52-μm radius normal and carboxylated polystyrene beads coated with different proteins as indicated in the figure legends. Standard errors were used as error bars. At least 20 different experiments for each bead-coating situation (no significant statistical difference was found for each group using the ANOVA test).
Change of bead size does not alter tether force values
A quantity of 5 × 10⁴ NIH3T3 cells was plated on each of two glass-bottom dishes as described before. Twenty-four hours after plating, two different uncoated polystyrene beads, one with a = 1.52 ± 0.02 μm and the other one with a = 0.53 ± 0.01 μm (both from Polysciences, Warrington, PA), were added to the culture medium and each glass-bottom dish containing one of the beads was placed in the optical tweezers microscope.
To measure the force on the 0.53-μm beads, the optical tweezer calibration was performed for these beads by the procedure described before. The transverse stiffness at h – a = 2.7 μm was found to be k⊥ = 1.25 pN/(μm.mW). All further measurements and data analysis were performed as described before.
The results, displayed in Fig. S2, a–c, show that the tether force value F0 is unaffected by the change in bead size, confirming that it is indeed a characteristic property of the tether.
Tethers pulled with beads of different sizes contain F-actin
The same procedures to extract tethers from the cell were performed as described above, with the addition of a mixture of two different-sized uncoated polystyrene beads, one with a = 1.52 ± 0.02 μm and another with a = 0.53 ± 0.01 μm (both from Polysciences). After the tether pulling experiment, the cells were fixed, stained for phalloidin-FITC (Sigma-Aldrich), and visualized using a TCS-SP5 II confocal microscope (Leica Microsystems), using the same procedures described before.
The results, displayed in Fig. S2, d–g, confirm the presence of F-actin in tethers pulled with both bead sizes, present in the same image, so that fluorescence intensities are directly comparable, amounting to approximately one-third of fluorescence intensity within the cell.
Use of confocal microscopy in our images pinpoints and enhances fluorescence relative to the dark background, minimizing bleaching effects through sequential section scanning.
We have also performed experiments to detect the presence of F-actin using a conventional fluorescence microscope (TE300 microscope; Nikon). On account of fast photobleaching, we had time to take only a single fluorescence picture of each field observed. As shown in Fig. S3, however, even in this condition the presence of F-actin in the extracted tethers can be seen.
Tether force comparisons
Our tether force and maximum force values for control and cytoD cells are based on extensively tested calibration data taken with our optical tweezers setup (15). The lower results in Raucher et al. (13) were obtained at a different wavelength (798 nm instead of 1064 nm) and with a different laser system, microscope, objective, and calibration procedure, concerning which we do not have detailed information. In view of these differences, we are unable to reproduce experimental conditions and procedures employed in Raucher et al. (13). Thus, we cannot investigate possible sources for the differences in force values.
Effects of tether extraction velocity
Although the tether extraction velocity V is not specified in Raucher et al. (13), reference is made to Dai and Sheetz (31) for a detailed account of tether pulling. In Dai and Sheetz (31), tethers are pulled at velocities ranging from 1 to 6 μm/s. One of the arguments in Raucher et al. (13) for the absence of actin in the tethers is that they retract rapidly when the trap is turned off.
In our experiments, when tethers are pulled with V = 1 μm/s and the trap is then immediately turned off, they also retract rapidly (data not shown). However, upon pulling at V = 1 μm/s, then stopping motion of the stage (V = 0) and waiting for 5 min before turning the laser off, the tethers no longer retract. With our normal pulling speed V = 0.076 ± 0.005 μm/s, the complete tether pulling operation takes a comparable time, 3–5 min.
What about extraction velocity effects on tether force values?
With tethers pulled at V = 0.908 μm/s, the result we get, F0 = 42 ± 3 pN, agrees with that found with our normal pulling speed (Table 1). Comparisons at higher velocities would be contaminated by the effects of friction between the bilayers of the membrane, as well as of possible reorganization of the lipids within them (30).
In the Conclusion, we argue that our pulling speed is well matched to the typical rate of filopodia protrusion, a process that has many points of similarity with tether extraction.
Values of the elastic parameters
The relations of Eq. 13 were derived for tethers pulled from artificial vesicles, devoid of cytoskeleton. Thus, it is reasonable to apply them to cytoD cells, suggesting that the results from Eq. 15 may be close to those for pure cell membranes. However, it may be an unjustified extrapolation to apply them to control cells, so that the results from Eq. 14 should be taken with the proverbial grain of salt. Nevertheless, we may attempt to interpret them as qualitative indicators of the effects of the cytoskeleton on membrane elastic parameters.
Taking the analogy between tethers and filopodia as a guide, recent results (32) on the structure of filopodia indicate that the actin bundle within them may be attached to their lateral membrane by integrins and Myo X. An analogous interaction with the tether membrane may be responsible for the sizable contraction in tether radius in control cells (Table 1), leading to increased surface tension and decreased bending modulus. The latter may also be affected by the radius shrinkage. Indeed, the bending rigidity of a hollow thin-walled cylindrical tube grows nonlinearly, like the cube of the average radius (33,34).
It should also be noted that the first relation in Eq. 16 provides what is, to our knowledge, a new direct estimate of σ, independent from the steady-state tether theory.
Validity of force barrier theory and consistency among results
The overall agreement wherever tested is so good that we suggest employing Eq. 17 to measure extracted tether radii, a difficult task given their submicroscopic size. The agreement between results obtained by different methods, apparent in Table 1, is encouraging.
Conclusion
Because current theoretical treatments of tether pulling do not take into account the presence of actin within tethers, they need to be reformulated to include this effect, which may significantly change numerical results for membrane elastic parameters. In this connection, it is worth noting that, as observed above, some of the relevant parameters may also be independently determined.
We have not experimentally determined how the actin filaments are structured within the tubes. We conjecture that their arrangement is analogous to that in filopodia, which appear to be closely related structures.
Support for this conjecture is supplied by epifluorescence observations of GFP-actin in cells submitted to a constant optically trapped silica microbead pressure (35). Within minutes after bead-cell contact, actin recruitment is observed in the vicinity of the force application zone, oriented along the force direction.
It has been proposed (35) that this may signal a reorganization of the actin filaments within the cell, allowing new actin bundles to grow toward the force application zone. This agrees with the convergent elongation model of filopodia initiation (3,36). It is worth noting, in this connection, that the typical rate of filopodia protrusion (37) is ∼0.05 μm/s. This is very close to the velocity of tether pulling in our experiments, V = 0.076 ± 0.005 μm/s.
The membrane itself, without requiring assistance from actin-binding proteins, can also contribute toward the emergence of filopodium-like protrusions from the actin mesh at the cell edge (38).
In addition to these mechanisms, the large pulling force on the membrane along the rising portion (Fig. 2 d) may lead to partial breakage of links to the membrane in the adjacent actin mesh. Channeling of the resulting fragments into the tether could help to seed and reinforce the polymerization of actin filaments within them.
It should be kept in mind that the cytoskeleton/membrane complex is an active cell element, influenced by motor proteins (32), with the capability of fast remodeling. Thus, the dynamical generic treatment of the tether pulling process outlined in the Supporting Material may capture aspects not included in quasistatic approaches. Although the specific model employed as an example to illustrate that treatment may be inadequate, the sensitivity of the results to model parameters suggests that the tether pulling force-displacement curve is a rich and insufficiently explored source of information on cell membrane-cytoskeleton interaction.
Acknowledgments
N.B.V. and H.M.N. are members of the Instituto Nacional de Ciência e Tecnologia de Fluidos Complexos. V.M.N. is a member of the Instituto Nacional de Ciência e Tecnologia de Neurociência Translacional.
This work was supported by the Brazilian agencies Conselho Nacional de Desenvolvimento Científico e Tecnológico, Coordenação de Aperfeiçoamento de Pessoal de Nível Superior, and Fundação de Amparo à Pesquisa do Rio de Janeiro. B.P. was supported by a graduate scholarship from the Fundação de Amparo à Pesquisa do Rio de Janeiro.
Supporting Material
References
- 1.Lee C., Chen L.B. Dynamic behavior of endoplasmic reticulum in living cells. Cell. 1988;54:37–46. doi: 10.1016/0092-8674(88)90177-8. [DOI] [PubMed] [Google Scholar]
- 2.Sciaky N., Presley J., Lippincott-Schwartz J. Golgi tubule traffic and the effects of brefeldin A visualized in living cells. J. Cell Biol. 1997;139:1137–1155. doi: 10.1083/jcb.139.5.1137. [DOI] [PMC free article] [PubMed] [Google Scholar]
- 3.Mattila P.K., Lappalainen P. Filopodia: molecular architecture and cellular functions. Nat. Rev. Mol. Cell Biol. 2008;9:446–454. doi: 10.1038/nrm2406. [DOI] [PubMed] [Google Scholar]
- 4.Davis D.M., Sowinski S. Membrane nanotubes: dynamic long-distance connections between animal cells. Nat. Rev. Mol. Cell Biol. 2008;9:431–436. doi: 10.1038/nrm2399. [DOI] [PubMed] [Google Scholar]
- 5.Hurtig J., Chiu D.T., Önfelt B. Intercellular nanotubes: insights from imaging studies and beyond. WIREs Nanomed. Nanobiotechnol. 2010;2:260–276. doi: 10.1002/wnan.80. [DOI] [PMC free article] [PubMed] [Google Scholar]
- 6.Derényi I., Koster G., Prost J. Lecture Notes in Physics. Springer-Verlag; Berlin, Germany: 2007. Membrane nanotubes; pp. 141–159. [Google Scholar]
- 7.Bo L., Waugh R.E. Determination of bilayer membrane bending stiffness by tether formation from giant, thin-walled vesicles. Biophys. J. 1989;55:509–517. doi: 10.1016/S0006-3495(89)82844-9. [DOI] [PMC free article] [PubMed] [Google Scholar]
- 8.Dai J., Sheetz M.P. Membrane tether formation from blebbing cells. Biophys. J. 1999;77:3363–3370. doi: 10.1016/S0006-3495(99)77168-7. [DOI] [PMC free article] [PubMed] [Google Scholar]
- 9.Pontes B., Viana N.B., Nussenzveig H.M. Structure and elastic properties of tunneling nanotubes. Eur. Biophys. J. 2008;37:121–129. doi: 10.1007/s00249-007-0184-9. [DOI] [PubMed] [Google Scholar]
- 10.Powers T.R., Huber G., Goldstein R.E. Fluid-membrane tethers: minimal surfaces and elastic boundary layers. Phys. Rev. E. 2002;65 doi: 10.1103/PhysRevE.65.041901. 041901.1–041901.11. [DOI] [PubMed] [Google Scholar]
- 11.Derényi I., Julicher F., Prost J. Formation and interaction of membrane tubes. Phys. Rev. Lett. 2002;88 doi: 10.1103/PhysRevLett.88.238101. 238101.1–238101.4. [DOI] [PubMed] [Google Scholar]
- 12.Koster G., Cacciuto A., Dogterom M. Force barriers for membrane tube formation. Phys. Rev. Lett. 2005;94 doi: 10.1103/PhysRevLett.94.068101. 068101.1–068101.4. [DOI] [PubMed] [Google Scholar]
- 13.Raucher D., Stauffer T., Meyer T. Phosphatidylinositol 4,5-bisphosphate functions as a second messenger that regulates cytoskeleton-plasma membrane adhesion. Cell. 2000;100:221–228. doi: 10.1016/s0092-8674(00)81560-3. [DOI] [PubMed] [Google Scholar]
- 14.Viana N.B., Mazolli A., Mesquita O.N. Absolute calibration of optical tweezers. Appl. Phys. Lett. 2006;88 doi: 10.1103/PhysRevE.75.021914. 131110.1–131110.3. [DOI] [PubMed] [Google Scholar]
- 15.Viana N.B., Rocha M.S., Nussenzveig H.M. Towards absolute calibration of optical tweezers. Phys. Rev. E. 2007;75 doi: 10.1103/PhysRevE.75.021914. 021914-1–021914-14. [DOI] [PubMed] [Google Scholar]
- 16.Neuman K.C., Block S.M. Optical trapping. Rev. Sci. Instrum. 2004;75:2787–2809. doi: 10.1063/1.1785844. [DOI] [PMC free article] [PubMed] [Google Scholar]
- 17.Raucher D., Sheetz M.P. Characteristics of a membrane reservoir buffering membrane tension. Biophys. J. 1999;77:1992–2002. doi: 10.1016/S0006-3495(99)77040-2. [DOI] [PMC free article] [PubMed] [Google Scholar]
- 18.Raucher D. Applications of laser tweezers to studies of membrane-cytoskeleton adhesion. In: Correia J.J., Detrich H.W. III, editors. Methods in Cell Biology. Vol. 89. Elsevier; Amsterdam, The Netherlands: 2008. pp. 451–466. [DOI] [PubMed] [Google Scholar]
- 19.Dai J., Sheetz M.P. Cell membrane mechanics. In: Sheetz M.P., editor. Methods in Cell Biology. Vol. 55. Elsevier; Amsterdam, The Netherlands: 1998. pp. 157–171. [PubMed] [Google Scholar]
- 20.Reference deleted in proof.
- 21.Neto P.A.M., Nussenzveig H.M. Theory of optical tweezers. Europhys. Lett. 2000;50:702–708. [Google Scholar]
- 22.Reference deleted in proof.
- 23.Coelho Neto J., Agero U., Mesquita O.N. Measuring optical and mechanical properties of a living cell with defocusing microscopy. Biophys. J. 2006;91:1108–1115. doi: 10.1529/biophysj.105.073783. [DOI] [PMC free article] [PubMed] [Google Scholar]
- 24.Kantor Y., Kardar M., Nelson D.R. Statistical mechanics of tethered surfaces. Phys. Rev. Lett. 1986;57:791–794. doi: 10.1103/PhysRevLett.57.791. [DOI] [PubMed] [Google Scholar]
- 25.Baumgärtner A., Ho J.-S. Crumpling of fluid vesicles. Phys. Rev. A. 1990;41:5747–5750. doi: 10.1103/physreva.41.5747. [DOI] [PubMed] [Google Scholar]
- 26.Sheetz M.P. Cell control by membrane-cytoskeleton adhesion. Nat. Rev. Mol. Cell Biol. 2001;2:392–396. doi: 10.1038/35073095. [DOI] [PubMed] [Google Scholar]
- 27.Berk D.A., Hochmuth R.M. Lateral mobility of integral proteins in red blood cell tethers. Biophys. J. 1992;61:9–18. doi: 10.1016/S0006-3495(92)81811-8. [DOI] [PMC free article] [PubMed] [Google Scholar]
- 28.Waugh R.E., Bauserman R.G. Physical measurements of bilayer-skeletal separation forces. Ann. Biomed. Eng. 1995;23:308–321. doi: 10.1007/BF02584431. [DOI] [PubMed] [Google Scholar]
- 29.Schumacher K.R., Popel A.S., Spector A.S. Computational analysis of the tether-pulling experiment to probe plasma membrane-cytoskeleton interaction in cells. Phys. Rev. E. 2009;80 doi: 10.1103/PhysRevE.80.041905. 041905-1–041905-15. [DOI] [PMC free article] [PubMed] [Google Scholar]
- 30.Koster, G. 2005. Membrane tube formation by motor proteins. PhD thesis. Leiden University, Leiden, The Netherlands. http://www.amolf.nl/publications/theses/2000-2009/.
- 31.Dai J., Sheetz M.P. Mechanical properties of neuronal growth cone membranes studied by tether formation with laser optical tweezers. Biophys. J. 1995;68:988–996. doi: 10.1016/S0006-3495(95)80274-2. [DOI] [PMC free article] [PubMed] [Google Scholar]
- 32.Zidovska A., Sackmann E. On the mechanical stabilization of filopodia. Biophys. J. 2011;100:1428–1437. doi: 10.1016/j.bpj.2011.01.069. [DOI] [PMC free article] [PubMed] [Google Scholar]
- 33.Howard J. Sinauer; Sunderland, MA: 2001. Mechanics of Motor Proteins and the Cytoskeleton. [Google Scholar]
- 34.Dombrowski C., Kan W., Wolgemuth C.W. The elastic basis for the shape of Borrelia burgdorferi. Biophys. J. 2009;96:4409–4417. doi: 10.1016/j.bpj.2009.02.066. [DOI] [PMC free article] [PubMed] [Google Scholar]
- 35.Icard-Arcizet D., Cardoso O., Hénon S. Cell stiffening in response to external stress is correlated to actin recruitment. Biophys. J. 2008;94:2906–2913. doi: 10.1529/biophysj.107.118265. [DOI] [PMC free article] [PubMed] [Google Scholar]
- 36.Svitkina T.M., Bulanova E.A., Borisy G.G. Mechanism of filopodia initiation by reorganization of a dendritic network. J. Cell Biol. 2003;160:409–421. doi: 10.1083/jcb.200210174. [DOI] [PMC free article] [PubMed] [Google Scholar]
- 37.Mogilner A., Rubinstein B. The physics of filopodial protrusion. Biophys. J. 2005;89:782–795. doi: 10.1529/biophysj.104.056515. [DOI] [PMC free article] [PubMed] [Google Scholar]
- 38.Liu A.P., Richmond D.L., Fletcher D.A. Membrane-induced bundling of actin filaments. Nat. Phys. 2008;4:789–793. doi: 10.1038/nphys1071. [DOI] [PMC free article] [PubMed] [Google Scholar]
Associated Data
This section collects any data citations, data availability statements, or supplementary materials included in this article.