

Abstract
Horizontal transfer of genes between species is an important mechanism for bacterial genome evolution. In Escherichia coli, conjugation is the transfer from a donor (F+) to a recipient (F−) cell through cell-to-cell contact. We demonstrate what we believe to be a novel qPCR method for quantifying the transfer kinetics of the F plasmid in a population by enumerating the relative abundance of genetic loci unique to the plasmid and the chromosome. This approach allows us to query the plasmid transfer rate without the need for selective culturing with unprecedented single locus resolution. We fit the results to a mass action model where the rate of plasmid growth includes the lag time of newly formed F+ transconjugants and the recovery time between successive conjugation events of the F+ donors. By assaying defined mixtures of genotypically identical donor and recipient cells at constant inoculation densities, we extract an F plasmid transfer rate of 5 × 10⁻¹⁰ (cells/mL · min)−1. We confirm a plasmid/chromosome ratio of 1:1 in homogenous F+ populations throughout batch growth. Surprisingly, in some mixture experiments we observe an excess of F plasmid in the early saturation phase that equilibrates to a final ratio of one plasmid per chromosome.
Introduction
As whole-genome sequencing of microbes has become increasingly routine, the accumulation of genomic data, and subsequent comparative genomics, has led to the understanding that bacterial genome plasticity in natural environments is extensive (1–4). This plasticity is largely a result of mobile genetic elements that can be transmitted between species through numerous mechanisms, generally termed horizontal gene transfer (HGT). HGT facilitates microbial pathogenicity (5), antibiotic resistance (6), biofilm formation (7), and novel carbon metabolism (8). Here we focus on one mechanism for HGT known as conjugation, which is the transfer of DNA through direct cell-to-cell contact. When the genes encoding the transfer machinery are contained on a plasmid, it is called a conjugative plasmid (9), which, upon transmission, enables the recipient to become an active donor.
Conjugative plasmids are a powerful tool for genome evolution as they can harbor and transfer genes between organisms sampling all genomes within an ecosystem (10). As much of our modern laboratory molecular biology and genetic engineering relies on the use of plasmids, concern for the uncontrolled spread of undesired genes prompted the early study of plasmid maintenance and loss. In an elegant series of articles, Levin and colleagues developed a mass-action model for the growth, transfer, and persistence of both conjugative and nonconjugative plasmids within a population (11–14). This issue remains on the forefront of discussion, with concerns of acquired antibiotic resistance (15) or dissemination of genes into the environment from genetically modified food or bioenergy crops (16).
In this work, we focus on a model system, the F plasmid, or mating compatibility factor, in Escherichia coli (17) which encodes for a type-4 secretion system (18). Conjugation commences when the tips of F pili from a donor cell (termed F+) make contact with recipient cells (F−) (9,10) creating a mating bridge. Recent work has shown the pili to be a dynamic structure, extending and retracting continuously (19). When the pili retract, the cells form a mating pair aggregate (20).
Although numerous interesting mathematical models (21–28) to describe conjugation have been developed over the past decade, much of their experimental validation relies on quantifying the number of functional transconjugants through selective culturing. This strategy makes it difficult to parse the transfer rate of the plasmid from the additional mechanistic steps involved in the formation of functional transconjugants. Culturing also introduces the contribution of selection pressure and fitness.
A clever alternative to selective culturing is the use of donor-suppressed fluorescent reporter genes (29,30), which upon transfer, create fluorescent recipients. Although reporter genes like green fluorescent protein are functional in a broad number of species, the production of nonessential proteins can also be a metabolic burden, again creating a selection pressure. We have eliminated a number of these selective factors, by directly measuring the plasmid transfer rate through the relative abundance of genetic loci. These loci are enumerated using a quantitative PCR (qPCR) assay whose sensitivity allows enumeration at the single molecule (loci target) level. The reproducibility and low noise of the assay are a significant improvement over previous methods for the measurement of plasmid transfer kinetics.
Materials and Methods
Strains
W6 (F+, relA1 spoT1 metB1 rrnB-2 creC5-10), an early derivative of the original K12 (F+) strain characterized by Lederberg et al. (17), was used as both a donor and recipient. The strains were acquired from the Yale Coli Genetic Stock Center. We created a W6 (F−) by curing W6 (F+) with acridine orange. The mechanism of action for acridine orange has been attributed to the delayed replication of the F plasmid versus the chromosome, therefore diluting it out of the population (31,32). Although the choice of a relA spoT background may influence the growth of the cells in media shift experiments, there is evidence that relA spoT mutants have comparable growth rates to relA+ spoT+ and the mutations do not influence F plasmid maintenance (33). The authors' choice of W6 was motivated by the desire to study the maintenance of the natural F factor versus engineered F′ episomes under selection.
Creating W6 (F−) isolates
W6 (F−) cells were created using a modified acridine orange assay (34). Following the published assay, W6 (F+) cells were inoculated into 3 mL Luria broth supplemented with 80 μg/mL acridine orange (pH 7.6) and grown overnight at 37°C. Dilutions (∼1/106) of the overnight culture were plated on unsupplemented Luria broth plates at densities that produced well-resolved single colonies after overnight incubation. Colonies were then screened for the presence of the F+ plasmid using the TraI/TolC qPCR assays (described in Quantitative PCR Assay, below). Although the abundance of TraI was reduced relative to TolC in the colonies tested, all colonies remained weakly positive for TraI. Further dilution of each colony by restreaking and overnight incubation did not reduce the TraI abundance in the new colonies, and in some cases, the TraI abundance increased.
Two modifications of the original acridine orange protocol (34) were found to reduce the TraI level below the qPCR background signal (no template control). One method required two or more sequential overnight growths in acridine-orange-supplemented Luria broth. The second method combined a single overnight growth in the presence of both acridine orange and mild heat shock (40°C). The investigators chose the latter method due to concern that increased exposure to the mutagenic agent could also damage unintended targets in the cells.
In a series of articles from Wada et al. (culminating in (35)) it is shown that σ-factor 32 (rpoH), the transcription factor that regulates stress response, including heat shock, is essential to F plasmid replication. The parent strain W6 F+ showed no decrease in replication (confirmed by a 1:1 ratio of TolC/TraI in the qPCR assay) of the F plasmid when grown to saturation at elevated temperatures (40°C and 42°C), inferring no rpoH mutation. To assure acridine orange did not introduce a mutation into the rpoH gene during curing, we also sequenced the rpoH gene from our cured W6 F− strain. Sequencing confirmed the absence of any point mutation in the gene.
Growth assays
W6 (F+) and W6 (F−) cells were inoculated into separate Luria broth (∼7 mL) overnight cultures. The saturated cultures were then mixed in ratios of F+:F− (1:1(500 μL:500 μL), 1:10(100 μL:1000 μL), 1:102(10 μL:1000 μL), and 1:103(1 μL:1000 μL)). To maintain the same inoculation density in all experiments, 200 μL of these dilutions were then used to inoculate 50 mL Luria broth in 250-mL flasks (final concentration ∼106 cells/mL). The flasks were then placed in a water bath immersion shaker (model G67; New Brunswick Scientific, New Brunswick, NJ), with shaking induced at 110 rpm and maintained at 37°C. The rate of mating pair formation has been shown to be constant over a broad range of shake flask shear forces (0–300 rpm) (27). A quantity of 100-μL aliquots was extracted every 15 min without pausing the shaking or removing the flask from the immersion bath. The 100-μL aliquot was diluted into 400-μL water (MilliQ RO purified; Millipore, Billerica, MA) then placed in a 95°C dry bath to lyse the cells (preserving the cell number and denaturing potential degradation enzymes). Aliquots for the time series were then stored at −20°C until their use as template for the qPCR assays. Because our shaker can accommodate nine 250-mL flasks, all growth data reported in this article were gathered using simultaneously grown batch cultures, inoculated from the same overnight culture.
Mathematical model
Our mathematical model is based on Stewart and Levin's (11) plasmid dynamics model in a resource-limited environment. Conjugation is described by mass-action kinetics between the plasmid-bearing and plasmid-free cells. During conjugation, recipients (the plasmid-free cells) receive a copy of plasmid from donors (the plasmid-bearing cells) and become transconjugants, whereas donors become temporarily exhausted (28). We incorporate the lag time into our model by introducing the rate of transconjugants becoming active donors, λT, and the rate of exhausted donors returning to active donors, λX. A schematic of the four states a cell can assume, and the allowed pathways for transition, are shown in Fig. 1.
Figure 1.
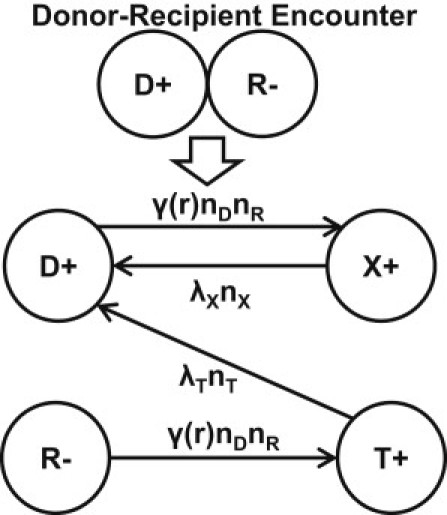
Donors (D) and Recipients (R) become Exhausted donors (X) and Transconjugants (T) through conjugation at rate γ(r)nDnR; X and T become active D at rate λXnX and λT nT, respectively.
As our assays are all batch culture (versus continuous culture), we assume a resource-limited growth model, or, in other words, logistic growth. The logistic model states that the growth rate is limited by the carrying capacity of the growth media, K. Hence the number of any cells in state as a function of time, , is the product of the growth rate, ψ(r), the number of cells currently in that state, n, and the saturation limit of the media:
| (1) |
The term 1 − ∑n/K reflects the quantity of remaining nutrients that the cells can utilize for growth. When the nutrients are exhausted, the cells reach the carrying capacity of the media, ∑n/K → 1, and growth ceases, . We incorporate logistic growth (Eq. 1) into our model as the first term in Eqs. 2–5, which describe the allowed transitions schematized in Fig. 1:
| (2) |
| (3) |
| (4) |
| (5) |
| (6) |
The growth of each population, i.e., the number of donors, nD; recipients, nR; transconjugants, nT; and exhausted donors, nX, are corrected by the number of cells actively conjugating γ(r)nD nR, where γ(r) is the conjugation rate. The growth must also correct for the number of cells trapped in states which cannot conjugate, X and T, and are represented by the terms λXnX and λTnT, respectively. Finally, we describe the exponential consumption of resources by Eq. 6, where e is the resource consumption for one cell division.
As our governing model is resource-limited logistic growth, we can extract the maximum conjugation rate though a hyperbolic model consistent with Stewart and Levin (11). Often used in substrate-limited enzyme kinetics (Michaelis-Menten), the hyperbolic model allows us to describe the maximum velocity of a reaction under the resource constraint. Monod (38) proposed that bacterial growth kinetics resemble enzyme kinetics in terms of substrate limitation, an idea that was further refined for modeling conjugative transfer by Andrup and Andersen (28). Here the growth rate ψ(r) and conjugation rate γ(r) are related to the resource, r, through their maximum rates, ψMAX and γMAX, respectively; Q is the concentration of resource when the rate is half-maximum:
| (7) |
| (8) |
The units of γMAX, the maximum conjugation rate, are consistent with the precedent set by the field, and derived from the units
| (9) |
All simulations were performed in MATLAB (Ver. 7.8.0.347 (R2009a); The MathWorks, Natick, MA) using the symbolic math and optimization toolboxes.
Quantitative PCR assay
Quantitative PCR is routinely used for quantifying template abundance and when optimized, can achieve single molecule sensitivity. Fig. 2 a shows the output of a qPCR assay. The amplification curve is proportional to the amount of double-stranded DNA product as the reaction progresses in time (cycle number). The relative abundance of starting template can be quantified by the time elapsed for the reaction to produce equivalent amounts of double-stranded DNA product (labeled as a threshold in Fig. 2 a). As the cell population grows, the number of target loci grows proportionally. As the amount of starting template increases, the time necessary to reach the threshold value decreases. The threshold values, Ct, can be translated into a growth curve (Fig. 2 b) where each amplification curve in Fig. 2 a corresponds to a collected time point in the time series of the batch growth culture.
Figure 2.
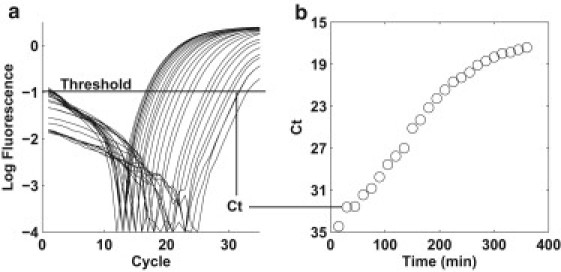
(a) Log plot of the amplification curves from the qPCR reaction. The threshold cycle (Ct) is the cycle number at which the fluorescent signal of the reaction crosses the threshold value. (b) The Ct value is inversely related to the amount of starting template. A plot of the Ct values versus time yields the growth curve for the target locus.
The number of genes, n, is converted to Ct values as
| (10) |
Ct0 is an arbitrary constant, and is determined by best fitting qPCR data. Both plasmid-bearing and plasmid-free cells have TolC locus (on chromosome), but only the plasmid-bearing cells have the TraI locus (on plasmid). The TolC Ct values correspond to the total number of cells, whereas TraI Ct values only correspond to plasmid-bearing cells,
| (11) |
| (12) |
where nD, nR, nT, and nX are the abundance of cells in the states defined by Fig. 1.
All qPCR assays used a master mix consisting of final concentration: 2 mM MgCl2, 200 μM dNTP mix, 1 U (per 25 μL volume) Roche FastStart Enzyme blend (Roche Diagnostics, Mannheim, Germany), 1× Roche FastStartBuffer (Roche Diagnostics), 0.4 μM forward and reverse primers, 2 μM SYTO 9 (Invitrogen, Life Technologies, Carlsbad, CA), and 1× ROX reference dye (Invitrogen, Life Technologies). We use SYTO9 dye for double-stranded DNA quantification as it has been shown to have fewer sequence and concentration artifacts (39). A quantity of 5 μL of the lysed frozen aliquots was used as template for the qPCR reactions (per 25 μL reaction). The primer sequences were designed using an in-house algorithm (Spangler Q-Design). (See Table 1 for a list of primers and thermal programs used.)
Table 1.
Primers and thermal program
| Primers | 5′→3′ | Thermal program | |
|---|---|---|---|
| TolC Forward | CGACAAACCACAGCCGGTTA | 95°C for 6 min | 1 cycle |
| TolC Reverse | CAGCGAGAAGCTCAGGCCA | 95°C for 30 s | Repeat for 35 cycles |
| TraI Forward | GCCATTCATCTTGCCCTTCC | 54°C for 30 s | |
| TraI Reverse | GCATGACCGCCTCCTTACC | Plate read | |
| 72°C for 25 s | |||
All reactions were performed in a BioRad Chromo4 Instrument (Bio-Rad Laboratories, Hercules, CA), in 96-well, clear bottom, hard-shell, skirted assay plates (Bio-Rad Laboratories) with Microseal B sealing tape (Bio-Rad Laboratories). The instrument filter settings were set for FAM and ROX for SYTO9 and ROX, respectively, where ROX is used as a passive reference. Both the error in replicate qPCR reactions using the same template (frozen cell aliquots from a single time series) and the error between separate time series assays were <1 cycle (data not shown), including the error in the saturated phase.
Results and Discussion
We present what we believe to be a novel qPCR protocol to measure the growth of a bacteria culture, which enables us to capture a dense sampling of the growth kinetics with unprecedented sensitivity (single molecule/target). We have also demonstrated the utility of an extremely low noise collection and analysis protocol that allows us to perform the qPCR assay without further DNA purification. As shown in Fig. 2 a, the relative abundance of loci are determined for a threshold value, and plotted against time to create a growth curve (Fig. 2 b). To our knowledge, this is the first demonstration of using qPCR to measure growth kinetics.
Whereas selective culturing methods quantify the number of functional transconjugants, the qPCR assay allows us to directly measure the growth kinetics of two genetic loci—the E. coli chromosome (TolC), and the F plasmid (TraI). This removes the additional time lag associated with production of the proteins to survive the selection condition, as well as the beneficial driving force potentially associated with a selection condition. We have also attempted to remove the selection pressure associated with variable genetic backgrounds by measuring the plasmid transfer kinetics in an isogenic strain set.
Growth of a pure F+ culture and mixture experiments (F+ and F− cells of identical chromosomal lineage) were performed to extract the contributions of replicative ψ(r) and conjugative growth γ(r). Fig. 3 shows the growth of a pure F+ where the ratio of TolC (circle) to TraI (square) locus is ∼1:1 throughout the batch growth process. We can assume that the only mechanism for increasing the abundance of the TraI locus is replication, as mating between F+ cells is unlikely due to surface exclusion mechanisms encoded by TraS and TraT genes (40). Therefore, we can extract the maximum growth rate, ψMAX(r) = 0.035 min−1 from the curve in Fig. 3 by fitting the exponential phase.
Figure 3.
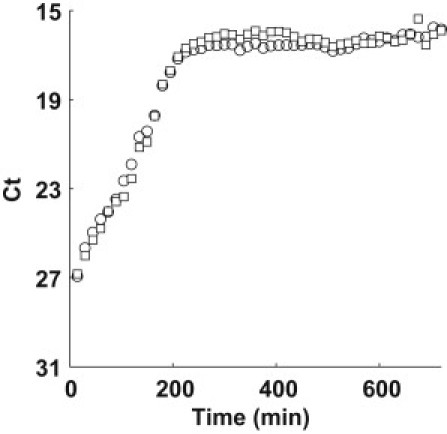
Time series plot of TolC (circle) and TraI (square) for a pure F+ culture.
We can estimate the order of magnitude for the carrying capacity, K, experimentally by counting the number of cells at saturation using a hemocytometer. Because r scales with e (Eq. 6), we have chosen to define them in terms of arbitrary units. Allowing Q = 1 arbitrary unit, and r = 100 arbitrary units, Eq. 7 defines a value for e = 1.5 × 10⁻⁸ arb. unit mL cell−1. Values of e have been reported for defined glucose supplemented minimal media (11). However, Luria broth, the common laboratory media for rapid growth of E. coli cultures, is not supplemented with glucose. Growth has been shown to be limited by the utilization of catabolizable amino acids (41).
Fig. 4, a and b, shows the growth of the TolC (Fig. 4 a) and TraI (Fig. 4 b) loci in mixture experiments of donor/receptor, 1:1 (upward-pointing triangle), 1:10 (diamond), 1:102 (square), and 1:103 (circle). For comparison, the pure F+ culture data (data of Fig. 3) is shown in both figures as downward-pointing triangles.
Figure 4.
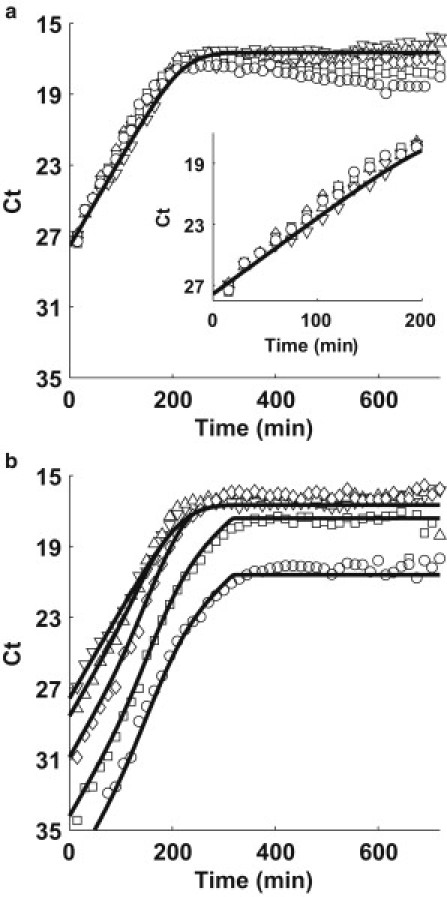
(a) TolC and (b) TraI simulation (solid line) and quantitative PCR data (solid symbols). Each plot represents a different inoculation ratio of donors to recipients: Pure F+ (donor) culture (downward-pointing triangle), 1:1 (upward-pointing triangle), 1:10 (diamond), 1:100 (square), and 1:1000 (circle).
We observe the rate of growth for the chromosomal loci (Fig. 4 a) is similar for different mixtures (Fig. 4 a, inset) as well as the pure F+ culture (downward-pointing triangle). However, when we examine the rate of growth of the plasmid TraI loci (Fig. 4 b), the exponential phase differs from the growth of the pure F+ culture reflecting the contribution of conjugation events.
The solid lines shown in Fig. 4, a and b, are plots of the best-fit simulation determined from the MATLAB optimization toolbox (solving Eqs. 2–7). We allow the least-squares algorithm to search for the best values, starting from our estimates of ψMAX, Q, e, and K discussed above and the reported values for λT (28,37) and λX (37), 90 and 30 min, respectively. Table 2 reports the best-fit values determined by the algorithm. Note, the values of ψMAX, Q, K, λT, and λX did not change in finding the best fit. We find a slightly different value for e = 1.8 × 10⁻⁸ arb. unit mL cell−1 (vs. 1.5 × 10⁻⁸ arb. unit mL cell−1 estimated previously) and determine the maximum plasmid transfer rate to be ψMAX = 5 × 10⁻¹⁰ mL cell−1 min−1.
Table 2.
Parameter values used in simulation
| Physical Property | Parameter | Value | Reference |
|---|---|---|---|
| Maximum growth rate | ψMAX | 0.035 min−1 | This work |
| Maximum conjugation rate | ψMAX | 5 × 10⁻¹⁰ mL cell−1 min−1 | This work |
| Concentration of the resource when the rate is half-maximum | Q | 1 arbitrary unit | |
| Resource consumption per cell division | e | 1.8 × 10⁻⁸ arb. unit mL cell−1 | This work |
| Carrying capacity | K | 2 × 10⁹ cell mL−1 | This work |
| Delay in new transconjugants become active donors | λT | 1/90 min−1 | (28,37) |
| Delay in exhausted donors returning to the active donor pool | λX | 1/30 min−1 | (37) |
Fig. 5 demonstrates the influence of various parameters in our model. In Fig. 5 a, λT and λX are varied by a factor of 10 from our best-fit simulation (solid line) for all mixture experiments. The physical equivalent is a decrease or increase by a factor of 10 in the lag times associated with the newly formed transconjugants and exhausted donors before returning to the active donor pool. The dashed lines represent λT = 1/9 min−1, λX = 1/3 min−1 whereas the dash-dot lines represent λT = 1/900 min−1, λX = 1/300 min−1. Note the influence primarily effects the transition from the late exponential phase into saturation.
Figure 5.
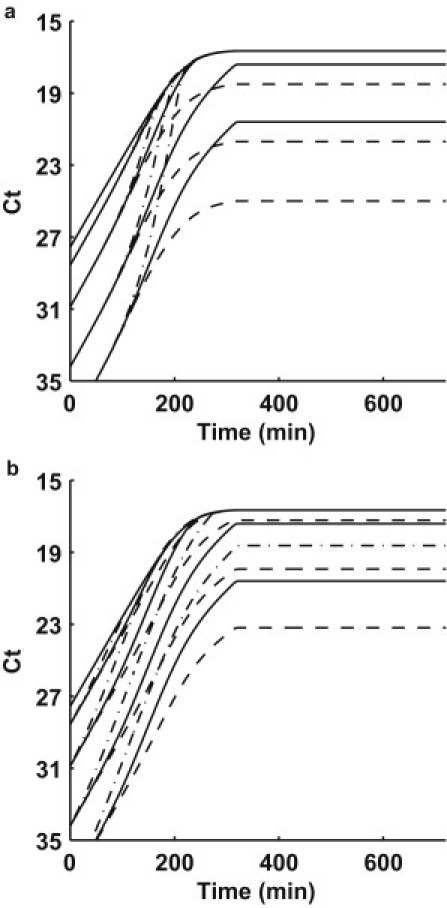
(a) The effect of variation in λT and λX: λT = 1/9 min−1, λX = 1/3 min−1 (dashed line); λT = 1/90 min−1, λ = 1/30 min−1 (solid line); λT = 1/900 min−1, and λX = 1/300 min−1 (dash-dot line). (b) The effect of variation in T: T = 5 × 10⁻⁹ mL cell−1 min−1 (dashed line); T = 5 × 10⁻¹⁰ mL cell−1 min−1 (solid line); and T = 5 × 10⁻¹¹ mL cell−1 min−1 (dash-dot line).
Fig. 5 b shows the influence of the maximum conjugation rate, γMAX. The solid lines represent the best fit from our simulation (γMAX = 5 × 10⁻¹⁰ mL cell−1 min−1). If we vary γMAX by an order of magnitude from the best fit, the influence is strong within the early exponential phase. The physical significance of varying γMAX changes the competition between replication and conjugation, which both contribute to the growth of the TraI marker. At larger values of γMAX, conjugation is the dominant mechanism, shown by the dashed lines in Fig. 5 b, where γMAX = 5 × 10⁻⁹ mL cell−1 min−1. When γMAX is smaller, replication dominates, and the early exponential rate is slower, shown by the dash-dot lines in Fig. 5 b, where γMAX = 5×10⁻¹¹ mL cell−1 min−1.
Our best-fit value for the plasmid transfer rate 5 × 10⁻¹⁰ mL cell−1 min−1 is in agreement with previous estimates (14,44–46) of the bulk conjugation rates found through functional transconjugant enumeration (10−8–10−15 mL cell−1 min−1) However, in contrast to previous work, our assay allows for direct measurement of the plasmid transfer rate. The use of multiple mixture experiments of the same inoculation density allows us to find parameters that satisfy a large range of donor to recipient concentration ratios. The value γMAX can be used to estimate the maximum conjugation rate per donor for different donor concentrations. In our experiment, donor concentrations vary from 106 to 109 cells mL−1. Hence our conjugation rate per donor varies from 0.3 × 10⁻³ to 0.3 min−1 . The latter number is consistent with previous estimates of 0.15 min−1 from Andrup and Anderson (28) and 0.25 min−1 from Dusenbery (47).
To understand the physical significance of γMAX, recall the γ(r) nDnR term in Eqs. 2–5. This term defines the number of conjugations per unit time, which is analogous to the number of encounters per unit time for two kinds of spherical particles in liquids. The encounter rate of molecules A and B of identical radii due to diffusion is (47)
| (13) |
where kB is the Boltzmann constant (1.38 × 10⁻²³ J K−1), TK is temperature (310 K (37°C)), and η is viscosity (1 mPa s) and nA, nB represent the concentration of particles a and b. We find s = 6 × 10⁻¹⁰ mL particles−1 min−1. This is very similar to the value we found for the maximum conjugation rate γMAX = 5 × 10⁻¹⁰ mL cell−1 min−1, and suggests that most encounters result in plasmid transfer.
We also note an interesting effect, shown in Fig. 6, a and b. Fig. 6 a shows the growth data of both TolC (circle) and TraI (square) loci for the 1:1 mixture experiment shown in Fig. 4, a and b. Note the overshoot of TraI in early saturation. The TolC abundance gradually increases to meet the TraI abundance. A different effect is shown in Fig. 6 b, which shows the growth data of both TolC (circle) and TraI (square) loci for the 1:103 mixture experiment (from Fig. 4, a and b). The TolC loci actually decreases in abundance to equilibrate with the TraI abundance. We find 1:1 abundance of TraI/TolC in samples taken 24 h into the batch growth assay (data not shown). As we have previously mentioned, the metabolic potential of Luria broth is limited by the catabolizable amino acids. Perhaps this is evidence of lethal zygosis (42,43) and canabalism of resources by the culture in saturation phase.
Figure 6.
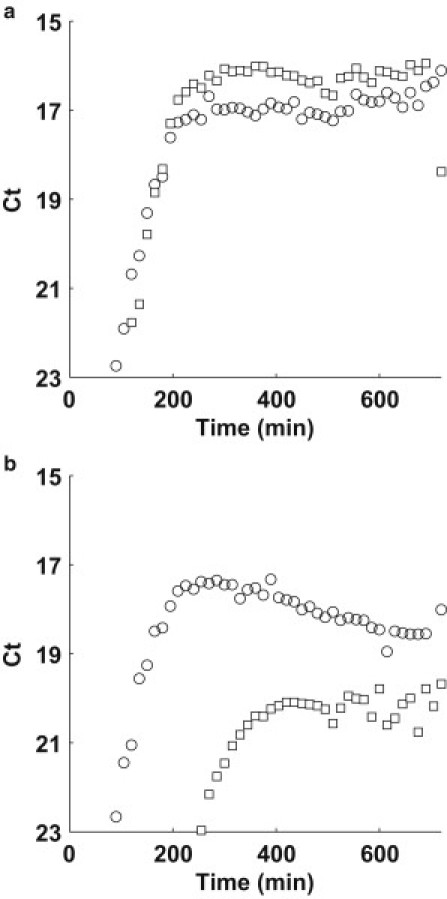
Time series plot of TolC (circle) and TraI (square) for F+:F− mixtures (a) 1:1 and (b) 1:103.
Conclusion
We have demonstrated what we believe to be a novel assay using qPCR to quantify the abundance of genetic loci throughout a batch growth process. The experimental design allows us to directly measure the plasmid transfer rate during conjugation at the nucleic acid level, rather than the functional protein level through selective culturing. By confining our mating experiments within a single genetic background, we also reduce selection and fitness pressures. Using a mass action model where the rate of plasmid growth includes the lag time of newly formed F+ transconjugants and the recovery time between successive conjugation events of the F+ donors, we find a single maximum conjugation rate for mixture experiments varying from 1:1 to 1:103 in fixed density donor/recipient inoculation.
Finally, we observe different behaviors of the mixture batch cultures as they approach equilibrium values of one plasmid per chromosome in saturation phase. Although this work focused on a model system, we anticipate this method can be extended to nonmodel systems such as disease progression or evolving populations in environmental samples.
Acknowledgments
N.L.G. thanks Joshua S. Lederberg for his mentorship, friendship, and inspiration.
The authors thank the Research Centers for Minority Institutions for grant No. G12-RR003037-24-2245476. Z.W. and S.T. are supported by the City University of New York's graduate program. J.V. was supported by the Macauley Honors Program, and J.M. was supported by NIGMS MARC grant GM007823-30.
Footnotes
This article is dedicated to the late Joshua S. Lederberg.
References
- 1.Gogarten J.P., Townsend J.P. Horizontal gene transfer, genome innovation and evolution. Nat. Rev. Microbiol. 2005;3:679–687. doi: 10.1038/nrmicro1204. [DOI] [PubMed] [Google Scholar]
- 2.Dagan T., Martin W. Ancestral genome sizes specify the minimum rate of lateral gene transfer during prokaryote evolution. Proc. Natl. Acad. Sci. USA. 2007;104:870–875. doi: 10.1073/pnas.0606318104. [DOI] [PMC free article] [PubMed] [Google Scholar]
- 3.Yin X., Stotzky G. Gene transfer among bacteria in natural environments. Adv. Appl. Microbiol. 1997;45:153–212. doi: 10.1016/s0065-2164(08)70263-6. [DOI] [PubMed] [Google Scholar]
- 4.Jain R., Rivera M.C., Lake J.A. Horizontal gene transfer accelerates genome innovation and evolution. Mol. Biol. Evol. 2003;20:1598–1602. doi: 10.1093/molbev/msg154. [DOI] [PubMed] [Google Scholar]
- 5.Christie P.J., Vogel J.P. Bacterial type IV secretion: conjugation systems adapted to deliver effector molecules to host cells. Trends Microbiol. 2000;8:354–360. doi: 10.1016/s0966-842x(00)01792-3. [DOI] [PMC free article] [PubMed] [Google Scholar]
- 6.Teuber M. Spread of antibiotic resistance with food-borne pathogens. Cell. Mol. Life Sci. 1999;56:755–763. doi: 10.1007/s000180050022. [DOI] [PMC free article] [PubMed] [Google Scholar]
- 7.Ghigo J.M. Natural conjugative plasmids induce bacterial biofilm development. Nature. 2001;412:442–445. doi: 10.1038/35086581. [DOI] [PubMed] [Google Scholar]
- 8.Tan H.M. Bacterial catabolic transposons. Appl. Microbiol. Biotechnol. 1999;51:1–12. doi: 10.1007/s002530051356. [DOI] [PubMed] [Google Scholar]
- 9.Novick R.P., Clowes R.C., Falkow S. Uniform nomenclature for bacterial plasmids: a proposal. Bacteriol. Rev. 1976;40:168–189. doi: 10.1128/br.40.1.168-189.1976. [DOI] [PMC free article] [PubMed] [Google Scholar]
- 10.Norman A., Hansen L.H., Sørensen S.J. Conjugative plasmids: vessels of the communal gene pool. Philos. Trans. R. Soc. Lond. B Biol. Sci. 2009;364:2275–2289. doi: 10.1098/rstb.2009.0037. [DOI] [PMC free article] [PubMed] [Google Scholar]
- 11.Stewart F.M., Levin B.R. The population biology of bacterial plasmids: a priori conditions for the existence of conjugationally transmitted factors. Genetics. 1977;87:209–228. doi: 10.1093/genetics/87.2.209. [DOI] [PMC free article] [PubMed] [Google Scholar]
- 12.Levin B.R., Stewart F.M. The population biology of bacterial plasmids: a priori conditions for the existence of mobilizable nonconjugative factors. Genetics. 1980;94:425–443. doi: 10.1093/genetics/94.2.425. [DOI] [PMC free article] [PubMed] [Google Scholar]
- 13.Bergstrom C.T., Lipsitch M., Levin B.R. Natural selection, infectious transfer and the existence conditions for bacterial plasmids. Genetics. 2000;155:1505–1519. doi: 10.1093/genetics/155.4.1505. [DOI] [PMC free article] [PubMed] [Google Scholar]
- 14.Lundquist P.D., Levin B.R. Transitory derepression and the maintenance of conjugative plasmids. Genetics. 1986;113:483–497. doi: 10.1093/genetics/113.3.483. [DOI] [PMC free article] [PubMed] [Google Scholar]
- 15.French G.L. The continuing crisis in antibiotic resistance. Int. J. Antimicrob. Agents. 2010;36:S3–S7. doi: 10.1016/S0924-8579(10)70003-0. [DOI] [PubMed] [Google Scholar]
- 16.Murphy D.J. Improving containment strategies in biopharming. Plant Biotechnol. J. 2007;5:555–569. doi: 10.1111/j.1467-7652.2007.00278.x. [DOI] [PubMed] [Google Scholar]
- 17.Lederberg J., Cavalli L.L., Lederberg E.M. Sex compatibility in Escherichia coli. Genetics. 1952;37:720–730. doi: 10.1093/genetics/37.6.720. [DOI] [PMC free article] [PubMed] [Google Scholar]
- 18.Lawley T.D., Klimke W.A., Frost L.S. F factor conjugation is a true type IV secretion system. FEMS Microbiol. Lett. 2003;224:1–15. doi: 10.1016/S0378-1097(03)00430-0. [DOI] [PubMed] [Google Scholar]
- 19.Clarke M., Maddera L., Silverman P.M. F-pili dynamics by live-cell imaging. Proc. Natl. Acad. Sci. USA. 2008;105:17978–17981. doi: 10.1073/pnas.0806786105. [DOI] [PMC free article] [PubMed] [Google Scholar]
- 20.Achtman M. Mating aggregates in Escherichia coli conjugation. J. Bacteriol. 1975;123:505–515. doi: 10.1128/jb.123.2.505-515.1975. [DOI] [PMC free article] [PubMed] [Google Scholar]
- 21.Willms A.R., Roughan P.D., Heinemann J.A. Static recipient cells as reservoirs of antibiotic resistance during antibiotic therapy. Theor. Popul. Biol. 2006;70:436–451. doi: 10.1016/j.tpb.2006.04.001. [DOI] [PubMed] [Google Scholar]
- 22.Krone S.M., Lu R., Top E.M. Modelling the spatial dynamics of plasmid transfer and persistence. Microbiology. 2007;153:2803–2816. doi: 10.1099/mic.0.2006/004531-0. [DOI] [PMC free article] [PubMed] [Google Scholar]
- 23.Lili L.N., Britton N.F., Feil E.J. The persistence of parasitic plasmids. Genetics. 2007;177:399–405. doi: 10.1534/genetics.107.077420. [DOI] [PMC free article] [PubMed] [Google Scholar]
- 24.Ponciano J.M., De Gelder L., Joyce P. The population biology of bacterial plasmids: a hidden Markov model approach. Genetics. 2007;176:957–968. doi: 10.1534/genetics.106.061937. [DOI] [PMC free article] [PubMed] [Google Scholar]
- 25.Fox R.E., Zhong X., Top E.M. Spatial structure and nutrients promote invasion of IncP-1 plasmids in bacterial populations. ISME J. 2008;2:1024–1039. doi: 10.1038/ismej.2008.53. [DOI] [PMC free article] [PubMed] [Google Scholar]
- 26.Gregory R., Saunders J.R., Saunders V.A. Rule-based modeling of conjugative plasmid transfer and incompatibility. Biosystems. 2008;91:201–215. doi: 10.1016/j.biosystems.2007.09.003. [DOI] [PubMed] [Google Scholar]
- 27.Zhong X., Krol J.E., Krone S.M. Accounting for mating pair formation in plasmid population dynamics. J. Theor. Biol. 2010;262:711–719. doi: 10.1016/j.jtbi.2009.10.013. [DOI] [PMC free article] [PubMed] [Google Scholar]
- 28.Andrup L., Andersen K. A comparison of the kinetics of plasmid transfer in the conjugation systems encoded by the F plasmid from Escherichia coli and plasmid pCF10 from Enterococcus faecalis. Microbiology. 1999;145:2001–2009. doi: 10.1099/13500872-145-8-2001. [DOI] [PubMed] [Google Scholar]
- 29.Normander B., Christensen B.B., Kroer N. Effect of bacterial distribution and activity on conjugal gene transfer on the phylloplane of the bush bean (Phaseolus vulgaris) Appl. Environ. Microbiol. 1998;64:1902–1909. doi: 10.1128/aem.64.5.1902-1909.1998. [DOI] [PMC free article] [PubMed] [Google Scholar]
- 30.Christensen B.B., Sternberg C., Molin S. Bacterial plasmid conjugation on semi-solid surfaces monitored with the green fluorescent protein (GFP) from Aequorea victoria as a marker. Gene. 1996;173(1 Spec No):59–65. doi: 10.1016/0378-1119(95)00707-5. [DOI] [PubMed] [Google Scholar]
- 31.Akiya Y., Hirota M., Matsuhashi T. Hypoglycemic symptoms following gastrectomy. (Succeeding report.) Yokohama Med. Bull. 1960;11:470–479. [PubMed] [Google Scholar]
- 32.Riva S., Fietta A., Romero E. Relationships between curing of the F episome by rifampin and by acridine orange in Escherichia coli. Antimicrob. Agents Chemother. 1973;3:456–462. doi: 10.1128/aac.3.4.456. [DOI] [PMC free article] [PubMed] [Google Scholar]
- 33.Winkler M.E., Zawodny R.V., Hartman P.E. Mutation spot of Escherichia coli increases expression of the histidine operon deleted for the attenuator. J. Bacteriol. 1979;139:993–1000. doi: 10.1128/jb.139.3.993-1000.1979. [DOI] [PMC free article] [PubMed] [Google Scholar]
- 34.Hirota Y. The effect of acridine dyes on mating type factors in Escherichia coli. Proc. Natl. Acad. Sci. USA. 1960;46:57–64. doi: 10.1073/pnas.46.1.57. [DOI] [PMC free article] [PubMed] [Google Scholar]
- 35.Wada C., Imai M., Yura T. Host control of plasmid replication: requirement for the sigma factor σ32 in transcription of mini-F replication initiator gene. Proc. Natl. Acad. Sci. USA. 1987;84:8849–8853. doi: 10.1073/pnas.84.24.8849. [DOI] [PMC free article] [PubMed] [Google Scholar]
- 36.Reference deleted in proof.
- 37.Cullum J., Collins J.F., Broda P. Factors affecting the kinetics of progeny formation with F′lac in Escherichia coli K12. Plasmid. 1978;1:536–544. doi: 10.1016/0147-619x(78)90010-0. [DOI] [PubMed] [Google Scholar]
- 38.Monod J. Hermann et Cie; Paris, France: 1942. Research on the Growth of Bacterial Cultures [Recherches sur la Croissance des Cultures Bacteriennes] [Google Scholar]
- 39.Gudnason H., Dufva M., Wolff A. Comparison of multiple DNA dyes for real-time PCR: effects of dye concentration and sequence composition on DNA amplification and melting temperature. Nucleic Acids Res. 2007;35:e127. doi: 10.1093/nar/gkm671. [DOI] [PMC free article] [PubMed] [Google Scholar]
- 40.Kingsman A., Willetts N. The requirements for conjugal DNA synthesis in the donor strain during F′lac transfer. J. Mol. Biol. 1978;122:287–300. doi: 10.1016/0022-2836(78)90191-2. [DOI] [PubMed] [Google Scholar]
- 41.Sezonov G., Joseleau-Petit D., D'Ari R. Escherichia coli physiology in Luria-Bertani broth. J. Bacteriol. 2007;189:8746–8749. doi: 10.1128/JB.01368-07. [DOI] [PMC free article] [PubMed] [Google Scholar]
- 42.Skurray R.A., Reeves P. Physiology of Escherichia coli K-12 during conjugation: altered recipient cell functions associated with lethal zygosis. J. Bacteriol. 1973;114:11–17. doi: 10.1128/jb.114.1.11-17.1973. [DOI] [PMC free article] [PubMed] [Google Scholar]
- 43.Skurray R.A., Reeves P. Characterization of lethal zygosis associated with conjugation in Escherichia coli K-12. J. Bacteriol. 1973;113:58–70. doi: 10.1128/jb.113.1.58-70.1973. [DOI] [PMC free article] [PubMed] [Google Scholar]
- 44.Simonsen L., Gordon D.M., Levin B.R. Estimating the rate of plasmid transfer: an end-point method. J. Gen. Microbiol. 1990;136:2319–2325. doi: 10.1099/00221287-136-11-2319. [DOI] [PubMed] [Google Scholar]
- 45.Gordon D.M. Rate of plasmid transfer among Escherichia coli strains isolated from natural populations. J. Gen. Microbiol. 1992;138:17–21. doi: 10.1099/00221287-138-1-17. [DOI] [PubMed] [Google Scholar]
- 46.Licht T.R., Christensen B.B., Molin S. Plasmid transfer in the animal intestine and other dynamic bacterial populations: the role of community structure and environment. Microbiology. 1999;145:2615–2622. doi: 10.1099/00221287-145-9-2615. [DOI] [PubMed] [Google Scholar]
- 47.Dusenbery D.B. Living at Micro Scale: The Unexpected Physics of Being Small. Harvard University Press; Cambridge, UK: 2009. Encounter rates; pp. 267–279. [Google Scholar]