

Abstract
Diffusion of molecules in the crowded and charged interior of the cell has long been of interest for understanding cellular processes. Here, we introduce a model system of hindered diffusion that includes both crowding and binding. In particular, we obtained the diffusivity of the positively charged protein, ribonuclease A (RNase), in solutions of dextrans of various charges (binding) and concentrations (crowding), as well as combinations of both, in a buffer of physiological ionic strength. Using fluorescence correlation spectroscopy, we observed that the diffusivity of RNase was unaffected by the presence of positively charged or neutral dextrans in the dilute regime but was affected by crowding at higher polymer concentrations. Conversely, protein diffusivity was significantly reduced by negatively charged dextrans, even at 0.4 μM (0.02% w/v) dextran. The diffusivity of RNase decreased with increasing concentrations of negative dextran, and the amount of bound RNase increased until it reached a plateau of ∼80% bound RNase. High salt concentrations were used to establish the electrostatic nature of the binding. Binding of RNase to the negatively charged dextrans was further confirmed by ultrafiltration.
Introduction
The intracellular environment of a typical cell is crowded with small molecules and soluble macromolecules, many of which are charged. One consequence of this crowded and charged environment is hindered solute diffusion, which has implications for virtually all intracellular processes, including metabolism, transport, and second-messenger signaling (1). Three main factors that affect diffusion have been identified: 1), the viscosity of the fluid phase; 2), binding to charged cytosolic constituents; and 3), collisions with both static and mobile intracellular components (crowding). The viscosity of the fluid phase has been reproducibly reported to be only 1.2–1.4 times that of free water, and hence is not viewed as a major contributor to hindered solute diffusivity (2). However, there is a considerable disparity among the reported data as to the relative contributions of crowding and nonspecific binding. This stems partly from the inability to decouple their individual contributions in the heterogeneous cell environment, and partly from the inherent drawbacks of the investigation techniques used (3).
Diffusion of charged proteins in solutions and in cells has been studied mainly via fluorescence recovery after photobleaching (FRAP) (4). Despite its usefulness, FRAP has several disadvantages, such as laser-induced photodamage and incomplete recovery or reversible photobleaching of fluorophores (5). Recently, NMR spectroscopy has also been employed to study molecular diffusion in solutions (6). Although this technique is very promising, its use in crowded solutions is currently limited due to short-lived 1H longitudinal magnetization as well as dominant background signals from the crowding agents. An alternative, noninvasive technique to quantitatively investigate diffusion is fluorescence correlation spectroscopy (FCS) (7). FCS has been used in a variety of systems to estimate diffusion of molecules in crowded media (8), and to examine various molecular interactions (9–11), including binding (12). Rusu et al. (13) used the amplitude of the autocorrelation function to study the binding of proteins to phospholipid vesicles. Michelman-Ribeiro et al. (14) performed FCS to measure binding in living cells, and used the dissociation constant as a fitting parameter in the autocorrelation function. However, few groups have used FCS to measure binding in conjunction with crowding.
Because FCS was originally employed to study translational diffusion of homogeneous particles in dilute solutions, the analysis of the autocorrelation function had to be adjusted to fit particle diffusion in more-complex media. In the general case, an empirical coefficient, α, is used to describe the underlying diffusion with α = 1 for simple diffusion, α > 1 for anomalous superdiffusion (e.g., a directed transport via motor proteins), and α < 1 for anomalous subdiffusion (e.g., restricted transport in a crowded environment, where a solute can be transiently caged by obstacles) (15). In the case of anomalous diffusion, as opposed to simple diffusion, the mean-square displacement of a solute will grow nonlinearly with respect to time. In fact, the degree of this nonlinearity has been adopted as a measure for the crowdedness of the cell cytoplasm (10). Nevertheless, this analysis provides little information about the particular reasons for the anomaly because crowding, binding, and increased system viscosity can all contribute to the value of α (16). Furthermore, it has been proposed that in the crowded cell environment, the diffusion time is not a fixed constant at all timescales and hence the anomalous diffusion can only describe spatial (and not heterogeneous (temporal)) randomness in cellular systems (17).
Another model, a two-component model represented by a fast and a slow component, has been used extensively to describe deviations from simple diffusion (18). This model is ideal for studying binding interactions if a solute binds to a larger molecule with a significantly longer diffusion time (the free molecule is the fast component of the model, and the bound complex is the slow one). The anomalous and two-component approaches for interpreting FCS data can describe intracellular diffusion equally well in the sense that they provide equivalently good fits to a given data set (19). However, due to intracellular heterogeneity, it is still challenging to discriminate between binding and crowding directly in the cell (20). Nevertheless, it is feasible to expect that in a well-defined experimental model, where a homogeneous crowder is used and where binding and crowding can be tuned independently, FCS can be used successfully to give information on both. Our goal in this study was to employ such an in vitro model to investigate the relative contributions of crowding and nonspecific binding to hindered solute diffusion. In our model, to avoid possible complications due to heterogeneity, the crowder and the binder are the same chemical species, namely, dextran. In addition, because in the cell environment diffusion of large molecules can be completely impaired by immobile obstacles, we focused on a small charged protein, namely, ribonuclease A (RNase). Further, we sought to validate our FCS results by using a different well-established method for studying binding, namely, ultrafiltration (21).
Materials and Methods
Chemicals
All reagents were acquired from Sigma (St. Louis, MO) unless otherwise noted.
Dex(N) (dextran from Leuconostoc ssp., 500 kDa; (N) stands for neutral charge), Dex(−) (dextran sulfate sodium salt from Leuconostoc ssp., 500 kDa; (−) stands for negative charge), Dex(+) (DEAE-dextran hydrochloride, 500 kDa; (+) stands for positive charge), and Dex(N)∗ (fluorescein isothiocyanate dextran 500000-conjugate, 500 kDa; ∗ stands for fluorescently labeled) were used as received. Only fluorescently labeled RNase (from bovine pancreas; net positive charge) was used throughout the study, therefore no ∗ is used for RNase.
Labeling of reagents
Dex(+)∗ was produced by labeling Dex(+) with Alexa 488 (Piercenet, Rockford, IL) according to the manufacturer's procedure (∗ stands for fluorescently labeled). Unbound fluorophore was removed with the use of dye removal columns (Thermo Scientific, Rockford, IL) with >95% efficiency. RNase was labeled with DyLight 488 (Thermo Scientific) according to the manufacturer's procedures with 60% labeling efficiency. Unbound fluorophore was removed with the use of dye removal columns with >95% efficiency. Fluorescently labeled succinylated RNase (scRNase) was also used in this study (see Supporting Material).
Preparation of samples
Stock solutions of 200 μM dextran were prepared by dissolving Dex(N), Dex(+), and Dex(−) in phosphate-buffered saline (PBS), pH 7.4. Stock solutions of 6 μM RNase and scRNase were similarly prepared. The stock solutions of dextrans and proteins were then diluted in PBS to achieve the desired final concentrations. In a typical FCS experiment, the concentrations were as follows: 0.2 μM for RNase, 0.35 μM for scRNase, 0.4 μM for fluorescent Dex(+)∗ and Dex(N)∗, and 0–100 μM for nonlabeled dextran. The solutions were then mixed and 50 μl samples were transferred to a CoverWell perfusion chamber (Molecular Probes, Carlsbad, CA) for FCS measurements. The chambers were sealed to avoid evaporation.
FCS theory
FCS measurements were used to characterize fluorescence fluctuations (due to Brownian motion) emitted from a small, illuminated volume of solution with nanomolar concentrations of fluorescent particles. These fluctuations contain information about the diffusion dynamics of the particles, including the average number of particles and their characteristic diffusion time. Analysis of the autocorrelation function, G(τ), provides information about the mechanisms underlying the intensity fluctuations. For an ideal case of freely diffusing monodisperse and uniformly bright fluorescent particles in a 3D Gaussian beam, the expression for G(τ) is (22):
| (1) |
where N is the average particle number in the detection volume, τ is the delay time, τd is the characteristic diffusion time, and is an instrumental constant (where ro and zo are the radius and axial length of the focused laser beam spot, respectively). Assuming a three-dimensional Gaussian profile of the excitation beam, τd can be related to diffusivity by the following equation:
| (2) |
If there are two independent diffusing species with equal brightness, such as free and bound RNase, G(τ) becomes
| (3) |
where f is the fraction of the signal that comes from the free RNase with a characteristic diffusion time of τd1, and τd2 is the characteristic diffusion time of the dextran-bound RNase. Because of the considerable difference in size between the free and bound RNase, one can easily distinguish the contribution of each species to the correlation function by fitting the experimental data to Eq. 3.
FCS measurements and data analysis
Measurements of RNase and Dex(+)∗ solutions containing up to 100 μM total dextran (Dex(+), Dex(−), or Dex(N)) were performed with an FCS instrument (Hamamatsu C9413; Hamamatsu, Shimokanzo, Japan) that utilizes confocal optics and a low-noise, solid-state laser (437 nm) for fluorescence excitation. The fluorescence intensity was measured with a photomultiplier tube with a GaAsP photocathode. Measurements were performed in PBS at 22°C. Acquisition times of 215 s were used to optimize the signal/noise ratio. The excitation laser beam was attenuated with neutral density filters (∼6–60 μW laser power) to avoid photobleaching and activation of the fluorophore triplet states. The radius of the laser beam spot, ro, was estimated to be ∼250 nm. The instrument was calibrated with Rhodamine 6G (D = 2.8 × 10⁻¹⁰ m2s−1 in water).
Two different models were fitted to the experimental data. The first was a single-component fit (Eq. 1), which assumes only one fluorescent component in the solution. This model was used to describe the diffusion of RNase in the absence of binding (e.g., in Dex(+) and Dex(N)). A single-component fit was also used to describe the diffusion of RNase in the presence of binding (in Dex(−)) to obtain a compound diffusion time. The second model, a two-component fit (Eq. 3), was used to describe RNase diffusion in the presence of binding, where the free and the bound RNase represented two independently diffusing species. To obtain the fit for G(τ) in this case, the diffusion time of the free RNase, τd1, was fixed as that of RNase in the corresponding crowder (Dex(N)) concentration. The diffusion time of the bound RNase, τd2, as well as the fractions f and (1 − f) of species with τd1 or τd2, where the sum of f and (1 − f) was always 100%, were used as fitting parameters. The percent bound RNase was obtained directly from the fit as the fraction (1 – f) of species with τd2. In all cases, the goodness of the fit was judged by inspecting the randomness of distribution of residuals.
Ultrafiltration
Ultrafiltration was performed with the use of Centricon Concentrators (MWCO 100,000 Da; Amicon, Billerica, MA); 500 μl solutions of RNase (0.2 μM) and predetermined concentrations of Dex(−), Dex(+), or Dex(N) up to 100 μM were placed in the sample reservoir. An ultrafiltrate containing free RNase was obtained by centrifugation at 800 × g and 22°C (Allegra X-22R Centrifuge; Beckman Coulter, Brea, CA) for 3–7 min (higher dextran concentrations required longer centrifugation times). In all cases, 20–25% of the initial sample volume was collected as ultrafiltrate. We did not impose any restrictions on the ultrafiltrate volume, because previous studies have shown that the binding equilibria remain constant during ultrafiltration (21). We assessed the concentration of free RNase by measuring the fluorescence emission at 518 nm (the peak emission for DyLight 488, λex.= 493 nm) of the ultrafiltrate aliquot (PC1 photon counting spectrofluorometer; ISS, Champaign, IL). The percent bound RNase was calculated as
| (4) |
where B is the total RNase concentration introduced into the system, and A is the free RNase concentration in the ultrafiltrate.
Statistical analysis
The results of all of the experiments are given as the mean values ± standard deviation (SD) obtained from multiple samples. FCS measurements were performed with triplicate samples in three independent experiments. For each sample, three to six measurements were taken at various positions within the sample. A single-factor analysis of variance was used for comparison among multiple samples, and a two-tailed Student's t-test was used for comparison between two samples. Differences between two data sets were considered significant when p < 0.05.
Results
In this work, we used FCS to assess the relative effects of binding and crowding on solute diffusivity. All measurements were performed in physiological salt concentrations (PBS, 0.15 M NaCl) unless otherwise noted.
Fig. 1 A shows the normalized autocorrelation functions, (G(τ) − 1)/(G(0) − 1), for 0.2 μM RNase in 2 μM solutions of Dex(−) and Dex(+). The autocorrelation function for RNase in Dex(+) exhibited a narrow decay and was described well by a single-component fit (Eq. 1) corresponding to simple diffusion, shown as a solid black line. Because RNase has a net positive charge, we expected electrostatic interactions to slow its diffusion in a solution of Dex(−). Indeed, we observed a broadening in the decay of the autocorrelation function at timescales corresponding to diffusion, indicating a wider distribution of diffusion times of RNase, as illustrated by the failure of a one-component fit (dashed black line) and nonrandom residuals (Fig. 1 B). Therefore, a two-component fit (Eq. 3), shown as a solid black line, was used to describe the data (the fast component corresponds to free RNase, and the slow one corresponds to bound RNase). The two-component model significantly improved the fit (Fig. 1 B). Nonetheless, the single-component fit provides a useful measure of the compound diffusivity of the protein (the averaged diffusivity of the free and the bound protein). For purposes of comparison, we normalized the diffusion times, τd, by dividing by τ0, the diffusion time in PBS. The inverse of this dimensionless quantity, τ0/τd, is equivalent to normalized diffusivity.
Figure 1.
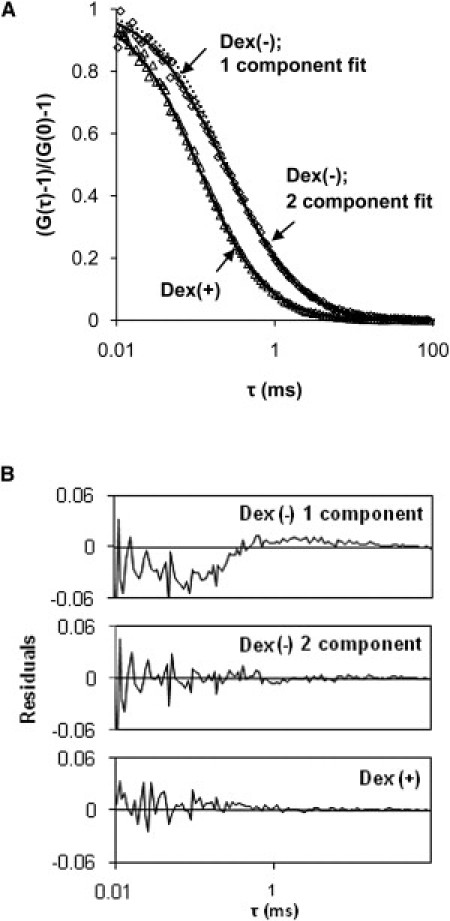
(A) Examples of normalized autocorrelation functions for 0.2 μM RNase in 2 μM solutions of Dex(−) and Dex(+). The correlation function for RNase in the Dex(+) solution is fitted with one component according to Eq. 1 (τd = 120 μs). The correlation function for RNase in the Dex(−) solution is fitted with two components according to Eq. 3 (τd = 500 μs for bound RNase, fixed τd = 120 μs for free RNase; the corresponding bound fraction of RNase f = 56%). A single-component fit (τd = 260 μs including free and bound RNase) is also shown for comparison. (B) The corresponding residuals emphasize the importance of the two-component fit when diffusion is influenced by binding.
We also used separate FCS measurements of RNase and dextran to determine the individual diffusion times. By fitting the data of the individual components to Eq. 1, we obtained diffusion times of ∼120 μs for RNase (D ∼ 1.3 × 10⁻⁶ cm2/s) and ∼610 μs for dextran (D ∼ 0.26 × 10⁻⁶ cm2/s), which are in good agreement with values from the literature (23,24). In both cases, the curves were well fitted to a single-component model, indicating monodisperse solutions. Representative diffusion times of RNase in PBS and various dextran solutions are summarized in Table 1.
Table 1.
Representative diffusion times of RNase (from one- or two-component fits) or Dex(+) in PBS (free) and dextran solutions of various charges and concentrations
| Fluorescent solute type and concentration | Nonfluorescent dextran type | Total dextran concentration | τd (ms) |
|---|---|---|---|
| RNase; 0.2 μM (from one-component fit) | n/a (PBS only) | n/a | 0.12 ± 0.00 |
| Dex(N) | 0.4 μM | 0.12 ± 0.01 | |
| 100 μM | 0.21 ± 0.01 | ||
| Dex(+) | 0.4 μM | 0.11 ± 0.01 | |
| 100 μM | 0.25 ± 0.03 | ||
| Dex(−) | 0.4 μM | 0.17 ± 0.01 | |
| 100 μM | 0.64 ± 0.02 | ||
| Bound RNase; 0.2 μM (from two-component fit) | Dex(−) | 0.4 μM | 0.59 ± 0.23; f = 30% |
| 100 μM | 0.81 ± 0.02; f = 81% | ||
| Dextran (+)∗; 0.4 μM | n/a (PBS only) | 0.4 μM | 0.61 ± 0.09 |
| (from one-component fit) | |||
| Dextran (+)∗; 0.4 μM | Dex(+) | 10 μM | 0.61 ± 0.04 |
| (from one-component fit) | 100 μM | 0.88 ± 0.20 |
f corresponds to percent Dex(−)-bound RNase (refer to Eq. 3).
Dextran charge and concentration both affect RNase diffusivity
To investigate the role of Dex(−) in RNase binding, we prepared solutions with increasing Dex(−) concentrations while maintaining a constant 0.2 μM RNase concentration. For comparison, we also prepared the same solutions with Dex(N) and Dex(+), where binding was not expected. In all cases, a one-component fit was used to describe the decrease in RNase compound diffusivity as a function of dextran concentration (Fig. 2 A). For the case of RNase in Dex(−), the average of the two diffusion times, fast (τd1) and slow (τd2) obtained from a two-component fit, weighted by their contribution to the experimental signal, f and 1 − f, also was used to describe RNase compound diffusivity: . An excellent agreement in the diffusivity data obtained via the two different methods was found (Fig. S1), and hence a single-component fit for RNase compound diffusivity was used throughout. For RNase in Dex(−), the compound diffusivity was as much as 80% lower than that of RNase in PBS alone, comparable to previous reports of four- to fivefold slower diffusivities of small molecules in the cell (4). In contrast, RNase diffusivity in dilute Dex(+) and Dex(N) solutions was very close to that in PBS (τ0/τd ≈ 1), although above a threshold concentration of Dex(+) or Dex(N) (10 μM or 0.5% w/v) the diffusivity of RNase decreased by as much as 50% for the highest concentration of Dex(+) and Dex(N) (100 μM or 5% w/v). This decrease in diffusivity in the absence of binding was attributed to collisions with the dextran, i.e., to crowding. We found that above the threshold dextran concentration, RNase diffusivity was inversely proportional to the concentration of the dextran crowder, following an exponential dependence, in good agreement with previous findings (25). For RNase in Dex(−), the normalized diffusivity for bound RNase, obtained from a two-component fit (Eq. 3), is also indicated. Similarly to RNase in the absence of binding, the normalized diffusivity of bound RNase remained unaltered up to a threshold concentration of 10 μM Dex(−), above which it decreased by ∼45% for the highest Dex(−) concentration of 100 μM.
Figure 2.
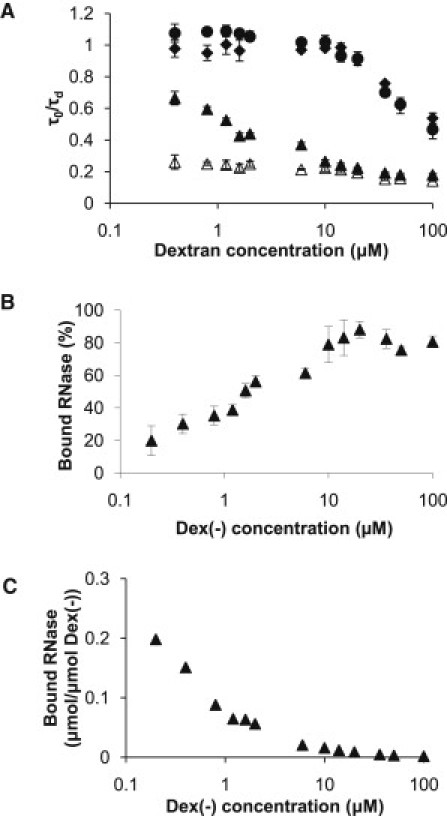
RNase diffusivity and binding. (A) Normalized diffusion times of 0.2 μM RNase in dextran solutions of indicated charges and concentrations. Binding of RNase to Dex(−) was responsible for the lower compound diffusivity in that solution. Normalized diffusion times, τ0/τd, were obtained from a single-component fit (Eq. 1) for RNase in a solution of ♦ Dex(N), ● Dex(+), or ▴ Dex(−). The normalized diffusion times, τ0/τd2, from a two-component fit (Eq. 3) for bound RNase in ▵ Dex(−) are also indicated. (B) Binding of RNase to Dex(−) was estimated from a two-component fit (Eq. 3). (C) Binding of RNase to Dex(−) on a molar basis, otherwise equivalent to the data in B, highlighting the fact that for the range of Dex(−) concentrations, always less than one molecule of RNase was bound per molecule of Dex(−). All data are the average ± SD (n = 9).
Further, we did not find a significant difference between RNase diffusivity in Dex(+) or Dex(N), indicating that no repulsive electrostatic interactions were at play. This finding was anticipated because 500 kDa dextran is a highly branched polymer with a diameter of 30 nm (26) and the RNase has a diameter of 4 nm (27). It has been shown that repulsive interactions hinder diffusion if the diameter of the same-charged polymer is comparable to the Debye length of the diffusing particle, but become insignificant when the polymer diameter increases (28). A decrease in RNase diffusivity in the absence of binding can also be linked directly to the bulk solution viscosity, as demonstrated by Zorrilla et al. (11). Therefore, we further considered the effect of the Dex(N) solution viscosity (data adopted from the literature (29)) on RNase diffusivity, and found that the decrease in RNase diffusivity was not explained by the increase in dextran solution viscosity (Fig. S2).
Free and bound RNase fractions were estimated directly from the fits of the autocorrelation curves according to Eq. 3. The two fractions were easily distinguished because bound RNase diffused more slowly and had a significantly longer (∼76%) diffusion time (Table 1). The fraction of bound RNase calculated from FCS data was plotted against the total Dex(−) concentration (Fig. 2 B). The data indicated that the saturation point for binding was at 20 μM (1% w/v) Dex(−), where ∼80% of RNase was bound. Half-maximum bound RNase was estimated to occur at 1.2 μM Dex(−). The binding data are also represented as μmol bound RNase per μmol Dex(−) (Fig. 2 C). The plot indicates that for all Dex(−) concentrations in the studied regime, an average of less than one RNase molecule was bound per Dex(−) molecule. Even for the lowest Dex(−) concentration of 0.2 μM, which was equivalent to the concentration of RNase, RNase was bound to only one of five Dex(−) molecules. This result was anticipated because of the low RNase concentration and the overall excess of Dex(−) used. The half-maximum bound RNase indicated a relatively strong binding affinity of RNase for Dex(−), which is supported by previous findings obtained via an independent chromatographic method (30).
To acquire more information about the influence of binding and crowding on RNase diffusivity, we probed regimes in which the concentration of the crowder was increased while the concentration of polymeric electric charges was kept constant or opposite charges were introduced (Fig. 3). RNase was kept at 0.2 μM for all measurements. We noted four distinct behaviors. First, the RNase diffusivity in a combination of Dex(+) and Dex(N) was similar to that of RNase in either of the two dextran solutions alone, because no binding was present. Hence, the dextrans behaved as crowders only. In comparison, the RNase diffusivity in solutions containing a combination of Dex(−) at 2 μM (0.1% w/v) and increasing Dex(N) (a crowder) showed an ∼60% decrease due to binding (τ0/τd = 0.4 at 2 μM Dex(N) and Dex(−)). A further gradual decrease in RNase diffusivity with an increase in Dex(N) concentration due to crowding was observed (20–25% from that at 4 μM to the final 40 μM dextran concentrations). A similar 25% decrease in RNase diffusivity was noted for fixed Dex(+) and varying Dex(N) between 4 and 40 μM. In the case where Dex(+) was fixed at 2 μM and Dex(−) increased, we observed an abrupt decrease in RNase diffusivity followed by a slow further decrease. In this case, the RNase diffusivity was unaffected by the crowder (as expected by its low concentration) but was strongly affected by binding to Dex(−).
Figure 3.
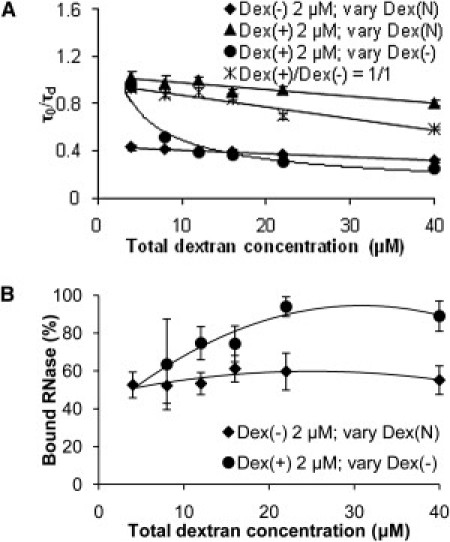
Combined effect of binding and crowding on RNase diffusivity. (A) Normalized diffusion times of 0.2 μM RNase in a combination of dextran solutions of indicated charges and concentrations. (B) Binding of RNase to Dex(−). All data are the average ± SD (n = 9). The lines are provided to guide the eye.
The most unexpected behavior was observed when equimolar ratios of oppositely charged dextrans were introduced. We noted a greater overall decrease in RNase diffusivity (compared to RNase diffusivity in the solution of Dex(+) at 2 μM and increasing concentration of Dex(N)), which, nonetheless, still showed a gradual inverse dependence on dextran concentration, suggesting that crowding rather than binding was responsible. Because it has been shown that probe diffusivity in crowded media is dependent on the size of the crowder (15), we would expect a 26% difference in diffusivity for a twofold difference in size. We indeed estimated that the decrease in RNase diffusivity was up to 27% compared with the case of Dex(+) alone. Thus, it is feasible that a complex between the two oppositely charged dextrans was formed. Fig. 3 B shows that the percent bound RNase was independent of crowder concentration when the charged dextran was kept constant, as in the solution of Dex(−) at 2 μM and increasing Dex(N). In contrast, the percent bound RNase increased when the concentration of oppositely charged dextran was increased, as in the case of Dex(+) at 2 μM and increasing Dex(−).
To further investigate the effect of charge and binding on the diffusivity of RNase, we converted the net charge of RNase from positive to negative via succinylation (see Supporting Material). We hypothesized that the diffusivity of the scRNase would be similar to that of RNase in the absence of binding, but it would bind to Dex(+) instead of Dex(−). We indeed observed similar diffusivities of the two proteins in the absence of binding, but the scRNase exhibited lower diffusivity than RNase in the presence of binding (Fig. S3), as well as a lower overall percent binding. These differences could be due to the unequal charge density on the Dex(+) and Dex(−), or on the native and succinylated RNase, as well as to a change in RNase conformation upon succinylation (31). Nevertheless, we confirmed our hypothesis that scRNase would bind to Dex(+) instead of Dex(−).
Increased ionic strength prevents electrostatic binding between RNase and Dex(−)
Most experiments were performed in PBS (0.15 M NaCl). However, we examined the effect of added salt on RNase binding to Dex(−) by incrementally increasing NaCl to a final total concentration of 1 M while maintaining a fixed amount of dextran (2 μM) and RNase (0.2 μM). We observed that the addition of NaCl (up to 0.3 M) led to an increase in RNase compound diffusivity and a decrease in binding to Dex(−) (Fig. 4), indicative of the electrostatic nature of the binding. At higher NaCl concentrations, the compound diffusivity of RNase in Dex(−) resembled that of RNase in Dex(+) and Dex(N). At the highest concentration of NaCl (1 M), we observed a 28% decrease (compared with 0.15 M NaCl) in RNase diffusivity for all dextran solutions, most likely due to increased solution viscosity (Fig. S4) (32).
Figure 4.
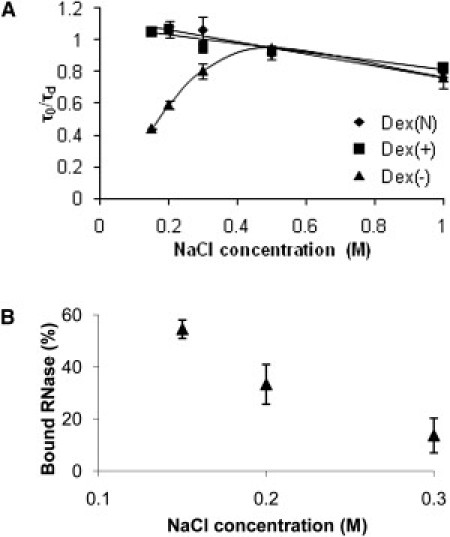
Increased ionic strength prevents electrostatic binding between RNase and Dex(−). (A) Normalized diffusion times of 0.2 μM RNase in 2 μM Dex(−) as a function of NaCl concentration. (B) Binding of RNase to Dex(−) as a function of NaCl concentration. All data are the average ± SD (n = 9). Note the difference in the abscissas between A and B.
We also confirmed the electrostatic nature of the binding between scRNase and Dex(+) by increasing the salt concentration, because bound scRNase was not observed at NaCl concentrations > 0.3 M (Fig. S5).
Diffusivities of fluorescent dextrans are similar to those of bound RNase
We used a nonfluorescent succinylated RNase (scRNase; net negative charge) in solutions of fluorescent Dex(N)∗ and Dex(+)∗ to compare the dextran diffusivities with that of RNase, and to evaluate the effect of bound scRnase on the diffusivity of Dex(+)∗ (Fig. 5). For all of the experiments, scRNase was 0.35 μM, Dex(N)∗ and Dex(+)∗ were 0.4 μM, and the total dextran concentration was varied as indicated on the graph by addition of nonfluorescent Dex(N) or Dex(+). We found that τd for dextran was similar to the τd for bound RNase (see Table 1), consistent with our interpretation that the observed slow component was dextran-bound RNase. Furthermore, if the protein acted as a cross-linker for dextran molecules, we would expect to see a difference in the diffusivity of Dex(+)∗ between solutions with or without scRNase. For example, if two Dex(+)∗ molecules were bound to one molecule of scRNase, the size of the diffusing polymer would double and we should see an ∼26% decrease in diffusivity compared with Dex(+)∗ without scRNase. However, we did not see significant differences between the two solutions, suggesting that the protein was not binding more than one Dex(+)∗ in the range of Dex(+)∗ concentrations studied. The diffusivity of dextran decreased with increase in its concentration in all four cases, consistent with crowding as observed earlier.
Figure 5.
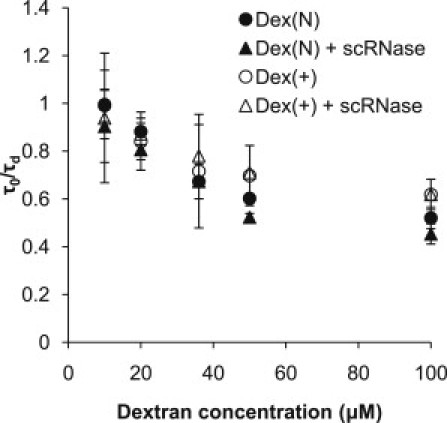
scRNase (net negative charge; see Supporting Material for details on scRNase) binds only one Dex(+)∗ at a time. The normalized diffusion times of 0.4 μM fluorescently labeled dextran in the presence or absence of 0.35 μM scRNase, as a function of total dextran concentration are shown. The data also show that the dextran diffusivities are similar to those of bound RNase (see Table 1). All data are the average ± SD (n = 12).
Ultrafiltration binding experiments validate FCS measurements
Finally, we tested the binding of 0.2 μM RNase to Dex(−) via ultrafiltration (Fig. 6 and Fig. S6) and observed that, consistent with our FCS findings, the percent bound RNase increased with an increase in Dex(−) concentration and reached a plateau at ∼10 μM (0.5% w/v) Dex(−), which corresponded to 80% bound RNase. We also estimated a half-maximum bound RNase of ∼1 μM. The saturation point and the half-maximum bound RNase estimated via FCS and ultrafiltration were in excellent agreement with each other.
Figure 6.
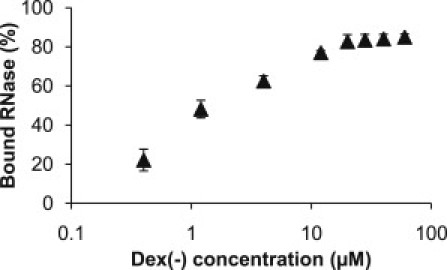
Ultrafiltration validation of FCS measurements. The percentage of RNase bound to Dex(−) is shown as a function of total Dex(−) concentration. 0.2 μM RNase was used. All data are the average ± SD (n = 3).
Discussion
The cell cytoplasm has different levels of organization and a mesh size of tens of nanometers (33). Although immobile obstacles completely hinder the diffusion of particles with radius >30 nm (34), they are not expected to completely obstruct the diffusion of small proteins (35). On the other hand, the cytoplasm is filled with soluble molecules up to 30% w/v, many of which are charged (36). Hence, it is expected that both transient binding and crowding would have a major effect on the diffusion of charged particles. Indeed, an increasing amount of experimental evidence suggests that reversible rather than nonreversible binding interactions are key steps of signal transmission processes in cells (37). However, although many investigations have focused on the effects of crowding on molecule diffusion in the cell (3), few have addressed the effects of reversible binding independently (38) or in conjunction with crowding (20).
Our goal in this study was to devise a simplified model capable of emulating, in a controlled manner, the diffusion of intracellular molecules to investigate the relative contributions of binding and crowding on hindered diffusion. We did not seek to precisely mimic the crowded cell environment; instead, like Li et al. (6), we chose to work in dilute and semidilute regimes that provide reasonable crowding conditions without introducing heterogeneity due to overlap of polymer chains. Still, the majority of in vitro studies related to crowding have examined only the regime above 10 μM polymer. Therefore, by shifting our study to very dilute solutions (<10 μM) and extending it to the semidilute regime, we encompassed polymer concentrations that have rarely been covered in the literature.
Our strategy was to examine the transport of a positively charged protein, RNase, and how it is influenced by binding and crowding due to the presence of dextran, a branched random-coil polymer. For all FCS experiments, RNase was kept at a low 0.2 μM concentration, i.e., conditions under which the dextran was in excess. Further, a low RNase concentration was used to optimize the photon count and to avoid aggregation that has been shown to occur at higher concentrations (39). RNase was also chosen because of its relatively small size. Various authors have speculated that large proteins within the cytoplasm are likely to exist as part of a complex, and consequently would have a greatly reduced diffusion rate. Small molecules, on the other hand, are expected to move between various active sites predominantly via diffusion (1). We used dextrans of high molecular mass to optimize the difference in diffusion times between the free and bound components, because it has been shown that to be distinguishable, diffusion times should differ by at least a factor of 1.6, corresponding to a fourfold molecular mass difference for spherical particles (40).
To analyze binding of RNase to Dex(−), we performed a titration of Dex(−) to a solution of a fixed RNase concentration (Fig. 2). Upon binding, the RNase diffused more slowly. Both the bound and unbound proteins contributed to the autocorrelation function with amplitude corresponding to their fractional presence, and both components were assumed to have the same molecular brightness. We obtained the diffusion time of the bound RNase by applying a two-component fit (Eq. 3) and keeping the τd of the free RNase fixed. A binding plateau was reached at ∼20 μM Dex(−), and half-maximum RNase binding occurred at 1.2 μM Dex(−), indicating tight binding between the two.
We estimated that binding was responsible for a 75% decrease in RNase diffusivity in the studied regime, because at the Dex(−) concentration where binding saturation occurred, the normalized compound diffusivity of RNase was 0.26 compared with 0.98 for RNase in Dex(N) of the same concentration. This finding differs from measurements obtained by Kao et al. (4) in a fluorophore diffusing in the cell cytoplasm, which indicated that binding accounted for only 20% of the total decrease in diffusivity. However, our experimental conditions involved crowder concentrations that were lower than those found in the cell but high enough to exert a noticeable impact. For example, the highest dextran concentration used in this study was 100 μM (5% w/v), whereas in the cell cytoplasm solids account for 13–30% w/v. Therefore, we expected a lower impact of crowding on protein diffusivity than in cells. The low concentration of crowder allowed us to apply the equation for simple diffusion (Eq. 1) and to achieve a good fit for the autocorrelation function as judged by analysis of the residuals. Our use of simple diffusion for the chosen dextran concentration range is further justified by independent studies in similar systems: For example, by fitting FCS data to an anomalous diffusion model, Weiss et al. (10) obtained an exponent α ∼ 1, indicative of simple diffusion, for similar dextran concentrations.
We made several important observations regarding the relative contributions of binding and crowding for the dilute and semidilute regimes studied. First, in the dilute regime (<10 μM Dex(+) or Dex(N)), the crowder did not affect RNase diffusivity, as indicated by τ0/τd ∼ 1. In contrast, for the same regime in the Dex(−) solution, RNase diffusivity was reduced by up to 80% due to binding. Moreover, even at the lowest Dex(−) concentration (0.2 μM), diffusivity was decreased significantly compared with that in PBS. As shown in Fig. 2, A and B, we also observed that binding reached a plateau at 20 μM Dex(−). However, in the semidilute solutions of Dex(N) and Dex(+) (between 10 μM and 100 μM crowder), the diffusivity of RNase was decreased by as much as 50% for the highest dextran concentration. Similar crowding effects were observed on the bound fraction of RNase in the Dex(−) solution (Fig. 2 A). At low Dex(−) concentration (<14 μM), the diffusivity of bound RNase remained constant, albeit fourfold lower than that of RNase alone, due to its larger size. Above 14 μM Dex(−), the diffusivity of bound RNase decreased by as much as 45% for 100 μM Dex(−). These results are in excellent agreement with diffusion data obtained via holographic interferometry (29), which showed that the BSA diffusivity decreased by 50% in the presence of 5% dextran, independently of dextran molecular mass. Also, when only crowding was present in Dex(N) and Dex(+), the diffusivity of RNase decreased exponentially above a threshold dextran concentration (10 μM). This was an expected behavior because in crowded polymer solutions, the diffusivity of a solute can be represented as D/D0 = τ/τ0 = exp(−βCn), where C is the polymer concentration, and β and n are adjustable parameters (26). For a simple exponential (n = 1), we estimated β = 0.14 for Dex(N) and 0.17 for Dex(+), which are in agreement with literature values (26). In Dex(−) solutions where binding was mainly responsible for the decrease in RNase diffusivity, the decrease followed a saturation curve. Further analysis revealed that 100 μM crowder, compared with 1 μM binder, was needed to achieve an equivalent reduction in RNase diffusivity (Fig. 2 A). These data highlight the importance of nonspecific binding and the tremendous impact it has on protein diffusivity even at very low binder concentrations. They also suggest that even though binding is easily distinguishable at low crowder concentrations, it could be indistinguishable when the solid concentrations are close to those found in the cell.
In addition, we considered the impact of solution viscosity on the diffusivity of RNase in Dex(N) (Fig. S2). For spherical proteins in homogeneous solutions where the protein is larger than the crowder, diffusion is related to viscosity via the Stokes-Einstein law: D = kT/6πηr, where k is the Boltzmann constant, T is temperature, η is viscosity, and r is the protein hydrodynamic radius. However, these criteria do not apply to crowded polymer solutions where the crowder is significantly larger than the protein, as in this study, and hence macromolecular crowding caused deviations from the above relationship. Predictably, we observed a significant negative deviation as evidenced by the nonlinear fit of the data in Fig. S2, indicating that the viscosity of the solution decreased RNase diffusivity less than predicted by the Stokes-Einstein law. This finding is in excellent agreement with previous studies (6,11).
Next, we validated our assumption of nonspecific electrostatic binding of RNase to Dex(−) by incremental additions of salt (Fig. 4). When the salt concentration of the solution was increased, the binding of RNase to Dex(−) decreased and eventually completely disappeared. We therefore deduced that high salt concentrations serve to shield the charges of Dex(−) and reduce the affinity of RNase binding (41).
We also validated binding by obtaining measurements of fluorescent dextrans diffusing in solutions of increasing concentrations of nonfluorescent dextrans (Fig. 5). We confirmed that τd for dextran correlated well with τd for dextran-bound RNase (Table 1). Overall, τd for dextran at the highest total dextran concentration was more than three times lower than that seen in the cell, possibly due to the difference in crowder concentrations. For example, in the cytoplasm of HeLa cells (∼13% solids), Weiss et al. (10) measured τd ∼3 ms for 500 kDa Dex(N) (radius of the illuminated FCS volume, ro ∼210 nm), in contrast to ∼0.9 ms at the highest 5% w/v crowder concentration used in this work. The higher value of τd in vivo could also be due to the sieving effect of the cytoskeleton on molecules ≥500 kDa, which can lead to such molecules becoming become completely trapped (34,42).
Finally, because comparative data for the above techniques are not widely available, we sought to validate our results using a different, well-established method, namely, ultrafiltration (Fig. 6). We noted an excellent agreement between the data for binding of RNase to Dex(−) as determined by FCS and ultrafiltration. Overall, it is beneficial to employ and compare various techniques, because a true understanding of the diffusion of charged particles in crowded and charged media will be reached only when multiple approaches lead to the same answer.
In summary, we have shown that reversible nonspecific binding had a significant effect on protein diffusivity even in the dilute regime, whereas crowding affected diffusivity only after a threshold crowder concentration was reached. In the dilute and semidilute regimes, binding was responsible for 75% of the overall decrease in protein diffusivity, and crowding was responsible for 25%. However, the data suggest that at a second threshold of crowder concentration (possibly close to that of the cell), crowding can mask the effect of binding, which implies that it may be challenging to distinguish between crowding and binding in vivo. Therefore, a simplified, tunable and robust in vitro model of the intracellular environment, such as the one used in this study, in which binding and crowding are tuned independently, will be a useful tool to gain insight into molecular transport implicated in key cellular processes.
Acknowledgments
This work was supported by funds from the Intramural Research Program of the Eunice Kennedy Shriver National Institute of Child Health and Human Development, National Institutes of Health.
Supporting Material
References
- 1.Zimmerman S.B., Minton A.P. Macromolecular crowding: biochemical, biophysical, and physiological consequences. Annu. Rev. Biophys. Biomol. Struct. 1993;22:27–65. doi: 10.1146/annurev.bb.22.060193.000331. [DOI] [PubMed] [Google Scholar]
- 2.Fushimi K., Verkman A.S. Low viscosity in the aqueous domain of cell cytoplasm measured by picosecond polarization microfluorimetry. J. Cell Biol. 1991;112:719–725. doi: 10.1083/jcb.112.4.719. [DOI] [PMC free article] [PubMed] [Google Scholar]
- 3.Verkman A.S. Solute and macromolecule diffusion in cellular aqueous compartments. Trends Biochem. Sci. 2002;27:27–33. doi: 10.1016/s0968-0004(01)02003-5. [DOI] [PubMed] [Google Scholar]
- 4.Kao H.P., Abney J.R., Verkman A.S. Determinants of the translational mobility of a small solute in cell cytoplasm. J. Cell Biol. 1993;120:175–184. doi: 10.1083/jcb.120.1.175. [DOI] [PMC free article] [PubMed] [Google Scholar]
- 5.Reits E.A., Neefjes J.J. From fixed to FRAP: measuring protein mobility and activity in living cells. Nat. Cell Biol. 2001;3:E145–E147. doi: 10.1038/35078615. [DOI] [PubMed] [Google Scholar]
- 6.Li C., Wang Y., Pielak G.J. Translational and rotational diffusion of a small globular protein under crowded conditions. J. Phys. Chem. B. 2009;113:13390–13392. doi: 10.1021/jp907744m. [DOI] [PMC free article] [PubMed] [Google Scholar]
- 7.Hess S.T., Huang S., Webb W.W. Biological and chemical applications of fluorescence correlation spectroscopy: a review. Biochemistry. 2002;41:697–705. doi: 10.1021/bi0118512. [DOI] [PubMed] [Google Scholar]
- 8.Zorrilla S., Lillo M.P. Quantitative investigation of biomolecular interactions in crowded media by fluorescence spectroscopy, a good choice. Curr. Protein Pept. Sci. 2009;10:376–387. doi: 10.2174/138920309788922225. [DOI] [PubMed] [Google Scholar]
- 9.Zustiak S.P., Boukari H., Leach J.B. Solute diffusion and interactions in cross-linked poly(ethylene glycol) hydrogels studied by fluorescence correlation spectroscopy. Soft Matter. 2010;6:3609–3618. doi: 10.1039/C0SM00111B. [DOI] [PMC free article] [PubMed] [Google Scholar]
- 10.Weiss M., Elsner M., Nilsson T. Anomalous subdiffusion is a measure for cytoplasmic crowding in living cells. Biophys. J. 2004;87:3518–3524. doi: 10.1529/biophysj.104.044263. [DOI] [PMC free article] [PubMed] [Google Scholar]
- 11.Zorrilla S., Hink M.A., Lillo M.P. Translational and rotational motions of proteins in a protein crowded environment. Biophys. Chem. 2007;125:298–305. doi: 10.1016/j.bpc.2006.09.003. [DOI] [PubMed] [Google Scholar]
- 12.Clamme J.P., Azoulay J., Mély Y. Monitoring of the formation and dissociation of polyethylenimine/DNA complexes by two photon fluorescence correlation spectroscopy. Biophys. J. 2003;84:1960–1968. doi: 10.1016/S0006-3495(03)75004-8. [DOI] [PMC free article] [PubMed] [Google Scholar]
- 13.Rusu L., Gambhir A., Rädler J. Fluorescence correlation spectroscopy studies of peptide and protein binding to phospholipid vesicles. Biophys. J. 2004;87:1044–1053. doi: 10.1529/biophysj.104.039958. [DOI] [PMC free article] [PubMed] [Google Scholar]
- 14.Michelman-Ribeiro A., Mazza D., McNally J.G. Direct measurement of association and dissociation rates of DNA binding in live cells by fluorescence correlation spectroscopy. Biophys. J. 2009;97:337–346. doi: 10.1016/j.bpj.2009.04.027. [DOI] [PMC free article] [PubMed] [Google Scholar]
- 15.Banks D.S., Fradin C. Anomalous diffusion of proteins due to molecular crowding. Biophys. J. 2005;89:2960–2971. doi: 10.1529/biophysj.104.051078. [DOI] [PMC free article] [PubMed] [Google Scholar]
- 16.Sanabria H., Kubota Y., Waxham M.N. Multiple diffusion mechanisms due to nanostructuring in crowded environments. Biophys. J. 2007;92:313–322. doi: 10.1529/biophysj.106.090498. [DOI] [PMC free article] [PubMed] [Google Scholar]
- 17.Baumann G., Place R.F., Földes-Papp Z. Meaningful interpretation of subdiffusive measurements in living cells (crowded environment) by fluorescence fluctuation microscopy. Curr. Pharm. Biotechnol. 2010;11:527–543. doi: 10.2174/138920110791591454. [DOI] [PMC free article] [PubMed] [Google Scholar]
- 18.Schwille P., Korlach J., Webb W.W. Fluorescence correlation spectroscopy with single-molecule sensitivity on cell and model membranes. Cytometry. 1999;36:176–182. doi: 10.1002/(sici)1097-0320(19990701)36:3<176::aid-cyto5>3.0.co;2-f. [DOI] [PubMed] [Google Scholar]
- 19.Wachsmuth M., Waldeck W., Langowski J. Anomalous diffusion of fluorescent probes inside living cell nuclei investigated by spatially-resolved fluorescence correlation spectroscopy. J. Mol. Biol. 2000;298:677–689. doi: 10.1006/jmbi.2000.3692. [DOI] [PubMed] [Google Scholar]
- 20.Konopka M.C., Shkel I.A., Weisshaar J.C. Crowding and confinement effects on protein diffusion in vivo. J. Bacteriol. 2006;188:6115–6123. doi: 10.1128/JB.01982-05. [DOI] [PMC free article] [PubMed] [Google Scholar]
- 21.Ormö M., Sjöberg B.M. An ultrafiltration assay for nucleotide binding to ribonucleotide reductase. Anal. Biochem. 1990;189:138–141. doi: 10.1016/0003-2697(90)90059-i. [DOI] [PubMed] [Google Scholar]
- 22.Magde D., Elson E.L., Webb W.W. Fluorescence correlation spectroscopy. II. An experimental realization. Biopolymers. 1974;13:29–61. doi: 10.1002/bip.1974.360130103. [DOI] [PubMed] [Google Scholar]
- 23.Walters R.R., Graham J.F., Anderson D.J. Protein diffusion coefficient measurements by laminar flow analysis: method and applications. Anal. Biochem. 1984;140:190–195. doi: 10.1016/0003-2697(84)90152-0. [DOI] [PubMed] [Google Scholar]
- 24.Lebrun L., Junter G.A. Diffusion of sucrose and dextran through agar gel membranes. Enzyme Microb. Technol. 1993;15:1057–1062. doi: 10.1016/0141-0229(93)90054-6. [DOI] [PubMed] [Google Scholar]
- 25.Dauty E., Verkman A.S. Molecular crowding reduces to a similar extent the diffusion of small solutes and macromolecules: measurement by fluorescence correlation spectroscopy. J. Mol. Recognit. 2004;17:441–447. doi: 10.1002/jmr.709. [DOI] [PubMed] [Google Scholar]
- 26.Goins A.B., Sanabria H., Waxham M.N. Macromolecular crowding and size effects on probe microviscosity. Biophys. J. 2008;95:5362–5373. doi: 10.1529/biophysj.108.131250. [DOI] [PMC free article] [PubMed] [Google Scholar]
- 27.Tong J., Anderson J.L. Partitioning and diffusion of proteins and linear polymers in polyacrylamide gels. Biophys. J. 1996;70:1505–1513. doi: 10.1016/S0006-3495(96)79712-6. [DOI] [PMC free article] [PubMed] [Google Scholar]
- 28.Stylianopoulos T., Poh M.Z., Jain R.K. Diffusion of particles in the extracellular matrix: the effect of repulsive electrostatic interactions. Biophys. J. 2010;99:1342–1349. doi: 10.1016/j.bpj.2010.06.016. [DOI] [PMC free article] [PubMed] [Google Scholar]
- 29.Kosar T.F., Phillips R.J. Measurement of protein diffusion in dextran solutions by holographic interferometry. AIChE J. 1995;41:701–711. [Google Scholar]
- 30.Anderot M., Nilsson M., Isaksson R. Determination of dissociation constants between polyelectrolytes and proteins by affinity capillary electrophoresis. J. Chromatogr. B Analyt. Technol. Biomed. Life Sci. 2009;877:892–896. doi: 10.1016/j.jchromb.2009.02.021. [DOI] [PubMed] [Google Scholar]
- 31.Hollecker M., Creighton T.E. Effect on protein stability of reversing the charge on amino groups. Biochim. Biophys. Acta. 1982;701:395–404. doi: 10.1016/0167-4838(82)90243-6. [DOI] [PubMed] [Google Scholar]
- 32.Jena S.S., Bloomfield V.A. Probe diffusion in concentrated polyelectrolyte solutions: effect of background interactions on competition between electrostatic and viscous forces. Macromolecules. 2005;38:10551–10556. [Google Scholar]
- 33.Luby-Phelps K. Physical properties of cytoplasm. Curr. Opin. Cell Biol. 1994;6:3–9. doi: 10.1016/0955-0674(94)90109-0. [DOI] [PubMed] [Google Scholar]
- 34.Seksek O., Biwersi J., Verkman A.S. Translational diffusion of macromolecule-sized solutes in cytoplasm and nucleus. J. Cell Biol. 1997;138:131–142. doi: 10.1083/jcb.138.1.131. [DOI] [PMC free article] [PubMed] [Google Scholar]
- 35.Nöppert A., Gast K., Damaschun G. Reduced-denatured ribonuclease A is not in a compact state. FEBS Lett. 1996;380:179–182. doi: 10.1016/0014-5793(96)00048-8. [DOI] [PubMed] [Google Scholar]
- 36.Libicki S.B., Salmon P.M., Robertson C.R. The effective diffusive permeability of a nonreacting solute in microbial cell aggregates. Biotechnol. Bioeng. 1988;32:68–85. doi: 10.1002/bit.260320111. [DOI] [PubMed] [Google Scholar]
- 37.Teruel M.N., Meyer T. Translocation and reversible localization of signaling proteins: a dynamic future for signal transduction. Cell. 2000;103:181–184. doi: 10.1016/s0092-8674(00)00109-4. [DOI] [PubMed] [Google Scholar]
- 38.Hammond G.R., Sim Y., Irvine R.F. Reversible binding and rapid diffusion of proteins in complex with inositol lipids serves to coordinate free movement with spatial information. J. Cell Biol. 2009;184:297–308. doi: 10.1083/jcb.200809073. [DOI] [PMC free article] [PubMed] [Google Scholar]
- 39.Zorrilla S., Jiménez M., Minton A.P. Sedimentation equilibrium in a solution containing an arbitrary number of solute species at arbitrary concentrations: theory and application to concentrated solutions of ribonuclease. Biophys. Chem. 2004;108:89–100. doi: 10.1016/j.bpc.2003.10.012. [DOI] [PubMed] [Google Scholar]
- 40.Meseth U., Wohland T., Vogel H. Resolution of fluorescence correlation measurements. Biophys. J. 1999;76:1619–1631. doi: 10.1016/S0006-3495(99)77321-2. [DOI] [PMC free article] [PubMed] [Google Scholar]
- 41.Tan Z.J., Chen S.J. Electrostatic correlations and fluctuations for ion binding to a finite length polyelectrolyte. J. Chem. Phys. 2005;122:44903. doi: 10.1063/1.1842059. [DOI] [PMC free article] [PubMed] [Google Scholar]
- 42.Dauty E., Verkman A.S. Actin cytoskeleton as the principal determinant of size-dependent DNA mobility in cytoplasm: a new barrier for non-viral gene delivery. J. Biol. Chem. 2005;280:7823–7828. doi: 10.1074/jbc.M412374200. [DOI] [PubMed] [Google Scholar]
Associated Data
This section collects any data citations, data availability statements, or supplementary materials included in this article.