Abstract
A key pathway that controls both cell division and differentiation in animal cells is mediated by the retinoblastoma (RB) family of tumor suppressors, which gate the passage of cells from G1 to S and through S phase. The role(s) of the RB pathway in plants are not yet clearly defined, nor has there been any evidence for its presence in unicellular organisms. Here we have identified an RB homolog encoded by the mat3 gene in Chlamydomonas reinhardtii, a unicellular green alga in the land plant lineage. Chlamydomonas cells normally grow to many times their original size during a prolonged G1 and then undergo multiple alternating rounds of S phase and mitosis to produce daughter cells of uniform size. mat3 mutants produce small daughter cells and show defects in two size-dependent cell cycle controls: They initiate the cell cycle at a below-normal size, and they undergo extra rounds of S phase/mitosis. Unlike mammalian RB mutants, mat3 mutants do not have a shortened G1, do not enter S phase prematurely, and can exit the cell cycle and differentiate normally, indicating that the RB pathway in Chlamydomonas has a different role than in animals.
Keywords: RB, cell size, cell cycle, plant, mat3
Coordination of cell growth and division is crucial for performing the developmental programs of eukaryotic organisms. Cell size is a key determinant of progression through the cell cycle (Edgar et al. 1986; Hayles and Nurse 1986) and can also play a role in differentiation (Kirk et al. 1993), but it is not well understood how cells assess their size and transfer this information to the cell cycle control system (Neufeld and Edgar 1998).
The cell cycle of the unicellular green flagellate, Chlamydomonas reinhardtii, is typical of a large group of algae that divide by a multiple fission mechanism (Pickett-Heaps 1975). Vegetative Chlamydomonas cells undergo a prolonged G1 phase, during which cells can grow to many times their original size. They then undergo n rounds of rapidly alternating S phase and mitosis (Coleman 1982) to produce 2n daughters of uniform size (Craigie and Cavalier-Smith 1982; Donnan and John 1983).
Previous studies with Chlamydomonas have identified a G1 parameter termed “commitment,” equivalent to “Start” in yeasts or the “restriction point” in mammalian cells, which is defined as the point at which withdrawal of nutrients and/or light will not prevent the completion of at least one round of cell division (Spudich and Sager 1980; Donnan and John 1983). Following commitment, cells maintained in nutrients and light can continue to increase in size for ∼5–8 more hours before DNA replication and mitosis begin (Craigie and Cavalier-Smith 1982; Donnan and John 1983). A second size-based control mechanism then ensures that mother cells undergo the correct number of S phases and mitoses to produce daughter cells with a uniform size distribution (Craigie and Cavalier-Smith 1982; Donnan and John 1983). Thus, in each cell cycle cells must make two size-dependent decisions: whether to divide and, if so, how many times to divide. Chlamydomonas mutants that alter these decisions could yield insights on the relationship between cell size and cell cycle control.
mat3 mutants are linked to the mating type locus and were identified originally because they disrupt uniparental inheritance of chloroplast DNA (Gillham et al. 1987). Later, it was determined that the organelle inheritance phenotype in mat3 strains is a secondary consequence of a small-cell-size phenotype that leads to a reduced amount of organellar DNA (Armbrust et al. 1995). Previously isolated UV-induced alleles of mat3 (mat3-1, mat3-2, and mat3-3) are suppressed rapidly by extragenic mutations, precluding their detailed characterization (Armbrust et al. 1995).
In this work we have isolated a stable deletion allele of mat3 and have complemented it by transformation. Sequencing reveals mat3 to encode the Chlamydomonas homolog of the retinoblastoma protein (RB). We show that loss of Mat3p/RB in Chlamydomonas leads to defects in two size-dependent cell cycle decisions. mat3 mutant cells commit to division at an abnormally small size in G1 and also undergo too many rounds of division during S phase and mitosis. Interestingly, the characteristic phenotypes of mammalian RB mutants, a shortened G1 and premature entry into S phase, are absent in mat3 mutants; they retain normal temporal control of the cell cycle and can cease dividing and differentiate into gametes in response to nitrogen starvation.
Results
Identification and cloning of the mat3 gene
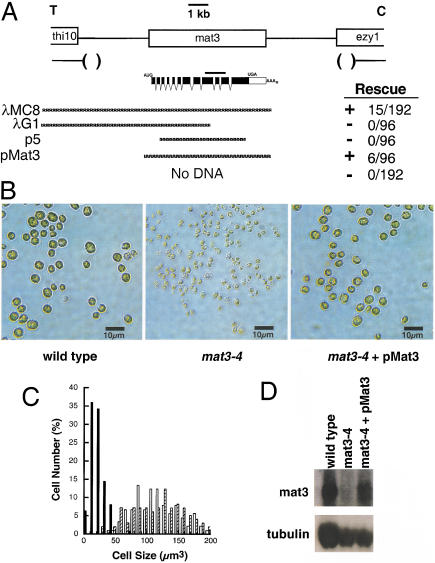
In screening a collection of insertional mutants (see Materials and Methods), one isolate displayed the characteristic small-cell-size phenotype and mating type locus linkage of mat3 mutants (Fig. 1A,B). An ∼15-kb chromosomal deletion is associated with the mutagenic insertion event in this mat3 strain (mat3-4) in a region of the mating type locus that is common to both plus (mt+) and minus (mt−) mating types (Fig. 1A; Ferris and Goodenough 1994). Unlike alleles identified previously, the mat3-4 cell size phenotype is stable in culture, allowing us to screen for rescue of the size defect by transformation. A mat3-4 nit1-305 (nitrate reductase mutant) strain was constructed and used for cotransformational rescue with a nit1 plasmid (Kindle 1990) and phage or plasmid clones spanning the mat3-4 deletion. Transforming DNA integrates randomly in Chlamydomonas, and because cotransforming DNA often integrates along with the selectable marker, we could select nit+ transformants on nitrate-containing plates and then screen visually for rescue of the mat3-4 small size phenotype. Rescue of the small size phenotype was seen only when the cotransforming DNA included a 6.5-kb region of phage or plasmid that lies within the mat3-4 deletion (Fig. 1A,B).
Figure 1.
Characterization and complementation of mat3-4 deletion. (A) Structure of the mat3 locus showing locations of flanking genes thi10 and ezy1 and the relative orientation to the linkage group VI centromere (C) and telomere (T) (Ferris and Goodenough 1994). The extent of the mat3-4 deletion is indicated below with the approximate location of the endpoints indicated by parentheses. The mat3 transcription unit is denoted with coding regions in black and locations of initiator (AUG), terminator (UGA), and polyadenylation sites (AAAn) labeled. The location of a 1-kb cDNA probe used for Northern blotting is shown as a black bar above the transcript. Clones used for cotransformational rescue are indicated below the transcript map by stippled lines, with numbers of transformants rescued/number screened and ability to rescue (+ or −) indicated to the right. (B) Photomicrographs of gametes from wild type, mat3-4, and mat3-4 following transformational rescue by pMat3. (C) Size distribution of cells from a wild-type strain (open bars), mat3-4 strain (black bars), and a mat3-4 strain that has been rescued by transformation with pMat3 (hatched lines). (D) Northern blot of total RNA from a wild-type strain, mat3-4, and mat3-4 that has been rescued with pMat3. The upper panel has been probed with the cDNA diagrammed in panel A. The lower panel is the same blot reprobed with a Chlamydomonas β-tubulin cDNA as a control for loading and RNA integrity.
The 6.5-kb rescuing region was subcloned from a mt−-derived phage to generate pMat3 (see Materials and Methods), and the entire insert was sequenced. A coding region of ∼4 kb is predicted from the sequence, and the positions of introns and the 5′ and 3′ ends were confirmed by RT–PCR and RACE. Northern analysis using a cDNA probe indicates a low-abundance message of ∼4.5 kb (Fig. 1D). This message is absent from mat3-4 strains but is restored in a rescued strain in which the cell size distribution profile is indistinguishable from that of wild type (Fig. 1B,C; Table 1). Southern hybridization to Chlamydomonas DNA with a mat3 cDNA probe failed to detect any other copies in the genome, even at reduced stringency (data not shown). Thus, mat3 appears to be a single-copy gene.
Table 1.
Cell size, division and growth characteristics of wild type and mat3-4
| Strain
|
Daughter cell
size, μm3 (±S.D.)
|
Daughter cell protein
content, pg/cell
(±S.D.)
|
Average division number
|
Minimum commitment
size, μm3 (±S.D.)
|
Mass doubling time
(h)
|
|---|---|---|---|---|---|
| wild type | 113 ± 37 | 22 ± 2 | 1.6 | 178 ± 10 | 6.5 |
| mat3-4 | 23 ± 10 | 5.1 ± 0.3 | 2.6 | 110 ± 12 | 6.8 |
| mat3-4 + pMat3 | 115 ± 41 | 21 ± 2 | 1.6 | N.D. | N.D. |
Data for wild-type, mat3-4, and complemented mat3-4(+pMat3) strains. Daughter cell size and protein content was determined for gametes. Average division number was determined for cells grown exponentially in continuous light and then shifted to the dark as in Figure 3. Minimum commitment size was determined as described in Materials and Methods. Doubling time is for cells growing exponentially in continuous light.
Homology between mat3 and RB genes
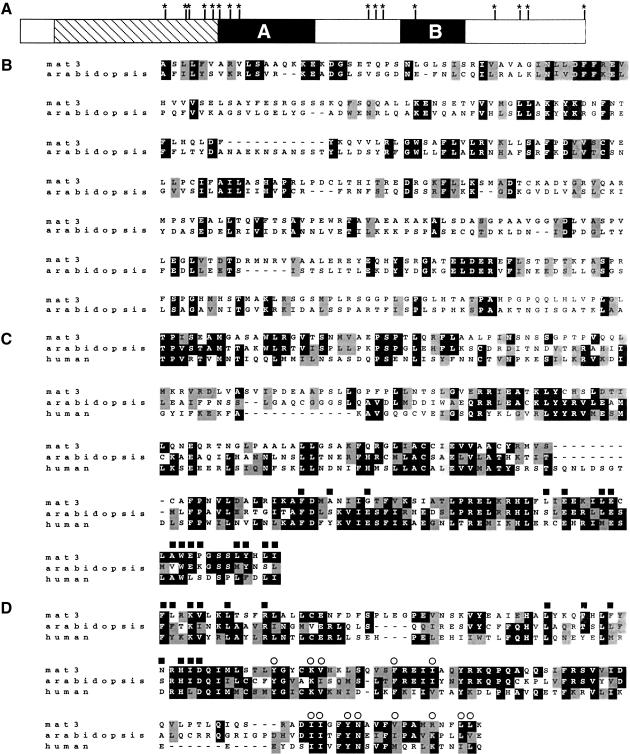
A BLAST search using the mat3 open reading frame showed a match to the RB family of tumor suppressors, with plant homologs yielding the highest scores. The domain structure of the mat3-encoded protein (Mat3p), like other RB genes, contains two regions of high similarity termed A and B separated by a diverged spacer region (Fig. 2A,C,D; Gutierrez 1998). In addition, the N-terminal region of Mat3p contains a region of weaker similarity with Arabidopsis RB and other plant RB genes (Fig. 2B). Domains A and B fold together to form a binding pocket for E2F transcription factors, and many of the residues at the A/B interface are conserved in Mat3p (Fig. 2C,D; Lee et al. 1998). The Mat3p sequence also contains the LXCXE peptide binding site found in other RB proteins with near perfect conservation of residues that form the binding groove (Fig. 2D; Lee et al. 1998). Mat3p contains 16 potential CDK regulatory phosphorylation sites, most of which are located around but not within domains A and B (Fig. 2A), as is also the case for animal and plant RB proteins (Xie et al. 1996; Taya 1997).
Figure 2.
Homology between Mat3p and RB proteins. (A) Schematic of Mat3p showing locations of homology with the A and B domains of other RB proteins (black boxes) and additional homology with plant RB proteins (hatched region). (Asterisks) Potential CDK phosphorylation sites (S/T P). (B) Alignment of the plant-specific domain of mat3 (Gen Bank AF375824; residues 67–404) and Arabidopsis retinoblastoma related protein (Gen Bank AAF79146; residues 73–384; identity/similarity 23%/35%). Alignments were generated using the ClustalW program and formatted with Boxshade. (Black) Identity; (shading) similarity. (C) Alignment of domain A from mat3 (residues 423–626), Arabidopsis retinoblastoma related protein (residues 406–607; identity/similarity 31%/40%), and human RB (SWISS-PROT P06400, residues 373–573; identity/similarity 26%/41%). (Black squares) Residues that form contacts between domains A and B (Lee et al. 1998). (D) Alignment of domain B from mat3 (residues 818–949), Arabidopsis retinoblastoma related protein (733–862; identity/similarity 39%/55%), and human RB (650–770; identity/similarity 32%/48%). (Black squares) same as in panel C; (open circles) residues that form the LXCXE binding pocket in human RB (Lee et al. 1998).
Cell cycle analysis of mat3-4
We next determined how loss of Mat3p affects the cell cycle. In principle, there are two ways to disrupt the size-control mechanism of Chlamydomonas and generate small cells. Cells could commit to division at too small a size, or they could divide too many times during S phase/mitosis. We developed experimental protocols that allowed us to distinguish between these possibilities and to compare the timing of cell cycle events in wild-type and mat3-4 strains.
Because of their nonuniform growth properties, we were not able to maintain cell cycle synchrony of mat3-4 strains by the standard method of alternating light–dark periods (Harris 1989). Therefore, we used a regimen in which cells are grown asynchronously in continuous light, followed by 24 h in the dark. Cells cease growing during the dark period, but those that have passed the commitment point divide. Therefore, at the end of the dark period, the vast majority (>95%) of cells will be either new daughters or cells that have not passed commitment.
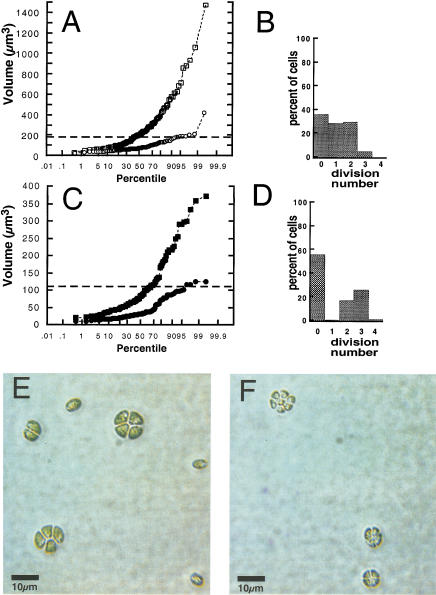
To determine the commitment size threshold, we used the following procedure. We first determined what fraction of exponentially growing cells was past the commitment point by removing an aliquot of the light-grown culture and plating it in the dark (at the same time that the rest of the light-grown culture was shifted to the dark). The dark-plated cells were allowed to divide and then assayed microscopically for cell division. The fraction that divided at least once represented the fraction of committed cells in the light-grown culture. We next plotted the size distributions of the light-grown and dark-shifted cultures by percentile size ranking (Fig. 3A,C). On a percentile plot, the largest of the dark-shifted cells should be just below the commitment size threshold, and, thus, the graph for the dark-shifted culture should asymptotically approach the commitment threshold size. If the commitment threshold size value determined from the plot of the dark-shifted culture is correct, then the fraction of cells in the light-grown culture that was above this size should correspond to the fraction of the light-grown culture that was past commitment (determined independently by the dark-plating assay above).
Figure 3.
Cell cycle analysis of asynchronous wild-type and mat3-4 cultures. (A,C) Volume distributions of wild-type (A) and mat3-4 (C) strains grown asynchronously in continuous light and kept in log phase for at least 14 generations (squares), then shifted to the dark for 24 h (circles). The X-axis is a logarithmic scale showing the percentile ranking of cells by size. The horizontal dashed lines indicate volumes of 178 μm3 (A) and 110 μm3 (C), which are the respective commitment size thresholds for wild-type and mat3-4 strains. (B,D) Wild-type (B) and mat3-4 cells (D) from continuous light cultures in A and C were plated in the dark. After 24 h dark incubation, cells were scored for the number of divisions they underwent and the results plotted as percentages of cells in each division number category. (E,F) Photomicrographs of division clusters from wild-type (E) and mat3-4 (F) strains.
For wild-type cells subjected to this regimen, 64% of the population was larger than 178 μm3 when placed in the dark (Fig. 3A), and 64% divided at least once during the dark period with an average division number of 1.6; that is, most of the cells that underwent mitosis divided either once to form two daughters or twice to form four daughters (Fig. 3B; Table 1). At the end of the dark period, 98% of the cells were below 178 μm3, and 98% underwent no further division after plating and continued dark incubation (Figs. 3A and 4A, 0 h). The strong correlation between the fraction of cells that divide and the fraction that is above ∼178 μm3 indicates that an ∼178 μm3 size threshold controls passage through commitment (Table 1), close to the commitment threshold value of 165 μm3 measured previously for wild-type cells (John 1987). Using the summed volumes of cells above 178 μm3 and the average division number of 1.6, the extrapolated average daughter volume is 115 μm3, equivalent to the directly measured value of 113 μm3 for wild-type G0 daughter cells that result from gametic differentiation (Table 1; Harris 1989).
Figure 4.
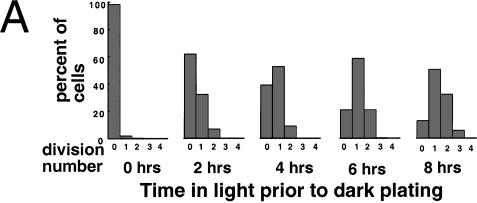
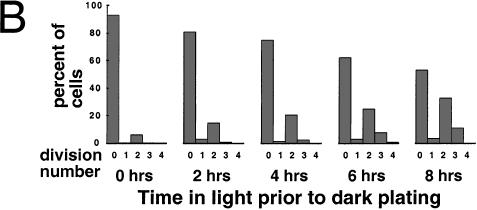
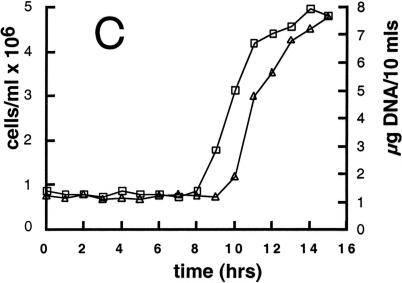
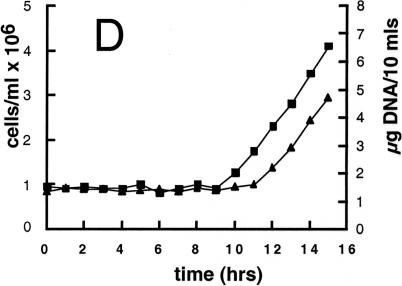
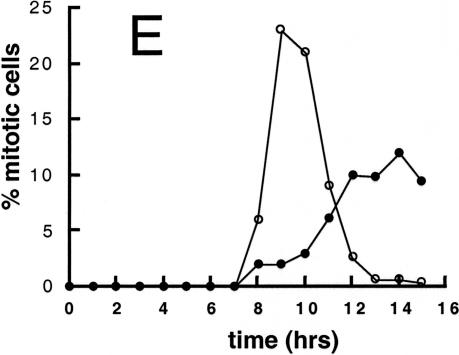
Cell cycle analysis of synchronized wild-type and mat3-4 cultures. (A and B) Division number histograms of wild-type (A) and mat3-4 (B) strains. Dark-incubated cultures from Fig. 3 were returned to the light, and at the indicated times an aliquot of cells was removed and plated in the dark. The division numbers of the cells are plotted as in Fig. 3. (0 h) Beginning of the light period. (C–E) Cell number (triangles), DNA content (squares), and mitotic state (circles) were analyzed at the indicated times for wild-type (open symbols) and mat3-4 (filled symbols) cultures as they grew continuously in the light.
When mat3-4 mutants were subjected to this same culture regimen, 44% of the light-grown cells were above 110 μm3 (Fig. 3C), and 44% divided in the subsequent dark period, with an average division number of 2.6. Thus, mat3-4 cells undergo an extra round of S phase/mitosis compared with wild-type cells (Fig. 3B,D; Table 1), despite their far smaller average size (Fig. 3A,C). The absence of mat3-4 cells that divide only once (Fig. 3D) indicates that even the smallest committed cells in the population undergo at least two rounds of division. Direct visual comparison of division clusters confirms the altered [cell size/division number] ratio in mat3-4 compared with wild type (Fig. 3E,F). At the end of the dark period, 96% of the mat3-4 cells were below 110 μm3, and 96% underwent no further division (Figs. 3C and 4B, 0 hrs). The strong correlation between the fraction of mat3-4 cells that divide and the fraction above ∼110 μm3 indicates that an ∼110 μm3 size threshold controls passage through commitment (Table 1), a value that is about 60% that of wild type. Using the same extrapolation method as for wild type, the average mat3-4 daughter cell volume was calculated to be 28 μm3, close to the directly measured value of 23 μm3 for mat3-4 gametes (Table 1).
To confirm and extend the above results, we returned the dark-incubated, precommitment populations of cells described above to the light and allowed growth to resume. Aliquots were removed at 2-h intervals and replated in the dark for 16–24 h to observe what fraction of growing cells had passed the commitment size and how many divisions they underwent (Fig. 4A,B). The light-grown cultures were also sampled at 1-h intervals to determine the relative timing of DNA synthesis, mitosis, and daughter cell release (Fig. 4C–E).
In wild-type cultures subjected to this second regimen, cells grew in size with an increasing fraction passing commitment over time. The division numbers of cells that passed commitment also increased with time from one to two and three, producing clusters of two, four, and occasionally eight cells after dark plating (Fig. 4A). Cell size was measured at 6 and 8 h in the light, and, as expected, the fraction of cells that had passed commitment (as assayed by dark plating) equaled the fraction that was above the threshold size of 178 μm3 at the time of plating (data not shown). DNA synthesis and mitosis began 8 h after the cells were returned to the light and were largely complete by 12 h (Fig. 4C,E).
When mat3-4 cultures were subjected to this second regimen, we again observed a striking lack of cells that underwent only one division after dark plating, even at the earliest time point of 2 h in the light (Fig. 4B). Instead, the majority of cells that passed commitment divided at least twice, despite their small size, with division numbers increasing in later samples to three and occasionally four rounds (Fig. 4B). In agreement with results from the first part of the experiment (Fig. 3B,D), the fraction of cells above 110 μm3 at 6 and 8 h in the light equaled the fraction of cells that showed commitment as assayed by plating in the dark (data not shown).
The first mat3-4 mitotic cells in the light-grown culture appear at the same time as wild type (8 h) but accumulate in a broader peak that is delayed 2–3 h (Fig. 4E). The onset of DNA synthesis and daughter cell appearance is delayed similarly (Fig. 4D). The first cells to reach mitosis in both wild-type and mat3-4 cultures were those that were just below their respective commitment threshold sizes when placed in the light. Therefore, the 8-h time point when mitotic cells first appear reflects the interval between commitment and mitosis, and this parameter does not appear to be affected significantly in mat3-4 strains. The broadened mitotic peak in the mat3-4 culture can be explained both by the poor synchrony of the mutant cells and by the increased time engaged in S phase/mitosis to complete more cell divisions. The delay can be explained by the fact that mat3-4 daughter cells must increase in size approximately fourfold to reach commitment, whereas wild-type cells need only increase in size by 1.5-fold (Table 1).
Discussion
mat3 encodes a RB homolog
The gene encoded by the mat3 locus in Chlamydomonas bears unambiguous homology with the RB family of proteins in both primary sequence and domain organization. The conservation of residues that form tertiary contacts between domains A and B and between domain B and LXCXE-containing peptides such as cyclin D indicates further that the Mat3p tertiary structure and protein–protein interactions are similar in Chlamydomonas and mammals. In mammals, RB interacts with multiple proteins (Taya 1997; Mulligan and Jacks 1998), but its main function appears to be binding to E2F transcription factors and repressing transcription of late G1 and S phase genes, with repression being lifted when phosphorylation of RB by cyclin–CDK complexes causes it to dissociate from E2F (Weinberg 1995). Although it is possible that Mat3p does not bind E2F and cyclin–CDK complexes in Chlamydomonas, it is more likely, given the high degree of sequence (and presumably structural) conservation of Mat3p, that these interactions have been retained. Given this premise, there are important and informative differences in the phenotypes of a mat3 knockout versus an RB knockout in mice. Below we discuss the role of Mat3p in Chlamydomonas and then compare it with the role of the RB gene family in mammals.
Mat3p functions at two cell cycle control points
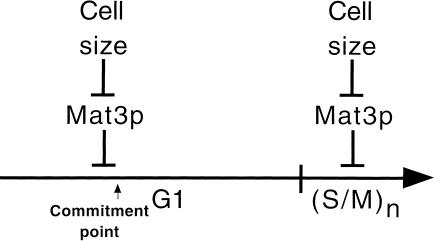
Our observations indicate that the RB homolog encoded by mat3 functions as a size-dependent repressor of cell cycle progression at two key points in the Chlamydomonas cell cycle (Fig. 5). At commitment, cells in G1 must assess their size and decide whether they are large enough to undergo division, even without further growth. When Mat3p is absent, the size threshold is reduced by 40%, indicating that Mat3p normally acts to prevent cells from undergoing commitment until they have reached a critical size of ∼178 μm3. The fact that mat3-4 cells continue to display a 110 μm3 commitment threshold indicates that there is a second, Mat3p-independent sizing mechanism that is normally masked in wild-type cells by the even greater cell size requirement imposed by Mat3p. Nothing is known currently about what aspects of cell size are being monitored at these commitment checkpoints.
Figure 5.
Schematic of how Mat3p functions in the Chlamydomonas cell cycle. A single round of the cell cycle is represented by a time line broken into a long G1 and a short S phase/mitotic period (S/M). The commitment point is also indicated. Mat3p responds to cell size and represses the transition to commitment and, later, the multiple rounds of S phase and mitosis that occur at the end of each cell cycle. When cells are larger than a specific size threshold of ∼178 μm3, Mat3p-mediated repression is lifted, allowing either passage through commitment or continued cell division during S phase/mitosis. Repression is reestablished when daughter cell sizes fall below 178 μm3. Further details are in the Discussion.
Besides affecting the commitment size threshold, Mat3p also plays a role during S phase and mitosis. Although little is understood about the multiple fission mechanism used by Chlamydomonas and many other green algae (Pickett-Heaps 1975), the loss of Mat3p clearly affects the pathway in which mother cell size is used to determine division number. mat3-4 cells that have just passed commitment at 110 μm3 might be expected to divide only once, as wild-type cells that are just above their 178 μm3 commitment threshold size would do. Instead, mat3-4 mutants undergo additional division(s), generating a cumulative size difference of approximately fourfold compared with wild-type daughter cells. It is not clear what sets the ∼23 μm3 lower size limit for mat3-4 daughter cells: It might result from a checkpoint that prevents cells from dividing further, or it might reflect a physical constraint on reinitiating division at such a small size.
Taken together, our results show that although mat3-4 strains display separate defects at two different cell cycle stages, these defects are related in that they involve size-based cell cycle decisions (Fig. 5), indicating that Mat3p functions in a pathway that has a critical role in integrating cell size information with cell cycle progression. Although the upstream elements of the pathway that measure and signal cell size are unknown, our results indicate that Mat3p functions to convey this information to the cell cycle machinery.
Loss of RB in mammals versus Chlamydomonas
The cell cycle defects in mat3-4 strains are informative, but equally informative are those aspects of cell cycle control that are not affected by the mutation, especially because these contrast with what has been found in mammals, in which RB is believed to be the key negative regulator for S phase entry (Weinberg 1995). If this were the case in Chlamydomonas, we would expect to see a shortened G1 accompanied by precocious entry into S phase, which is the phenotype of a mammalian RB or RB gene family knockout (Herrera et al. 1996; Dannenberg et al. 2000; Sage et al. 2000). As noted in the Results, the length of G1 for mat3-4 cells is actually longer than in wild-type strains because, to reach commitment, mat3-4 daughter cells must undergo a much greater increase in mass than wild-type daughters (4-fold vs. 1.5-fold) while maintaining a growth rate that is similar to wild type (Table 1). As a result, a much higher proportion of exponentially growing mat3-4 cells are in a G1 precommitment state compared with a wild-type culture (56% vs. 36%; Fig. 3B,D). Furthermore, the long interval between commitment and the first S phase, which marks the second part of G1 in wild-type strains, is unchanged in mat3-4, indicating that the mechanism that generates this delay is not under the control of the RB pathway.
Although our data indicate that Mat3p is not the primary regulator of S phase entry as it is in animals, animal RB proteins and Mat3p could still share an overlapping function of cell size control. A sizer that operates through the RB pathway in animals may exist, but its presence would be masked in knockout cell lines by the simultaneous loss of S phase control, which will lead de facto to a faster cell cycle and result in smaller cells.
A second phenotype associated with loss of the mammalian RB pathway is loss of some differentiation potential (Dannenberg et al. 2000). Although direct comparison with a simple unicell such as Chlamydomonas is more difficult on this point, it is worth noting that upon nitrogen starvation, mat3 mutants undergo a normal program of cell cycle arrest and gametic differentiation (data not shown; Armbrust et al. 1995). In fact, mat3 mutants have the opposite problem of mammalian RB knockout cells. The latter fail to exit the cell cycle in response to cell cycle arrest cues (Dannenberg et al. 2000; Sage et al. 2000), whereas mat3 mutant cells have difficulty in reentering the cell cycle after nitrogen and other nutrients are returned to their growth media (Armbrust et al. 1995).
How can we reconcile the fact that Mat3p and RB have highly conserved structures, and presumably protein–protein interactions, with their dissimilar mutant cell cycle phenotypes? Specifically, if Mat3p binds an E2F homolog and represses transcription of late G1 and S phase genes, why don't mat3-4 mutant cells accelerate through G1 and enter S phase precociously? The simplest explanation is that in Chlamydomonas, Mat3p is not the central regulator of S phase, but instead interacts with other pathways that control the timing of cell cycle events. Phosphorylation of Mat3p and dissociation from E2F might be necessary but not sufficient for E2F-mediated transcription of cell cycle genes. As discussed above, there are at least three other cell cycle controls that operate in the absence of Mat3p. The first prevents cells from undergoing commitment until they have reached ∼110 μm3; the second establishes a long delay between commitment and the first S phase; and the third limits the extent of division during S phase/mitosis such that cells stop dividing, and reenter G0 or G1, when they are smaller than ∼20–30 μm3. The first and third of these controls are normally masked by the action of the Mat3p-dependent sizing pathway, which ensures that wild-type cells reach a size of ∼178 μm3 before committing to division and reenter G0 or G1 when daughter cells fall below this size. The second control that generates a delay between commitment and S phase is operant whether or not the Mat3p pathway is functioning.
Given these observations, we present below a model for how Mat3p might function at two different points in the Chlamydomonas cell cycle (Fig. 5). Although the model assumes that Mat3p, like mammalian RB, acts as a transcriptional repressor of cell cycle genes, the ideas are applicable to understanding Mat3p regardless of specific interactions.
A model for Mat3p in the Chlamydomonas cell cycle
In the simplest scenario, Mat3p-mediated repression of its target genes would be controlled by a single inhibitory modification (presumably phosphorylation). The target genes would include those required for S phase and at least one required for commitment. When G1 cells grew past ∼178 μm3, Mat3p would be phosphorylated and repression of the target genes would be lifted. This would allow cells to pass commitment, but the previously described S phase delay mechanism would continue to operate and maintain independent repression of the S phase genes until the end of G1. When the delay mechanism ceased to operate at the end of G1, the S phase genes would be completely derepressed, allowing S phase to begin. When daughter cell size fell below 178 μm3, Mat3p phosphorylation would cease, and dephosphorylated Mat3p could rebind its target promoters and allow cells to reenter G1.
An alternative version of the model is that two different phosphorylations could control Mat3p-mediated repression of target genes, one at commitment and one during S phase/mitosis. This alternative stems from recent work in mammals indicating that RB can regulate multiple cell cycle transitions by forming different types of repressor complexes on late G1 versus S phase gene promoters (Zhang et al. 2000). By analogy, Mat3p could repress one or more commitment genes and a second set of S phase genes, with repression of each gene set regulated independently.
Evolution of the RB pathway
The presence of RB in both animals and higher plants but not the budding and fission yeasts is accounted for most easily by assuming that the common unicellular ancestor of all these eukaryotes contained RB and that the gene was lost subsequently in the fungi. Moreover, the common ancestral unicell of these groups presumably used the RB pathway for cell cycle regulation because this is the case in both the plant (Chlamydomonas) and animal lineages. Little is known about the role of RB proteins in plants (Gutierrez 1998; de Jager and Murray 1999), but current phylogenies indicate that the modern green flagellates and the modern land plants share a common Cambrian ancestor that was a green flagellated unicell similar to Chlamydomonas (Chapman et al. 1998). The N-terminal homology between Mat3p and plant RB genes presumably reflects this relationship and may also indicate a functional similarity shared by photosynthetic eukaryotes.
The mat3-4 mutant phenotype in Chlamydomonas is not necessarily what would be predicted based on animal studies of RB, indicating that interactions with other cell cycle control pathways can impact how the RB pathway functions. Mat3p provides a good example of how a conserved protein like RB can be used in the evolution of a modified trait like the multiple fission cell cycle. The green algae have evolved spectacularly diverse patterns of cell size, colony morphology, and multiple fission mitosis (Pickett-Heaps 1975), and much of this diversity could be explained by species-specific modifications of a RB-mediated sizer pathway along with a G1 delay mechanism.
Materials and methods
Insertional mutagenesis and cloning of mat3
The insertional library used to isolate mat3-4 was made using vector pJN4 transformed into wild-type mt+ strain 21gr (Nelson et al. 1994). The mat3-4 deletion was mapped using probes from a mating type locus walk (Ferris and Goodenough 1994). The structure of the insertion was not determined. The pMat3 plasmid used for complementation was constructed from phage λMC8 by ligating a 7-kb BsiWI fragment into the KpnI site of vector pUC119. Seven hundred forty-five bp of λ vector arm is retained in the insert. RT–PCR and 3′ RACE were performed as described (Innis et al. 1990). 5′ RACE was performed using the First Choice RLM-RACE kit from Ambion. Northern analysis using total gametic RNA was as described previously (Ferris and Goodenough 1987). The radiolabeled probe for the blot was a cloned RT–PCR fragment generated with oligonucleotides MAT3-14 5′-TTGAAGCCACCAAGCTGTACT and MAT3-17 5′-GGCTGAAATCGAAGTTCTCG or from a β-tubulin RT–PCR fragment generated with oligonucleotides CRTUB1 5′-AGCGCATCAACGTGTACTTCAA and CRTUB2 5′-GGGT GAAGCCGACCATGAAGAA.
Cell culture conditions
Cultures of wild-type strain 21gr or isogenic deletion strain mat3-4 were grown in SG1 media (Harris 1989) in a water bath at 25°C. Flasks were bubbled with air and illuminated at 80 μeinsteins/m2 per sec. Cell density was maintained between 105 and 5 × 10⁶ cells/mL. Gametes (G0 daughter cells) were generated by growing cells on TAP (Harris 1989) plates for 7 d and then suspending in N-free HSM (Harris 1989).
Cell size, division number, and commitment threshold determination
For cell size measurement, aliquots of cells were centrifuged and resuspended in PBS containing 1% glutaraldehyde. Sizes of 90–110 cells in randomly selected fields were determined microscopically at 200× magnification by measuring length (l) and width (w) using software supplied by Intelligent Imaging Innovations. Volume was calculated based on the approximate prolate ellipsoid shape of the cells (4/3π[l/2][w/2]2).
Cell division number and commitment state were determined by plating cells on SG1 with 1.5% agar and then placing them in the dark for 16–24 h. For each time point, 300–400 individual clusters were examined microscopically and scored for the number of divisions that the mother cell underwent. Average division number of exponentially growing cultures was calculated by summing the fractional weighted contribution of each division number category of cells (excluding the undivided fraction).
The commitment size thresholds (Table 1) were derived from the average of three separate experiments as described in the text and Figure 3, A and C. For each culture condition (continuous light- or dark-incubated), the percent of committed cells in the culture was determined (see above) and then plotted on the cell size distribution curve (Fig. 3A,C). For example, if 40% of the cells were committed to division, we would use the size distribution graph to find the size boundary between the larger 40% (60th percentile and above) and the smaller cells (less than 60th percentile). In all cases, the committed fraction of cells in wild-type or mat3-4 cultures intercepted the cell size distribution curve at a boundary volume that was characteristic for the strain. That is, the fraction of committed cells in the population was always equal to the fraction of cells above the boundary volume. The fixed boundary volume, therefore, corresponds to a commitment size threshold. For wild-type cells the average was 178 ± 10 μm3 and for mat3-4 it was 110 ± 12 μm3.
Cell cycle analysis
The mitotic state of cells was assayed by examining 300–500 fixed cells microscopically. The percentage of cells with cleavage furrows was scored as the mitotic fraction. DNA content was analyzed fluorometrically (Valle et al. 1981) on 10 mL of frozen pelleted cells. Cell concentration was determined using a hemacytometer.
Protein assays
Protein doubling time was calculated from cells in log phase in continuous light (see above). Aliquots were spun down at 2- or 4-h intervals, resuspended in 2% SDS, and frozen. Lysates were boiled and total detergent soluble protein was determined using a Bio-Rad DC assay kit with BSA as a standard. Total gametic protein was determined using the same kit, and cell concentration was measured with a hemacytometer.
Acknowledgments
We thank Len Duncan, Patrick Ferris, David Kirk, Huawen Lin, and Steve Kron for comments on the manuscript. We are grateful to David Kirk for use of his incubators, Ian Duncan for use of his video microscope, and Himadri Pakrasi for use of his fluorescence spectrophotometer. This work was supported by NIH fellowship F32 GM18502 (J.U.) and USDA grant 1999-01364 (U.W.G. and J.U.).
The publication costs of this article were defrayed in part by payment of page charges. This article must therefore be hereby marked “advertisement” in accordance with 18 USC section 1734 solely to indicate this fact.
Footnotes
E-MAIL ursula@biosgi.wustl.edu; FAX (314) 935-5125.
Article and publication are at http://www.genesdev.org/cgi/doi/10.1101/gad.892101.
References
- Armbrust EV, Ibrahim A, Goodenough UW. A mating type-linked mutation that disrupts the uniparental inheritance of chloroplast DNA also disrupts cell-size control in Chlamydomonas. Mol Biol Cell. 1995;6:1807–1818. doi: 10.1091/mbc.6.12.1807. [DOI] [PMC free article] [PubMed] [Google Scholar]
- Chapman RL, Buchheim MA, Delwiche CF, Friedl T, Huss VAR, Karol KG, Lewis LA, Manhart J, McCourt RM, Olsen JL, et al. Molecular systematics of the green algae. In: Soltis P, et al., editors. Molecular systematics of plants II. Boston: Kluwer; 1998. [Google Scholar]
- Coleman AW. The nuclear cell cycle in Chlamydomonas(Chlorophyceae) J Phycol. 1982;18:192–195. [Google Scholar]
- Craigie RA, Cavalier-Smith T. Cell volume and the control of the Chlamydomonascell cycle. J Cell Sci. 1982;54:173–191. [Google Scholar]
- Dannenberg J-H, van Rossum A, Schuijff L, te Riele H. Ablation of the Retinoblastoma gene family deregulates G1control causing immortalization and increased cell turnover under growth-restricting conditions. Genes & Dev. 2000;14:3051–3064. doi: 10.1101/gad.847700. [DOI] [PMC free article] [PubMed] [Google Scholar]
- de Jager SM, Murray JAH. Retinoblastoma proteins in plants. Plant Mol Biol. 1999;41:295–299. doi: 10.1023/a:1006398232003. [DOI] [PubMed] [Google Scholar]
- Donnan L, John PC. Cell cycle control by timer and sizer in Chlamydomonas. Nature. 1983;304:630–633. doi: 10.1038/304630a0. [DOI] [PubMed] [Google Scholar]
- Edgar BA, Kiehle CP, Schubiger G. Cell cycle control by the nucleo-cytoplasmic ratio in early Drosophiladevelopment. Cell. 1986;44:365–372. doi: 10.1016/0092-8674(86)90771-3. [DOI] [PubMed] [Google Scholar]
- Ferris PJ, Goodenough UW. Transcription of novel genes, including a gene linked to the mating-type locus, induced by Chlamydomonasfertilization. Mol Cell Biol. 1987;7:2360–2366. doi: 10.1128/mcb.7.7.2360. [DOI] [PMC free article] [PubMed] [Google Scholar]
- ————— The mating-type locus of Chlamydomonas reinhardtiicontains highly rearranged DNA sequences. Cell. 1994;76:1135–1145. doi: 10.1016/0092-8674(94)90389-1. [DOI] [PubMed] [Google Scholar]
- Gillham NW, Boynton JE, Johnson AM, Burkhart BD. Mating type linked mutations which disrupt the uniparental transmission of chloroplast genes in Chlamydomonas. Genetics. 1987;115:677–684. doi: 10.1093/genetics/115.4.677. [DOI] [PMC free article] [PubMed] [Google Scholar]
- Gutierrez C. The retinoblastoma pathway in plant cell cycle and development. Curr Opin Plant Biol. 1998;1:492–497. doi: 10.1016/s1369-5266(98)80041-1. [DOI] [PubMed] [Google Scholar]
- Harris EH. The Chlamydomonas sourcebook: A comprehensive guide to biology and laboratory use. San Diego: Academic Press; 1989. [DOI] [PubMed] [Google Scholar]
- Hayles J, Nurse P. Cell cycle regulation in yeast. J Cell Sci Suppl. 1986;4:155–170. doi: 10.1242/jcs.1986.supplement_4.10. [DOI] [PubMed] [Google Scholar]
- Herrera RE, Sah VP, Williams BO, Makela TP, Weinberg RA, Jacks T. Altered cell cycle kinetics, gene expression, and G1 restriction point regulation in Rb-deficient fibroblasts. Mol Cell Biol. 1996;16:2402–2407. doi: 10.1128/mcb.16.5.2402. [DOI] [PMC free article] [PubMed] [Google Scholar]
- Innis MA, Gelfand DH, Sninsky JJ, White TJ. PCR protocols: A guide to methods and applications. San Diego: Academic Press; 1990. [Google Scholar]
- John PCL. Control points in the Chlamydomonascell cycle. In: Wiessner W, et al., editors. Algal development. Berlin: Springer-Verlag; 1987. pp. 9–16. [Google Scholar]
- Kindle KL. High-frequency nuclear transformation of Chlamydomonas reinhardtii. Proc Natl Acad Sci. 1990;87:1228–1232. doi: 10.1073/pnas.87.3.1228. [DOI] [PMC free article] [PubMed] [Google Scholar]
- Kirk MM, Ransick A, McRae SE, Kirk DL. The relationship between cell size and cell fate in Volvox carteri. J Cell Biol. 1993;123:191–208. doi: 10.1083/jcb.123.1.191. [DOI] [PMC free article] [PubMed] [Google Scholar]
- Lee J-O, Russo AA, Pavletich NP. Structure of the retinoblastoma tumour-suppressor pocket domain bound to a peptide from HPV E7. Nature. 1998;391:859–865. doi: 10.1038/36038. [DOI] [PubMed] [Google Scholar]
- Mulligan G, Jacks R. The retinoblastoma gene family: Cousins with overlapping interests. Trends Genet. 1998;14:223–229. doi: 10.1016/s0168-9525(98)01470-x. [DOI] [PubMed] [Google Scholar]
- Nelson JAE, Savereide PB, Lefebvre PA. The CRY1 gene in Chlamydomonas reinhardtii: Structure and use as a dominant selectable marker for nuclear transformation. Mol Cell Biol. 1994;14:4011–4019. doi: 10.1128/mcb.14.6.4011. [DOI] [PMC free article] [PubMed] [Google Scholar]
- Neufeld TP, Edgar BA. Connections between growth and the cell cycle. Curr Opin Cell Biol. 1998;10:784–790. doi: 10.1016/s0955-0674(98)80122-1. [DOI] [PubMed] [Google Scholar]
- Pickett-Heaps JD. Green algae. Sunderland, MA: Sinauer Associates; 1975. [Google Scholar]
- Sage J, Mulligan GJ, Attardi LD, Miller AM, Chen SQ, Williams B, Theodorou E, Jacks T. Targeted disruption of the three Rb-related genes leads to loss of G1 control and immortalization. Genes & Dev. 2000;14:3037–3050. doi: 10.1101/gad.843200. [DOI] [PMC free article] [PubMed] [Google Scholar]
- Spudich JL, Sager R. Regulation of the Chlamydomonascell cycle by light and dark. J Cell Biol. 1980;85:136–145. doi: 10.1083/jcb.85.1.136. [DOI] [PMC free article] [PubMed] [Google Scholar]
- Taya Y. RB kinases and RB-binding proteins: New points of view. Trends Biochem Sci. 1997;22:14–17. doi: 10.1016/s0968-0004(96)10070-0. [DOI] [PubMed] [Google Scholar]
- Valle O, Lien T, Knutsen G. Fluorometric determination of DNA and RNA in Chlamydomonasusing ethidium bromide. J Biochem Biophys Meth. 1981;4:271–277. doi: 10.1016/0165-022x(81)90067-1. [DOI] [PubMed] [Google Scholar]
- Weinberg RA. The retinoblastoma protein and cell cycle control. Cell. 1995;81:323–330. doi: 10.1016/0092-8674(95)90385-2. [DOI] [PubMed] [Google Scholar]
- Xie Q, Sanz-Burgos AP, Hannon GJ, Gutierrez C. Plant cells contain a novel member of the retinoblastoma family of growth regulatory proteins. EMBO J. 1996;15:4900–4908. [PMC free article] [PubMed] [Google Scholar]
- Zhang HS, Gavin M, Dahiya A, Postigo AA, Ma D, Luo RX, Harbour JW, Dean DC. Exit from G1 and S phase of the cell cycle is regulated by repressor complexes containing HDAC-Rb-hSWI/SNF and Rb-hSWI/SNF. Cell. 2000;101:79–89. doi: 10.1016/S0092-8674(00)80625-X. [DOI] [PubMed] [Google Scholar]


