Abstract
Many efforts have been made to discover novel biomarkers for early disease detection in oncology. However, the lack of efficient computational strategies impedes the discovery of disease-specific biomarkers for better understanding and management of treatment outcomes. In this study, we propose a novel graph-based scoring function to rank and identify the most robust biomarkers from limited proteomics data. The proposed method measures the proximity between candidate proteins identified by mass spectrometry (MS) analysis utilizing prior reported knowledge in the literature. Recent advances in mass spectrometry provide new opportunities to identify unique biomarkers from peripheral blood samples in complex treatment modalities such as radiation therapy (radiotherapy), which enables early disease detection, disease progression monitoring, and targeted intervention. Specifically, the dose-limiting role of radiation-induced lung injury known as radiation pneumonitis (RP) in lung cancer patients receiving radiotherapy motivates the search for robust predictive biomarkers. In this case study, plasma from 26 locally advanced non-small cell lung cancer (NSCLC) patients treated with radiotherapy in a longitudinal 3×3 matched-control cohort was fractionated using in-line, sequential multi-affinity chromatography. The complex peptide mixtures from endoprotease digestions were analyzed using comparative, high-resolution liquid chromatography (LC)-MS to identify and quantify differential peptide signals. Through analysis of survey mass spectra and annotations of peptides from the tandem spectra, we found candidate proteins that appear to be associated with RP. Based on the proposed methodology, alpha-2-macroglobulin (α2M) was unambiguously ranked as the top candidate protein. As independent validation of this candidate protein, enzyme-linked immunosorbent assay (ELISA) experiments were performed on independent cohort of 20 patients’ samples resulting in early significant discrimination between RP and non-RP patients (p = 0.002). These results suggest that the proposed methodology based on longitudinal proteomics analysis and a novel bioinformatics ranking algorithm is a potentially promising approach for the challenging problem of identifying relevant biomarkers in sample-limited clinical applications.
Introduction
The emergence of proteomics could help physicians develop targeted interventions to patients at risk of severe treatment complications. Mass spectrometry-based proteomics with their improved dynamic range and throughput compared to 2-dimensional gel electrophoresis has greatly enhanced our ability to reveal candidate proteins associated with various human diseases.1,2 More recently, comparative high-resolution liquid chromatography mass spectrometry (LC-MS) has been increasingly used in medicine due to their advanced ability to collect proteomic data over a broad mass range.3–22 However, frequent application to clinical studies remains prohibitive because of the logistics and high cost associated with applying this technology to meet large sample size requirements.
In our previous work,3,5 we used the LC-MS for identifying candidate proteins in Parkinson's disease and Alzheimer's disease using targeted quantitative proteomics analysis. In this work, we propose a novel graph-based quantitative proteomics approach to identify new robust biomarkers for radiation-induced lung toxicity risk in patients who received radiotherapy as part of their treatment.
Lung cancer is a leading cause of cancer mortality and morbidity in both men and women in the United States and internationally with a five-year survival rate less than 15%.23 Of all lung cancer cases, non-small cell lung cancer (NSCLC) accounts for approximately 80%. At the time of diagnosis, about 25% to 40% of NSCLC patients are in locally advanced stages.24 For inoperable patients with advanced stages of NSCLC, radiotherapy with or without chemotherapy is the main treatment option.23 A potentially fatal side effect of radiotherapy in lung cancer is the manifestation of radiation-induced lung injury known as radiation pneumonitis (RP). RP develops in a significant fraction 10-30% of patients receiving thoracic irradiation and is the main limiting factor to increase the prescribed radiation dose.25,26 Patients with insufficient doses are at risk of experiencing tumor recurrence, which occurs in more than half of these patients.27–30 Thus, biomarkers for a more accurate prediction of RP are urgently needed. These biomarkers can be used to personalize patients’ treatment plans, reduce the risk of RP complications or support therapy that is more significant for those patients who are likely to benefit from increased radiation dose. However, the identification of predictive biomarkers for RP in NSCLC radiotherapy has been problematic with no accepted biomarker for routine clinical practice.31
To demonstrate our new proposed methodology for proteomics analysis in limited lung cancer datasets, we will consider the challenging case of RP. Serum samples were collected longitudinally before and during the course of fractionated irradiation treatment of matched-control locally advanced NSCLC patients with and without clinically proven RP. We compare changes of molecular peak intensities between not only different patient groups at the same time points but also across different time points in the same patient's groups. To independently validate the candidate proteins found using our proposed method, an enzyme-linked immunosorbent assay (ELISA) experiment was performed on the remaining patient cohort.
Materials and Methods
Sample Selection
Serum specimens were collected prospectively on an institutionally approved protocol at Washington University School of Medicine from locally advanced NSCLC patients before, during, and at the end of a treatment course of conventional fractionated radiotherapy, as well as at 3 and 6-months follow-up (5 blood samples per patient). Of the 26 patients in the study, five patients developed RP with grade ≥2 on the basis of the National Cancer Institute (NCI) Common Terminology Criteria for Adverse Events (CTCAE) v3.0 scale. The remaining patients developed no adverse RP symptoms throughout a median follow-up period of 16 months. Among the five patients who developed RP, three patients with grades ≥3 were selected for our study to identify novel biomarkers involved in RP, which is henceforth referred to as the disease group. This group was paired with patients who have similar demographics (age, gender, and ethnicity) in our cohort, but did not develop RP, which is referred to henceforth as the control group. Since the focus of the current analysis is on early RP prediction and intervention, we used only mass spectra from pre-treatment, mid-treatment (3 weeks), and end of treatment (6 weeks) for subsequent analysis.
Sample Preparation for Comparative LC-MS
The serum samples from the above six patients (each patient has several samples collected at various time points: before, during, and after treatment) were subjected to multi-affinity removal of high-abundant proteins using an antibody affinity column that removes albumin, IgG, α1-antitrypsin, IgA, IgM, transferrin, and haptoglobin (Agilent Technologies, Palo Alto, CA). The column was connected to a Vision Workstation (ABI, Foster City, CA). The serum (500 μL) was diluted and thawed with 0.5 mL of 2X Tris-buffered saline (10 mM, 150 mM NaCl, pH 7.4) (TBS) with inversion. The diluted serum samples were filtered through 0.45 μm Microcon filters (Millipore, Billerica, MA) using centrifugation (16000 × g) for 2 min. The recovered volume (900 μL) was diluted to 3.1 mL with TBS and applied sequentially to the antibody affinity column. The unbound eluates from the two columns were collected, combined, and concentrated with a 5 kDa MWCO Amicon Ultra Centrifugal filter (Millipore) to a final volume of ~300 μL.
An aliquot (20 μg) of the concentrated, unbound eluates from the multi-affinity columns was precipitated using the vendor protocol for the 2D clean-up kit (GE Healthcare, Cat No 80-6484-51). The protein pellets were solubilized in 20 μL of Tris buffer (100 mM, pH 8.5) containing 8 M urea. The protein disulfide bonds were reduced with TCEP (2 μL of a 50 mM solution) (TCEP bond-breaker, 0.5 M solution, Thermo Scientific, Cat No 77720) and placed at room temperature for 30 min. Alkylation of the cysteine residues was performed using iodoacetamide (2.2 μL of a 100 mM solution). After 30 min at room temperature in the dark, the reaction was quenched with 10 mM dithiothreitol (DTT) for 15 min at room temperature. Endoprotease Lys-C (Roche, Cat No 11047825001) was added (~1:20 enzyme to substrate ratio) followed by incubation overnight at 37 °C. The samples were diluted 1:4 with 100 mM Tris, pH 8.5 water, trypsin (Sigma, Cat No T6567) was added (1:4 enzyme ratio), and the incubation was continued for 24 h at 37 °C. The digests were acidified with aqueous 5% formic acid (3.3 μL) (Fluka, Cat No 56302). After 30 min the peptides were extracted with a conditioned Nutip carbon tip (Glygen, Cat No NT3CAR). The tips were prepared by repetitive pipetting (× 10) with 25 μL of the peptide elution solvent (60% acetonitrile in 1% formic acid) and then equilibrated with 10 washes (25 μL) of extraction solvent (1% formic acid). The tips were then washed four times with the peptide elution solution. The peptides were recovered with 25 μL of the peptide elution solvent (60% ACN, 1% formic acid) by repetitive pipetting (20 times), followed by four washes (20 μL each) of the elution solution. The eluant and washes were combined in an autosampler vial (SUN SRi, Cat No 200 046), dried in a Speed Vac (Thermo Savant) and dissolved in 25 μL of Solvent A (aqueous 1% formic acid, 1% acetonitrile) for nano-LC-MS.
MS Data Processing
The unprocessed MS1 and MS2 data, that were acquired in profile mode, were imported into Rosetta Elucidator™ (version 3.3.0.0.220, Rosetta Biosoftware, Seattle, WA). The retention time alignment and feature definition were performed over a chromatographic time range of 20 - 140 min and an m/z range of 350 - 1600 using the PeakTeller algorithm. Using a maximum time correction of 15 min and a mass accuracy of 20 ppm the features were scored for ideality (score of 1) in the retention time and m/z dimensions and only features with scores of 0.5 were considered for further analysis. The number of detected features, isotope groups and charge groups were 89460, 30301 and 26013, respectively. Additional parameters that were different than the default included: intensity threshold cutoff = 100000; noise strength removal for retention time = 2; noise strength removal for m/z = 2 and smoothing was not enable. To correct for global differences in total ion currents between LC-MS analyses, intensity scaling was performed within the Rosetta Elucidator™ software. This normalization was based on the mean intensity of all features after a 10% outlier trim.
The MS2 data were searched as DTA files within the Rosetta software using MASCOT (version 2.2.04) against a human UNIPROT database (http://www.uniprot.org/; downloaded November 2008).32 The MS1 and MS2 mass tolerances were set at 20 ppm and 0.8 Da, respectively. Carbamidomethyl of Cys residues was set as a fixed modification and Met residue oxidation was allowed as a variable modification. Annotations were accepted with a peptide prophet score of 94.99% and a protein prophet score of 98.99%. The number of annotated peptides and proteins were 3276 and 626, respectively.
Data Analysis
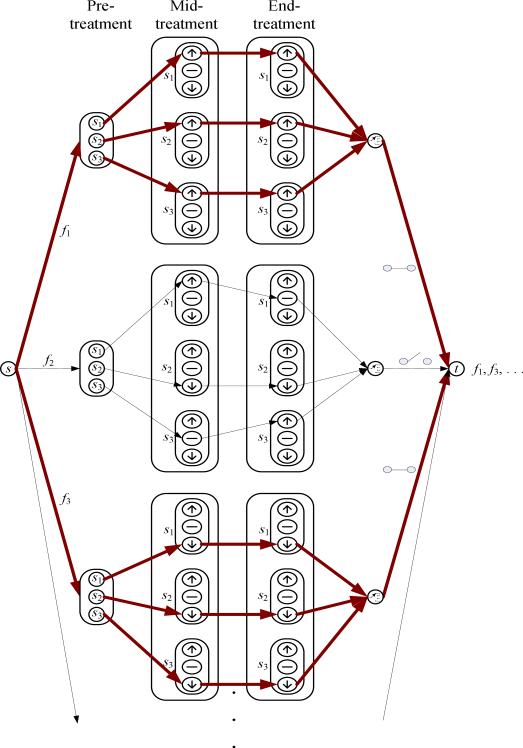
Rosetta Elucidator system also calculates ratio data between any two given groups. The ratio data is especially informative when relative intensity changes are analyzed across the same features in different treatment groups. To ensure a more accurate quantification by accumulating intensities for a group of isotopic peaks with the same charge state originated from one peptide, the aligned annotated peptide intensity values were summed and used to determine the relative abundance of peptides. The integrated intensity was represented by a monoisotopic m/z. From the integrated data, we searched for those monoisotopic peaks that constantly are up-regulated or down-regulated across the different time points (pre-treatment, mid-treatment, and end-treatment) for all samples in the same group. For example, in Figure 1 suppose that s1,s2, and s3 indicate samples from those patients who belong to the RP disease group. The intensity of a monoisotopic peak, f1, was constantly up-regulated and the intensity of f3 was constantly down-regulated during treatment for all samples, but not for f2. Therefore, the monoisotopic peaks f1 and f3 were selected and the proteins for the selected monoisotopic peaks were investigated in further analysis. The same procedure was repeated for the control group, separately.
Figure 1.
Diagram depicting the procedure for selecting significant monoisotopic peaks. The monoisotopic peaks corresponding to the bold lines indicate the selected ones (in this example, f1 and f3 that were up-regulated and down-regulated constantly, respectively).
We investigated relationships between the filtered proteins and four known biomarker proteins implicated in RP.31 The rationale is that though some of these biomarkers (denoted in our methods as “regularization with an anchor list”) may not be robust as our presumptive biomarker, they would provide some sort of prior knowledge to regularize the candidate protein search towards the more biologically relevant biomarkers. This is analogous to Tikhonov's regularization approach in solving ill-conditioned regression problems.33 Also, we hypothesized that some proteins relevant to a specific disease exist in close distance or in the same pathways with known biomarkers since it is known that the probability that interacting proteins share similar biological function is higher than the probability that they have dissimilar functions.34,35 The selected regularization proteins include transforming growth factor β (TGF-β),36,37 interleukin-6 (IL-6),38,39 angiotensin converting enzyme (ACE),40,41 and nuclear factor-kappaB (NF-kB).42,43 The candidate proteins identified by the mass spectrometry analysis and the four regularization proteins were input into the Meta-Core software (GeneGo Inc.), which is a manually curated database of protein interactions. As a result of a protein-protein expansion search in the MetaCore software, we found a directed network that links the anchor proteins with a subset of the candidate proteins identified by the mass spectrometry analysis as well as additional proteins from the database. The protein-protein interaction network is assumed to form a directed graph G = (V, E), where V is composed of a set of nodes (proteins) and E is a set of possible edges (dissected protein-protein interactions) between pairs of nodes. In this case, let and denote the subset of proteins identified by the mass spectrometry analysis and the four regularization proteins in the anchor list, respectively. To estimate the extent to which each protein is associated with the regularization proteins, we attempt to measure the proximity between each protein in A and the four anchor ones in B. Let a and b be a protein and a regularizer in the sets A and B, respectively. For a protein to be relevant to the RP disease, we assume that it should be close to the known regularization proteins. To estimate this closeness between a and b, we employ two parameters: the number of nodes and the number of references (defined by the number of published papers that show a relationship between any two proteins (or their corresponding genes)). These parameters are translated into corresponding distances as follows. A physical distance, which is defined in terms of the number of nodes between the proteins in the network and a virtual distance which is defined in terms of the number of references that show the interactions between these proteins. Intuitively, as the number of intermediate nodes in a shortest path between any given two nodes increases, the (physical) distance increases and the two nodes are less likely to be related with each other. For the virtual distance, we suppose that as the number of references between directly connected two nodes increases, they are more likely to be related. In other words, the number of references is taken as a proportional measure of relatedness while the number of nodes is inversely proportional to relatedness. Using this concept, we convert the directed graph into a weighted directed graph, where the number of references between any two connected nodes represents a weight on the corresponding edge. Then, based on the power law convention,44 we derive two scores relating a to b: a reference score (rs) and a node score (ns) as follows:
| (1) |
| (2) |
where r and n are the total number of references and nodes in a shortest path from a to b, and α, β, and γ are parameters to control the degree to which r and n contribute to the scores. The influence of the number of nodes is likely to be greater than that of the number of references, assuming that as the number of intermediate nodes in the shortest path between any given two nodes increases, the relationship between them becomes dramatically farther. In our study, we empirically chose α = 0.01 and β = γ = 1. Then, the total score from a to b is defined as the summation of these two scores:
| (3) |
Likewise, we also consider a score from b to a, s(b → a). Here, we determine the final score, s(a ↔ b), between a and b by the maximal value:
| (4) |
We suppose that the importance of a candidate protein is decided by the total score between the candidate protein and the four regularization proteins in the anchor list. Therefore, the final score of a candidate protein a is calculated by:
| (5) |
Here arises an issue on how to calculate the number of nodes and the number of references in the shortest path between a and b. To solve this issue, we utilize the Floyd-Warshall algorithm to estimate the number of nodes in the shortest path.45 This algorithm is employed in graph theory to find the shortest paths between all pairs of nodes based on dynamic programming. Thus, to calculate the number of nodes, we modified the original Floyd-Warshall algorithm such that for all connected edges an equal weight of 1 was assigned as follows:
| (6) |
where eij indicates the edge between node i and node j. As a result, the algorithm would yield a matrix representing the number of nodes on the all-pairs shortest-paths in a given protein-protein interaction network. For the number of references, we used the already available function in the MetaCore software for convenience, which can provide the number of references between any two connected nodes in a given network.
Experimental Results
Analysis of Intensity Changes of Features at Different Time Points
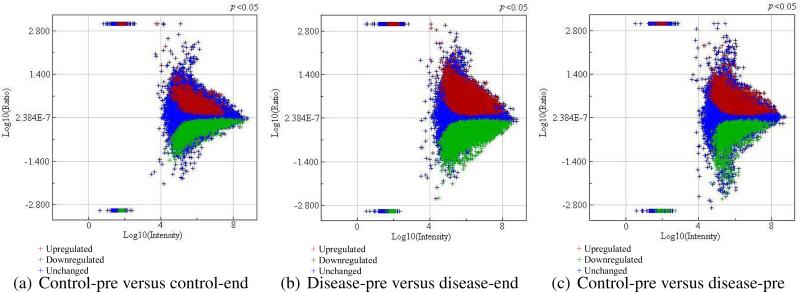
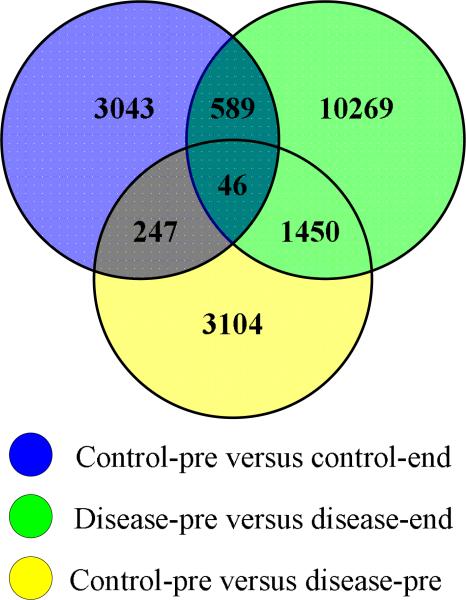
The aligned data extracted from the Rosetta Elucidator consisted of 89460 features per sample. To observe the extent to which features are up-regulated or down-regulated between any two groups of interest, the ratio data was first divided into the following four different treatment groups in order to isolate unharmful radiation effects from harmful radiation effects leading to RP: (1) control pre-treatment (control-pre); (2) control end-treatment (control-end); (3) RP disease pre-treatment (disease-pre); and (4) RP disease end-treatment (disease-end). Figure 2 shows feature intensity differences when a p-value less than .05 was used as a cutoff. As can be seen, in the disease-pre versus the disease-end comparison the most up-regulated and down-regulated features were observed. After extracting the significant (up-regulated and down-regulated) features from these three plots, we investigated how many features are commonly or uniquely found in each of these three groups, as summarized in Figure 3. In this Venn diagram, shared features (between control-pre versus control-end and disease-pre versus disease-end datasets) are considered as candidate peptides for change due to irradiation. In contrast, features that are observed in the disease-pre versus disease-end dataset and not part of the irradiation group are selected as candidates for hypersensitivity to irradiation (predisposition to RP). Next, these hypersensitivity related features were further overlaid with corresponding features from control-pre versus disease-pre comparison for which the shared features are selected as candidates for early RP prediction. As can be seen in the figure, following this criteria 1450 features were uniquely associated with RP while 635 features, commonly found in both control and RP disease groups after radiotherapy, therefore can be attributed to normal (unharmful) response to irradiation.
Figure 2.
Plots that show up-regulated and down-regulated features between different sets of ratio data selected at p = 0.05 confidence level.
Figure 3.
Venn diagram depicting the shared and unique features between different sets of ratio data.
Detection of Candidate Proteins in RP
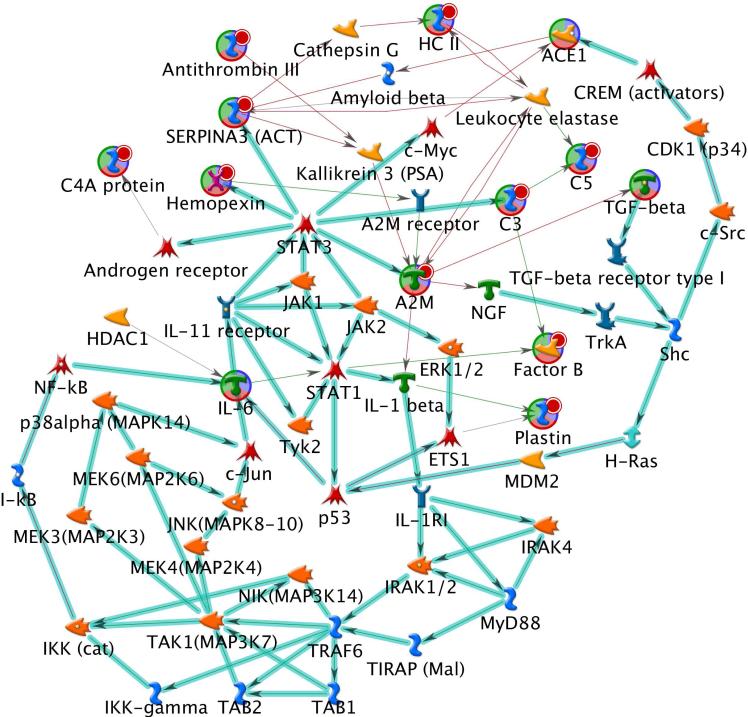
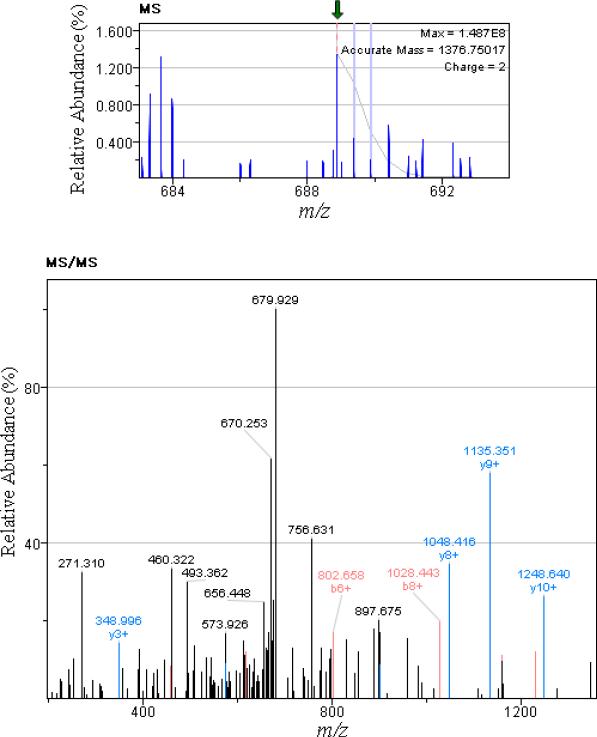
For more accurate quantification, after integration of a group of isotopic peaks with the same charge state originating from one peptide, 30301 monoisotopic peaks were acquired. Of these, 4746 peaks were annotated when direct peptide matches (with ion score > 20) were applied using the Mascot search engine. Using these 4746 monoisotopic peak intensities, the filtering method shown in Figure 1 was applied separately to the control and the RP disease groups to identify the proteins related to each group. In this case, only monotonically changing feature intensities across pre-treatment, mid-treatment, and end-of-treatment from control and RP disease groups were selected. As a result, 41 and 81 monoisotopic peaks were found in the RP disease and the control groups, respectively. We further analyzed the 41 monoisotopic peaks from which 22 unique proteins were identified. Table 1 shows a list of peptides and proteins for the 41 monoisotopic peaks. To rank the 22 proteins based on the proximity to the four regularization proteins in the RP anchor list(TGF-β, IL-6, ACE, and NF-kB), these 26 proteins were together fed into the MetaCore software. Figure 4 demonstrates the most reliable protein-protein interaction network that can be found with these 26 proteins using the MetaCore software database. As can be seen, the identified network included 10 out of the 22 proteins selected earlier by our method in addition to the four proteins in the anchor list. Next, our proposed graph-based scoring function was applied to this network and the ranking results are summarized in Table 2. Subsequently, alpha-2-macroglobulin (α2M) was ranked first with an overall score of 8.194. For different α, β, and γ values in Eq. (1) and Eq. (2), α2M was consistently selected as the top candidate. Figure 5 demonstrates the selective detection of peptide KLSFYYLIMAK (α2M precursor) in serum.
Table 1.
The list of peptides and proteins for 41 monoisotopic peaks.
| No | Monoisotopic m/z | Charge State | Peptide Sequence | Protein Name |
|---|---|---|---|---|
| 1 | 353.20 | 3 | GILNEIKDR | Complement component C8 beta chain |
| 2 | 417.21 | 3 | DNSGLLMaNTLR | ELL-associated factor 2 |
| 3 | 565.29 | 4 | WVMVPMMSLHHLTIPYFR | Alpha-1-antichymotrypsin |
| 4 | 568.30 | 4 | RDLEIEVVLFHPNYNINGK | Complement factor B |
| 5 | 602.85 | 2 | TDRFLVNLVK | Afamin |
| 6 | 638.85 | 2 | VTIGLLFWDGR | Inter-alpha-trypsin inhibitor heavy chain H4 |
| 7 | 670.41 | 2 | AKAAGKGPLATGGIK | Coiled-coil domain-containing protein 72 |
| 8 | 680.38 | 2 | FQNSAILTIQPK | Complement C5 |
| 9 | 688.88 | 2 | KLSFYYLIMAK | Alpha-2-macroglobulin |
| 10 | 710.05 | 3 | VGLSGMAIADVTLLSGFHALR | Complement C4-B |
| 11 | 718.86 | 2 | GLEEELQFSLGSK | Complement C4-B |
| 12 | 770.60 | 5 | HVIILMaTDGLHNMGGDPITVIDEIRDLLYIGKDR | Complement factor B |
| 13 | 804.84 | 2 | GVWGSVCbDDNWGEK | CD5 antigen-like |
| 14 | 807.09 | 3 | AAECbPAGFVRPPLIIFSVDGFR | Ectonucleotide pyrophosphatase/phosphodiesterase family member 2 |
| 15 | 818.60 | 5 | AAQGSPSSSPSDDSTTSGSLPELPPTSTATSRSPPESKGSSR | Uncharacterized protein C12orf55 |
| 16 | 844.42 | 3 | EYVLPHFSVSIEPEYNFIGYK | Complement C5 |
| 17 | 856.42 | 3 | VREYYFAEAQIADFSDPAFISK | Heparin cofactor 2 |
| 18 | 871.81 | 3 | LHLETDSLALVALGALDTALYAAGSK | Complement C4-B |
| 19 | 919.95 | 4 | WVMVPMMaSLHHLTIPYFRDEELSCbTVVELK | Alpha-1-antichymotrypsin |
| 20 | 926.79 | 3 | STQDTVIALDALSAYWIASHTTEER | Complement C4-B |
| 21 | 933.51 | 3 | FQILTLWLPDSLTTWEIHGLSLSK | Complement C4-B |
| 22 | 990.18 | 3 | QAAGSGHLLALGTPENPSWLSLHLQDQK | Sex hormone-binding globulin |
| 23 | 1009.77 | 4 | SMQGGLVGNDETVALTAFVTIALHHGLAVFQDEGAEPLK | Complement C4-B |
| 24 | 1010.78 | 3 | GHESCbMGAVVSEYFVLTAAHCbFTVDDK | Complement factor B |
| 25 | 1013.76 | 4 | SMaQGGLVGNDETVALTAFVTIALHHGLAVFQDEGAEPLK | Complement C4-B |
| 26 | 1058.03 | 2 | YIYPLDSLTWIEYWPR | Complement C5 |
| 27 | 1060.15 | 3 | GECbQAEGVLFFQGDREWFWDLATGTMK | Hemopexin |
| 28 | 1113.07 | 2 | GTHVDLGLASANVDFAFSLYK | Alpha-1-antichymotrypsin |
| 29 | 1150.06 | 2 | NDNDNIFLSPLSISTAFAMTK | Antithrombin-III |
| 30 | 1189.65 | 2 | VDFTLSSERDFALLSLQVPLK | Complement C4-B |
| 31 | 1189.65 | 2 | VDFTLSSERDFALLSLQVPLK | Complement C4-B |
| 32 | 1189.65 | 2 | VDFTLSSERDFALLSLQVPLK | Complement C4-B |
| 33 | 1250.60 | 2 | DALENIDPATQMMILNCbIYFK | Heparin cofactor 2 |
| 34 | 1266.12 | 2 | EYVLPHFSVSIEPEYNFIGYK | Complement C5 |
| 35 | 1302.01 | 2 | DTWVEHWPEEDECbQDEENQK | Complement C3 |
| 36 | 1307.21 | 2 | LHLETDSLALVALGALDTALYAAGSK | Complement C4-B |
| 37 | 1339.81 | 1 | LVNVTIHFRLK | Mucolipin-1 |
| 38 | 1349.75 | 2 | ISTSLPVLDLIDAIQPGSINYDLLK | Plastin-2 |
| 39 | 1441.26 | 2 | EYGVVLAPDGSTVAVEPLLAGLEAGLQGR | N-acetylmuramoyl-L-alanine amidase |
| 40 | 1566.73 | 2 | LQETSNWLLSQQQADGSFQDPCbPVLDR | Complement C4-A |
| 41 | 1589.72 | 2 | GECbQAEGVLFFQGDREWFWDLATGTMK | Hemopexin |
indicate oxidized methionine and carbamidomethylated cysteine residue in the peptides, respectively.
indicate oxidized methionine and carbamidomethylated cysteine residue in the peptides, respectively.
Figure 4.
The most reliable protein-protein interaction network created from the MetaCore software. The direction indicates inhibition (red) and activation (green) between two connected proteins.
Table 2.
Ranking of proteins selected by the proposed method.
| Ranking | Protein Name | Node ID | Score |
|---|---|---|---|
| 1 | Alpha-2-macroglobulin | A2M | 8.194 |
| 2 | Alpha-1-antichymotrypsin | Serpina3 | 7.145 |
| 3 | Complement factor B | Factor B | 6.968 |
| 4 | Hemopexin | Hemopexin | 6.454 |
| 5 | Complement C3 | C3 | 6.213 |
| 6 | Plastin-2 | Plastin | 6.150 |
| 7 | Heparin cofactor 2 | HC II | 6.102 |
| 8 | Complement C4-A | C4A | 5.887 |
| 9 | Complement C5 | C5 | 5.513 |
| 10 | Antithrombin-III | Antithrombin III | 4.501 |
Figure 5.
Selective detection of peptide KLSFYYLIMAK (β2M precursor) in serum. The top and bottom images illustrate MS and MS/MS spectra, respectively.
α2M has been previously identified as a major carrier protein in modulation of the biological activity of cytokines which are important in lung injury and repair but not before in RP cases.46–48 To study the role of this protein in inflammatory reactions in the lungs of rabbits, Kurdowska et al. developed an ELISA assay for rabbit α2M.47 Isaac et al. observed that the concentration of α2M increased during acute and chronic inflammatory reactions in mice studies.49 Rouse et al. reported that alpha-1-antichymotrypsin was up-regulated in a microarray expression test for inflammatory response with mice exposed to butadiene soot (BDS).50
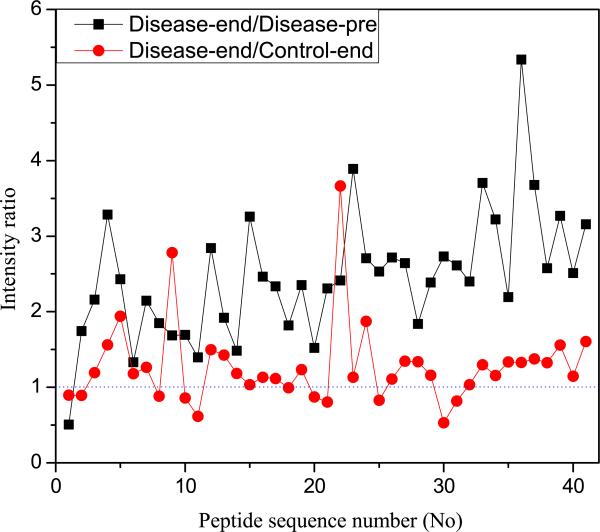
Figure 6 summarizes the biological functions found in the MetaCore software using the 22 RP related proteins. Therefore, the inflammatory processes are common to patients in RP disease group. Interestingly, the top four processes are all associated with inflammation. In addition, we calculated the intensity ratio, dividing averaged disease-end intensities by averaged disease-pre and control-end intensities with the 41 RP-related monoisotopic peaks (see Figure 7). An intensity ratio greater than 1 means that the averaged intensity of disease-end is larger than that of disease-pre or control-end for the corresponding monoisotopic peak. For disease-end versus disease-pre comparison, there is only one case (No 1) where the averaged intensity of disease-end is lower than that of disease-pre. In disease-end versus control-end comparison, overall there are more monoisotopic peaks where the intensity ratio is larger than 1, suggesting the proteins in the disease-end group were relatively highly expressed.
Figure 6.
Processes found in the MetaCore software using the RP related proteins.
Figure 7.
Intensity ratio calculated by dividing averaged disease-end intensities by averaged disease-pre and control-end intensities.
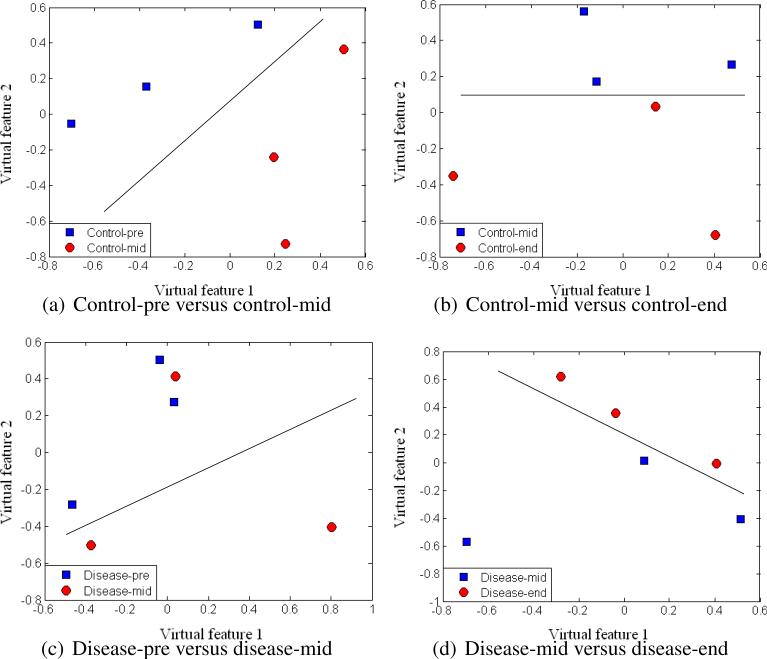
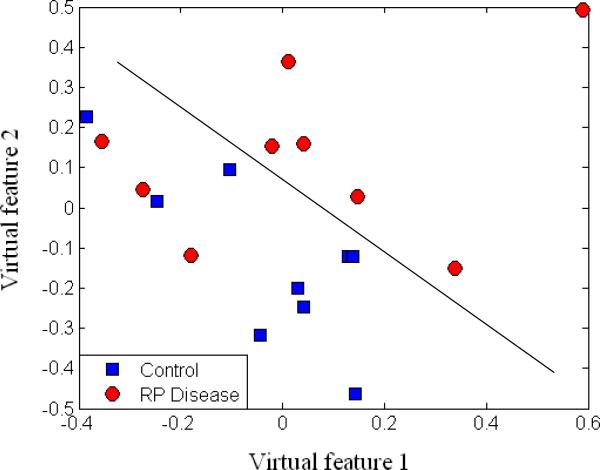
To assess the separation of samples with our selected monoisotopic peaks, we applied multidimensional scaling (MDS), which is a data reduction technique for visualizing a higher-dimensional space (feature space) by mapping it into a lower-dimensional space (2D or 3D). Figure 8 displays the results after MDS mapping of control and RP disease groups at the same time points. Figure 9 shows the MDS mapping results of the same groups at different time points. Figure 10 illustrates the mapping results of control and RP disease groups with all the samples regardless of the time points. Interestingly, overall the samples seem to be separated by these features in accordance with our design in Figure 3.
Figure 8.
MDS plots of different groups at the same time points.
Figure 9.
MDS plots of the same groups at different time points.
Figure 10.
MDS plot of RP disease and control groups.
Independent Validation of α2M as Biomarker for RP
In order to assess the α2M role as a biomarker for RP, we used a human ELISA kit (GenWay Biotech Inc. San Diego, CA) and applied it to the full cohort of 26 patients. Comparison of the non-RP and RP groups was conducted using a 2-tailed t-test. In pre-treatment, p < 0.0001 for RP grade ≥ 2 and p = 0.063 for RP grade ≥ 3 were obtained. In the RP grade ≥ 3, however, the mid-treatment to pre-treatment ratio had a p = 0.025 and the difference had a p = 0.007 while in the RP grade ≥ 2, the ratio and difference were p < 0.0001. To further eliminate possible statistical bias and test the independent predictive power of α2M, we further excluded the 6 patients used in our proteomics analysis. Analysis on this independent dataset resulted in a p = 0.002 for ratio of mid-treatment to pre-treatment and a p = 0.042 for their difference. These results indicate the high sensitivity and robustness of this new biomarker even when compared with other known RP biomarkers not only reported in the literature and summarized in ref. 31 but also tested in our previous work.51
Discussion
By utilizing advanced graph theory techniques, we proposed a novel biomarker ranking method for proteomics analysis in limited datasets. We believe that our method would contribute to more frequent application of proteomics analyses in clinical studies and help mitigate the problems associated with prohibitive large sample size requirements.
Our approach is based by part on the hypothesis that presumptive robust protein biomarkers relevant to a specific disease process exist in close distance or share similar signalling pathways with other implicated biomarkers of the disease that may not necessarily be robust enough for clinical practice. Towards this end, we presented a new strategy for measuring the proximity between candidate proteins identified by the MS analysis and regularization proteins identified from prior knowledge of the disease process, employing two parameters: the number of nodes and the number of references. In weighting interaction pathways between a candidate protein and the regularization proteins, as the number of nodes increases, the protein is more unlikely to be related to the disease. For an interaction between two proteins, the number of references can be an evidence of how confident the interaction is. Therefore, as the number of references increases, the protein is more likely to be related to the disease. Taken together, we proposed a graph-based scoring function to rank biomarkers and identify robust ones from this data.
The selection of the proper anchor list of regularization proteins is problem-dependent and is based on existing knowledge of disease process. Here, the main idea is that candidate proteins relevant to a specific disease exist in close distance or share similar signalling pathways with other known biomarkers of the disease process since it is known that the probability that interacting proteins have the same function is higher than the probability that they have different functions. The role of the regularizing proteins is to steer the search for optimal solution into a feasible space, when the problem is heavily ill-posed (no unique solution exists), as in proteomics analyses. However, sensitivity analysis to this selection and its role in a network structure is beyond the scope of the current work and will be the subject of future investigation.
For the number of references, we opted to use an already available function in the MetaCore software for convenience, which can provide the number of references between any two connected nodes in the network. There are limitations associated with using a particular database (MetaCore database in this study), but the concept could be generalized to other databases as well since as of yet there is no universally accepted database for protein-protein interactions.
As a demonstrative example, the proposed method was applied to a longitudinal NSCLC LC-MS dataset with the objective of identifying robust biomarkers for accurate prediction of clinical onset of RP. Through ELISA experiments using an independent cohort, we demonstrated that the top protein found from the analysis of protein interaction network resulted in statistically significant discrimination between RP and non-RP patients. Further validation in prospective clinic trials would still be required to elucidate its RP onset. Nevertheless, these preliminary validation steps further corroborate that the proposed methodology could be effectively used as a potentially promising approach in challenging proteomic analyses in clinical studies with small datasets.
Conclusions
In this paper, we proposed a new graph-based computational method to find novel biomarkers using a mass spectrometry dataset. This was achieved by applying a new filtering approach that utilizes longitudinal changes of candidate proteins that are located in close proximity to regularization proteins known to have a role in the disease process but are not sufficiently robust for clinical deployment, and by measuring the closeness between proteins we detected and the anchor proteins to regularize our search from a small limited sample size. The proposed method was demonstrated on an NSCLC proteomics data to identify potentially predictive biomarkers of early RP onset. As a result of our proposed proteomics approach, α2M was ranked as the top candidate protein. To validate the findings of our proposed method, we carried out an independent ELISA analysis on independent patient samples. The ELISA results of these samples supported the findings from our proposed proteomics analysis technique. It is expected that our proposed quantitative proteomics approach based on a mass spectrometry platform can be extended as a useful tool to identify relevant biomarkers in other diseases, which may be currently problematic because of limited patient cohort sizes.
Supplementary Material
Acknowledgement
This work was supported by NIH K25CA128809 and Fast Foundation grants.
Footnotes
Note: J.H. Oh and J.M. Craft contributed equally to this work.
References
- 1.Wouters BG. Proteomics: methodologies and applications in oncology. Semin. Radiat. Oncol. 2008;18(2):115–125. doi: 10.1016/j.semradonc.2007.10.008. [DOI] [PubMed] [Google Scholar]
- 2.Petricoin EF, Liotta LA. Mass spectrometry-based diagnostic: the upcoming revolution in disease detection. Clin. Chem. 2003;49(4):533–534. doi: 10.1373/49.4.533. [DOI] [PubMed] [Google Scholar]
- 3.Pan S, Rush J, Peskind ER, Galasko D, Chung K, Quinn J, Jankovic J, Leverenz JB, Zabetian C, Pan C, Wang Y, Oh JH, Gao J, Zhang J, Montine T, Zhang J. Application of targeted quantitative proteomics analysis in human cerebrospinal fluid using a liquid chromatography matrix-assisted laser desorption/ionization time-of-flight tandem mass spectrometer (LC MALDI TOF/TOF) platform. J. Proteome Res. 2008;7(2):720–730. doi: 10.1021/pr700630x. [DOI] [PubMed] [Google Scholar]
- 4.Pan S, Zhang H, Rush J, Eng J, Zhang N, Patterson D, Comb MJ, Aebersold R. High throughput proteome screening for biomarker detection. Mol. Cell. Proteomics. 2005;4(2):182–190. doi: 10.1074/mcp.M400161-MCP200. [DOI] [PubMed] [Google Scholar]
- 5.Oh JH, Pan S, Zhang J, Gao J. MSQ: a tool for quantification of proteomics data generated by a liquid chromatography/matrix-assisted laser desorption/ionization time-of-flight tandem mass spectrometry based targeted quantitative proteomics platform. Rapid Commun. Mass Spectrom. 2010;24(4):403–408. doi: 10.1002/rcm.4407. [DOI] [PubMed] [Google Scholar]
- 6.Oh JH, Kim YB, Gurnani P, Rosenblatt KP, Gao J. Biomarker selection and sample prediction for multi-category disease on MALDI-TOF data. Bioinformatics. 2008;24(16):1812–1818. doi: 10.1093/bioinformatics/btn316. [DOI] [PubMed] [Google Scholar]
- 7.Oh JH, Gurnani P, Schorge J, Rosenblatt KP, Gao JX. An extended Markov blanket approach to proteomic biomarker detection from high-resolution mass spectrometry data. IEEE Trans. Inf. Technol. Biomed. 2009;13(2):195–206. doi: 10.1109/TITB.2008.2007909. [DOI] [PubMed] [Google Scholar]
- 8.Spencer S, Bonnin D, Deasy J, Bradley J, El Naqa I. Bioinformatics methods for learning radiation-induced lung inflammation from heterogeneous retrospective and prospective data. J. Biomed. Biotechnol. 2009;2009:892863. doi: 10.1155/2009/892863. [DOI] [PMC free article] [PubMed] [Google Scholar]
- 9.Shui W, Liu Y, Fan H, Bao H, Liang S, Yang P, Chen X. Enhancing TOF/TOF-based de novo sequencing capability for high throughput protein identification with amino acid-coded mass tagging. J. Proteome Res. 2005;4(1):83–90. doi: 10.1021/pr049850u. [DOI] [PubMed] [Google Scholar]
- 10.Samyn B, Debyser G, Sergeant K, Devreese B, Van Beeumen J. A case study of de novo sequence analysis of N-sulfonated peptides by MALDI TOF/TOF mass spectrometry. J. Am. Soc. Mass Spectrom. 2004;15(12):1838–1852. doi: 10.1016/j.jasms.2004.08.010. [DOI] [PubMed] [Google Scholar]
- 11.Zhen Y, Xu N, Richardson B, Becklin R, Savage JR, Blake K, Peltier JM. Development of a LC-MALDI method for the analysis of protein complexes. J. Am. Soc. Mass Spectrom. 2004;15(6):803–822. doi: 10.1016/j.jasms.2004.02.004. [DOI] [PubMed] [Google Scholar]
- 12.Rejtar T, Chen HS, Andreev V, Moskovets E, Karger BL. Increased identification of peptides by enhanced data processing of high-resolution MALDI TOF/TOF mass spectra prior to database searching. Anal. Chem. 2004;76(20):6017–6028. doi: 10.1021/ac049247v. [DOI] [PubMed] [Google Scholar]
- 13.Wuhrer M, Hokke CH, Deelder AM. Glycopeptide analysis by matrix-assisted laser desorption/ionization tandem time-offlight mass spectrometry reveals novel features of horseradish peroxidase glycosylation. Rapid Commun. Mass Spectrom. 2004;18(15):1741–1748. doi: 10.1002/rcm.1546. [DOI] [PubMed] [Google Scholar]
- 14.Zhu X, Papayannopoulos IA. Improvement in the detection of low concentration protein digests on a MALDI TOF/TOF workstation by reducing R-cyano-4-hydroxycinnamic acid adduct ions. J. Biomol. Technol. 2003;14(4):298–307. [PMC free article] [PubMed] [Google Scholar]
- 15.Morelle W, Slomianny MC, Diemer H, Schaeffer C, van Dorsselaer A, Michalski JC. Fragmentation characteristics of permethylated oligosaccharides using a matrix-assisted laser desorption/ ionization two-stage time-of-flight (TOF/TOF) tandem mass spectrometer. Rapid Commun. Mass Spectrom. 2004;18(22):2637–2649. doi: 10.1002/rcm.1668. [DOI] [PubMed] [Google Scholar]
- 16.Bienvenut WV, Deon C, Pasquarello C, Campbell JM, Sanchez JC, Vestal ML, Hochstrasser DF. Matrix-assisted laser desorption/ionization-tandem mass spectrometry with high resolution and sensitivity for identification and characterization of proteins. Proteomics. 2002;2(7):868–876. doi: 10.1002/1615-9861(200207)2:7<868::AID-PROT868>3.0.CO;2-D. [DOI] [PubMed] [Google Scholar]
- 17.Yergey AL, Coorssen JR, Backlund PS, Jr., Blank PS, Humphrey GA, Zimmerberg J, Campbell JM, Vestal ML. De novo sequencing of peptides using MALDI/TOF-TOF. J. Am. Soc. Mass Spectrom. 2002;13(7):784–791. doi: 10.1016/S1044-0305(02)00393-8. [DOI] [PubMed] [Google Scholar]
- 18.Chen HS, Rejtar T, Andreev V, Moskovets E, Karger BL. Enhanced characterization of complex proteomic samples using LC-MALDI MS/MS: Exclusion of redundant peptides from MS/ MS analysis in replicate runs. Anal. Chem. 2005;77(23):7816–7825. doi: 10.1021/ac050956y. [DOI] [PubMed] [Google Scholar]
- 19.Gu X, Deng C, Yan G, Zhang X. Capillary array reversed-phase liquid chromatography-based multidimensional separation system coupled with MALDI-TOF-TOF-MS detection for high-throughput proteome analysis. J. Proteome Res. 2006;5(11):3186–3196. doi: 10.1021/pr0602592. [DOI] [PubMed] [Google Scholar]
- 20.Qualtieri A, Urso E, Le Pera M, Scornaienchi M, Quattrone A, Di Donna L, Napoli A, Sindona G. Proteomics of bovine myelin sheath: Characterization of a truncated form of P0 by MALDI-TOF/TOF mass spectrometry. J. Am. Soc. Mass Spectrom. 2006;17(2):117–123. doi: 10.1016/j.jasms.2005.09.011. [DOI] [PubMed] [Google Scholar]
- 21.Samyn B, Sergeant K, Memmi S, Debyser G, Devreese B, Van Beeumen J. MALDITOF/TOF de novo sequence analysis of 2D PAGE-separated proteins from Halorhodospira halophila, a bacterium with unsequenced genome. Electrophoresis. 2006;27(13):2702–2711. doi: 10.1002/elps.200500959. [DOI] [PubMed] [Google Scholar]
- 22.Ji C, Li L. Quantitative proteome analysis using differential stable isotopic labeling and microbore LC-MALDI MS and MS/MS. J. Proteome Res. 2005;4(3):734–742. doi: 10.1021/pr049784w. [DOI] [PubMed] [Google Scholar]
- 23.American Cancer Society . Cancer Facts and Figures 2008. American Cancer Society; Atlanta, GA: 2008. [Google Scholar]
- 24.Choy H, Nabid A, Stea B, Scott C, Roa W, Kleinberg L, Ayoub J, Smith C, Souhami L, Hamburg S, Spanos W, Kreisman H, Boyd AP, Cagnoni PJ, Curran WJ. Phase II multicenter study of induction chemotherapy followed by concurrent efaproxiral (RSR13) and thoracic radiotherapy for patients with locally advanced non-small-cell lung cancer. J. Clin. Oncol. 2005;23(25):5918–5928. doi: 10.1200/JCO.2005.08.011. [DOI] [PubMed] [Google Scholar]
- 25.Roychowdhury D, Cassidy C, Peterson P, Arning M. A report on serious pulmonary toxicity associated with gemcitabine-based therapy. Invest. New Drugs. 2002;20(3):311–315. doi: 10.1023/a:1016214032272. [DOI] [PubMed] [Google Scholar]
- 26.Kong FM, Ten Haken R, Eisbruch A, Lawrence TS. Non-small cell lung cancer therapy-related pulmonary toxicity: an update on radiation pneumonitis and fibrosis. Semin. Oncol. 2005;32:S42–54. doi: 10.1053/j.seminoncol.2005.03.009. [DOI] [PubMed] [Google Scholar]
- 27.Deasy J, Niemierko A, Herbert D, Yan D, Jackson A, Haken RT, Langer M, Sapareto S. AAPM/NIH. Methodological issues in radiation dose-volume outcome analyses: summary of a joint AAPM/NIH workshop. Med. Phys. 2002;29(9):2109–2127. doi: 10.1118/1.1501473. [DOI] [PubMed] [Google Scholar]
- 28.El Naqa I, Bradley J, Blanco A, Lindsay P, Vicic M, Hope A, Deasy J. Multivariable modeling of radiotherapy outcomes, including dose-volume and clinical factors. Int. J. Radiat. Oncol. Biol. Phys. 2006;64(4):1275–1286. doi: 10.1016/j.ijrobp.2005.11.022. [DOI] [PubMed] [Google Scholar]
- 29.El Naqa I, Suneja G, Lindsay P, Hope A, Alaly J, Vicic M, Bradley J, Apte A, Deasy J. Dose response explorer: an integrated open-source tool for exploring and modelling radiotherapy dose-volume outcome relationships. Phys. Med. Biol. 2006;51(22):5719–5735. doi: 10.1088/0031-9155/51/22/001. [DOI] [PubMed] [Google Scholar]
- 30.Hope A, Lindsay P, El Naqa I, Alaly J, Vicic M, Bradley J, Deasy J. Modeling radiation pneumonitis risk with clinical, dosimetric, and spatial parameters. Int. J. Radiat. Oncol. Biol. Phys. 2006;65(1):112–124. doi: 10.1016/j.ijrobp.2005.11.046. [DOI] [PubMed] [Google Scholar]
- 31.Fleckenstein K, Gauter-Fleckenstein B, Jackson IL, Rabbani Z, Anscher M, Vujaskovic Z. Using biological markers to predict risk of radiation injury. Semin. Radiat. Oncol. 2007;17(2):89–98. doi: 10.1016/j.semradonc.2006.11.004. [DOI] [PubMed] [Google Scholar]
- 32.The UniProt Consortium The Universal Protein Resource (UniProt) in 2010. Nucleic Acids Res. 2010;38:D142–D148. doi: 10.1093/nar/gkp846. [DOI] [PMC free article] [PubMed] [Google Scholar]
- 33.Hoerl AE. Application of ridge analysis to regression problems. Chem. Eng. Prog. 1962;58:54–59. [Google Scholar]
- 34.Schwikowski B, Uetz P, Fields S. A network of protein-protein interactions in yeast. Nat. Biotechnol. 2000;18(12):1257–1261. doi: 10.1038/82360. [DOI] [PubMed] [Google Scholar]
- 35.Deng M, Zhang K, Mehta S, Chen T, Sun F. Prediction of protein function using protein-protein interaction data. J. Comput. Biol. 2003;10(6):947–960. doi: 10.1089/106652703322756168. [DOI] [PubMed] [Google Scholar]
- 36.Anscher MS, Kong FM, Jirtle RL. The relevance of transforming growth factor beta 1 in pulmonary injury after radiation therapy. Lung Cancer. 1998;19(2):109–120. doi: 10.1016/s0169-5002(97)00076-7. [DOI] [PubMed] [Google Scholar]
- 37.Kong FM, Anscher MS, Sporn TA, Washington MK, Clough R, Barcellos-Hoff MH, Jirtle RL. Loss of heterozygosity at the mannose 6-phosphate insulin-like growth factor 2 receptor (M6P/IGF2R) locus predisposes patients to radiation-induced lung injury. Int. J. Radiat. Oncol. Biol. Phys. 2001;49(1):35–41. doi: 10.1016/s0360-3016(00)01377-8. [DOI] [PubMed] [Google Scholar]
- 38.Chen Y, Hyrien O, Williams J, Okunieff P, Smudzin T, Rubin P. Interleukin (IL)-1A and IL-6: applications to the predictive diagnostic testing of radiation pneumonitis. Int. J. Radiat. Oncol. Biol. Phys. 2005;62(1):260–266. doi: 10.1016/j.ijrobp.2005.01.041. [DOI] [PubMed] [Google Scholar]
- 39.Arpin D, Perol D, Blay JY, Falchero L, Claude L, Vuillermoz-Blas S, Martel-Lafay I, Ginestet C, Alberti L, Nosov D, Etienne-Mastroianni B, Cottin V, Perol M, Guerin JC, Cordier JF, Carrie C. Early variations of circulating interleukin-6 and interleukin-10 levels during thoracic radiotherapy are predictive for radiation pneumonitis. J. Clin. Oncol. 2005;23(34):8748–8756. doi: 10.1200/JCO.2005.01.7145. [DOI] [PubMed] [Google Scholar]
- 40.Ward WF, Molteni A, Ts'ao CH, Kim YT, Hinz JM. Radiation pneumotoxicity in rats: modification by inhibitors of angiotensin converting enzyme. Int. J. Radiat. Oncol. Biol. Phys. 1992;22(3):623–625. doi: 10.1016/0360-3016(92)90890-t. [DOI] [PubMed] [Google Scholar]
- 41.Zhao L, Wang L, Ji W, Wang X, Zhu X, Feng Q, Yang W, Yin W. Association between plasma angiotensin-converting enzyme level and radiation pneumonitis. Cytokine. 2007;37(1):71–75. doi: 10.1016/j.cyto.2007.02.019. [DOI] [PubMed] [Google Scholar]
- 42.Chen MF, Keng PC, Lin PY, Yang CT, Liao SK, Chen WC. Caffeic acid phenethyl ester decreases acute pneumonitis after irradiation in vitro and in vivo. BMC Cancer. 2005;5:158. doi: 10.1186/1471-2407-5-158. [DOI] [PMC free article] [PubMed] [Google Scholar]
- 43.Linard C, Marquette C, Mathieu J, Pennequin A, Clarencon D, Mathe D. Acute induction of inflammatory cytokine expression after gamma-irradiation in the rat: effect of an NF-kappaB inhibitor. Int. J. Radiat. Oncol. Biol. Phys. 2004;58(2):427–434. doi: 10.1016/j.ijrobp.2003.09.039. [DOI] [PubMed] [Google Scholar]
- 44.del Sol A, Fujihashi H, O'Meara P. Topology of small-world networks of protein-protein complex structures. Bioinformatics. 2005;21(8):1311–1315. doi: 10.1093/bioinformatics/bti167. [DOI] [PubMed] [Google Scholar]
- 45.Cormen TH, Leiserson CE, Rivest RL, Stein C. Introduction to Algorithms. (second ed.) 2001 The MIT Press. [Google Scholar]
- 46.Goodman RB, Pugin J, Lee JS, Matthay MA. Cytokine-mediated inflammation in acute lung injury. Cytokine Growth Factor Rev. 2003;14(6):523–535. doi: 10.1016/s1359-6101(03)00059-5. [DOI] [PubMed] [Google Scholar]
- 47.Kurdowska A, Miller EJ, Krupa A, Noble JM, Sakao Y. Monoclonal antibodies to rabbit alpha-2-macroglobulin and their use in a sensitive ELISA assay. J. Immunol. Methods. 2002;270(2):147–153. doi: 10.1016/s0022-1759(02)00278-8. [DOI] [PubMed] [Google Scholar]
- 48.Idell S, Mazar AP, Bitterman P, Mohla S, Harabin AL. Fibrin turnover in lung inflammation and neoplasia. Am. J. Respir. Crit. Care Med. 2001;163(2):578–584. doi: 10.1164/ajrccm.163.2.2005135. [DOI] [PubMed] [Google Scholar]
- 49.Isaac L, Florido MP, Fecchio D, Singer LM. Murine alpha-2-macroglobulin increase during inflammatory responses and tumor growth. Inflamm. Res. 1999;48(8):446–452. doi: 10.1007/s000110050485. [DOI] [PubMed] [Google Scholar]
- 50.Rouse RL, Murphy G, Boudreaux MJ, Paulsen DB, Penn AL. Soot nanoparticles promote biotransformation, oxidative stress, and inflammation in murine lungs. Am. J. Respir. Cell Mol. Biol. 2008;39(2):198–207. doi: 10.1165/rcmb.2008-0057OC. [DOI] [PubMed] [Google Scholar]
- 51.Craft J, Spencer S, Al-Lozi R, Bradley J, Deasy J, El Naqa I. American Society for Radiation Oncology (ASTRO) Chicago, IL: 2009. Integrating serum biomarkers and dose-volume metrics to predict radiation pneumonitis. [Google Scholar]
Associated Data
This section collects any data citations, data availability statements, or supplementary materials included in this article.


