Abstract
Although little is known of potential function for conserved signaling proteins, it is hypothesized that such proteins play important roles to coordinate cellular responses to environmental stimuli. In order to elucidate the function of a putative sensory box protein (PAS domains) in Shewanella oneidensis MR-1, the physiological role of SO3389 was characterized. The predicted open reading frame (ORF) encodes a putative sensory box protein that has PAS, GGDEF, and EAL domains, and an in-frame deletion mutant was constructed (ΔSO3389) with approximately 95% of the ORF deleted. Under aerated conditions, wild-type and mutant cultures had similar growth rates, but the mutant culture had a lower growth rate under static, aerobic conditions. Oxygen consumption rates were lower for mutant cultures (1.5-fold), and wild-type cultures also maintained lower dissolved oxygen concentrations under aerated growth conditions. When transferred to anoxic conditions, the mutant did not grow with fumarate, iron(III), or dimethyl sulfoxide (DMSO) as electron acceptors. Biochemical assays demonstrated the expression of different c-type cytochromes as well as decreased fumarate reductase activity in the mutant transferred to anoxic growth conditions. Transcriptomic studies showed the inability of the mutant to up-express and down-express genes, including c-type cytochromes (e.g., SO4047/SO4048, SO3285/SO3286), reductases (e.g., SO0768, SO1427), and potential regulators (e.g., SO1329). The complemented strain was able to grow when transferred from aerobic to anoxic growth conditions with the tested electron acceptors. The modeled structure for the SO3389 PAS domains was highly similar to the crystal structures of FAD-binding PAS domains that are known O2/redox sensors. Based on physiological, genomic, and bioinformatic results, we suggest that the sensory box protein, SO3389, is an O2/redox sensor that is involved in optimization of aerobic growth and transitions to anoxia in S. oneidensis MR-1.
INTRODUCTION
In the postgenomic era, uncharacterized genes pose a major challenge in biology (16), and many sequenced genomes still contain a large fraction (up to 30 to 40%) of genes without defined physiological roles (13). In fact, many aspects of signaling and stress response most likely reside in this fraction of genes for a given organism and underlie the lack of understanding in physiological responses and control of metabolism. Many uncharacterized genes/proteins are classified as sensory box proteins based upon conserved domains, but signals and cellular responses for most presumptive sensory box proteins are not known.
Shewanella oneidensis MR-1, a facultative anaerobe classified as a gammaproteobacterium, can utilize numerous inorganic compounds as electron acceptors (e.g., oxygen, nitrate, and metals). The S. oneidensis MR-1 genome sequence was determined (20), and the most recent annotation of the 5.1-Mb genome estimated 4,467 genes, of which 1,623 had hypothetical functions (28). Many bacteria considered to be “environmental” organisms typically have diverse metabolic capacity, particularly facultative organisms such as Shewanella spp., and aside from well-studied systems (e.g., Escherichia and Bacillus pathogens) little is known about how these organisms sense and respond to changing environments.
An earlier study reported a correlation between the total number of PAS protein domains (Drosophila period clock, aryl hydrocarbon receptor, single-minded protein) (41) and the numbers of respiratory and photosynthetic electron transport-associated proteins in completely sequenced microbial genomes (59). The MR-1 genome has approximately 31 open reading frames (ORFs) that are predicted to encode PAS domains, and this compares to approximately 15 PAS domains in Escherichia coli K-12 MG1655 (www.microbesonline.org). PAS domains are usually part of larger polypeptides involved in signal transduction (one- and two-component systems), and previous studies have shown that PAS domains can sense changes in environmental stimuli, such as light, redox potential, oxygen, and energy state of the cell (53). A high number of PAS proteins likely coincide with the fact that MR-1 can utilize a wide variety of electron acceptors and must be able to coordinate a diverse metabolic capacity with various environmental conditions.
The Pfam database (version 24.0) reports 33,313 sequences classified in the PAS protein clan, which contains 7 families, and the PAS and PAC motifs adopt a single globular fold of approximately 100 residues now known as the PAS domain (34). PAS domains are observed in all three domains of life, including metazoans, in which the domains can be part of hypoxia-inducible factors that play important roles in anaerobic metabolism, oxygen delivery, and angiogenesis (46). These observations indicate the importance of PAS proteins in biology; however, physiological roles for the vast majority of putative PAS proteins are unknown.
The fact that most sequenced genomes contain a high percentage of conserved hypothetical proteins with unknown physiological roles represents a knowledge gap across biology, and the current work set out to characterize the physiological role of a conserved sensory box protein. The mutant was affected in low-oxygen growth responses and transitions to anoxia, and these phenotypes could be at least partially explained by altered c-type cytochrome content, oxygen consumption, and reductase activity. In addition, the modeled PAS domain structure suggested high structural similarity to known flavin adenine dinucleotide (FAD)-based O2/redox sensors.
MATERIALS AND METHODS
Sequence comparisons.
The Smart (Simple Modular Architecture Research Tool) database (version 6.0) and the MicrobesOnline website were used for domain predictions and comparisons as previously described (11, 31). Phylogenetic and molecular evolutionary analyses were conducted with MUSCLE (version 3.7) (www.ebi.ac.uk/Tools/muscle/index.html) and within the MicrobesOnline workbench (www.microbesonline.org). Maximum likelihood trees were constructed with a Jones, Taylor, and Thornton (JTT) model with no correction for across-site rate variation with the MicrobesOnline workbench. The protein model for SO3389 was predicted with CPHmodels (version 3.0) and I-Tasser (37, 43). The CPHmodels quality was checked with QMEAN (3), ProSA (58), and MolProbity (10). I-Tasser has an internal method to check model quality (43). Protein Structural Alignment (version 3.04) with GANGSTA+, DaliLite (version 3.1), Phyre (version 0.2), and I-Tasser were used for structural alignments with crystal structures of known PAS domains (19, 23, 25, 43).
Mutant construction.
An approximately 2.4-kbp fragment was deleted from SO3389 (2,639 bp) with PCR-based crossover amplification as described previously (1, 17, 56). The primer pairs used to generate two DNA fragments with 3′-staggered ends were as follows: No-5′-CGCGAGCTCGTTCGGACCTTCGATAAATC-3′ and Ni-5′-TGTTTAAACTTAGTGGATGGGGCCCAATCTGTTAACTGCTT-3′ and Co-5′-CGCGAGCTCGCACCTTGACGCAAATGATC-3′ and Ci-5′-CCCATCCACTAAGTTTAAACAGCGGATGTTGAGGCCTTTTT-3′ (noncomplementary tag sequences are underlined), and the outside primers were used to amplify a fusion molecule. The crossover PCR product was purified and digested by SacI, cloned into treated suicide vector pDS3.0, and electroporated into E. coli S17-1/λpir. The suicide plasmid construct was moved into MR-1 as previously described (56), and the mutated SO3389 gene was verified by PCR (5′-GAGTGGCATTCAGCACTAGA-3′ and 5′-CATACGGTCGGCTTCATCAA-3′) and sequence determination. The resulting mutant did not possess any of the predicted domains after completion of the in-frame deletion. The mutation was an in-frame deletion that removed approximately 2,400 bp of the gene.
ΔSO3389 complementation.
Multiple vectors (pACYC184, pJB3Cm6, pBBR1MCS-5, and pBAD; see Table 1) were attempted for complementation, but construction of the correct, stable E. coli strain was not successful or expression was not detected in the case of pBAD. Therefore, pBBR1MCS-2 and pBBAD were used, and the following complementation primers were used to amplify genomic DNA: 3389FWDCOM (GAATTCTGTCTGCGGTAATATCTGCG) and 3389REVCOM (GGATCCCACCAAAAGCAATCATGTCG) (Table 1). The amplicon was cloned into a TOPO vector and digested with EcoRI and BamHI. After digestion, the insert was purified with a QIAquick gel extraction kit as per the instructions and subsequently cloned by ligation into vectors pBBR1MCS-2 and pBBAD at 1:3 and 1:10 molar ratios (vector to insert), also digested using EcoRI and BamHI. To increase transformation efficiency, ligations were transformed into E. coli UQ950 and then E. coli WM3064, a diaminopimelic (DAP) auxotroph. Transformants thus obtained were verified for inserts by PCR. The correct transformant was then mated with ΔSO3389 onto an LB-DAP (0.3 mM) plate and incubated at 30°C for 24 h. Transconjugants were selected by streaking mating mixtures onto LB-kanamycin-50.
Table 1.
Strains and vectors
| Strain and vector | Description | Reference |
|---|---|---|
| Strains | ||
| S. oneidensis MR-1 | 20 | |
| ΔSO3389 mutant | In-frame deletion of SO3389 | This study |
| ΔSO3389-pBBR1MCS-SO3389 mutant | Complemented strain | This study |
| Escherichia coli | ||
| S17-1/λpir | Mating strain | 56 |
| UQ950 | MDH5α/λpir | 45 |
| WM3064 | DAP autotroph | 45 |
| Vectors | ||
| pJB3Cm6 | Expression vector | 4 |
| pBBR1MCS-2 | Expression vector | 29 |
| pBBR1MCS-5 | Expression vector | Gift from Y. Yang |
| pACYC184 | Expression vector | 36 |
| pBAD | Expression vector | 50 |
| pBBAD | Expression vector | 52 |
| pDS3.0 | Pir-dependent suicide vector | 56 |
Growth.
The mutant was grown in aerobic and anoxic defined minimal medium. The defined medium (HBa) contained the following ingredients: PIPES [piperazine-N,N′-bis(2-ethanesulfonic acid)], 3 mM; NaOH, 7.5 mM; NH4Cl, 28 mM; KCl, 1.3 mM; NaH2PO4, 4.4 mM; Na2SO4, 30 mM; minerals, 10 ml l−1; vitamins, 10 ml l−1; and lactate, 90 mM. Amino acids, CaCl2 (0.7 mM), and electron acceptors [fumarate, Fe(III)-citrate, dimethyl sulfoxide (DMSO)] were added after autoclaving. The vitamin mix contained biotin, 0.002 g liter−1; folic acid, 0.002 g liter−1; pyridoxine HCl, 0.01 g liter−1; riboflavin, 0.005 g liter−1; thiamine, 0.005 g liter−1; nicotinic acid, 0.005 g liter−1; pantothenic acid, 0.005 g liter−1; B-12, 0.0001 g liter−1; p-aminobenzoic acid, 0.005 g liter−1; and thioctic acid, 0.005 g liter−1. The amino acid mix contained glutamic acid, arginine, and serine (2.0 g liter−1 each). The mineral mix contained nitrilotriacetic acid, 1.5 g liter−1; MgSO4, 3.0 g liter−1; MnSO4·H2O, 0.5 g liter−1; NaCl, 1.0 g liter−1; FeSO4·7H2O, 0.1 g liter−1; CaCl2·2H2O, 0.1 g liter−1; CoCl2·6H2O, 0.1 g liter−1; ZnCl2, 0.1 g liter−1; CuSO4·5H2O, 0.01 g liter−1; AlK(SO4)2·12H2O, 0.01 g liter−1; H3BO3, 0.01 g liter−1; Na2MoO4, 0.03 g liter−1; NiCl2·6H2O, 0.03 g liter−1; and Na2WO4·2H2O, 0.03 g liter−1. For aerobic growth, cultures (50 ml) were grown in 300-ml shake flasks (various rpm at 30°C). Static cultures were grown as 50-ml cultures in 300-ml side-arm flasks but were not shaken. Anoxic medium was prepared by boiling under O2-free N2 gas, dispensed into sparged tubes (N2) or bottles, and sealed with butyl stoppers and aluminum crimp seals. Anoxic growth was done at 30°C, and growth was monitored via a spectrophotometer (600 nm).
Growth for transcriptomic analysis.
Wild-type and mutant cells were grown as described above or anoxically in 2-liter medium bottles, and then the cells were harvested, centrifuged at 4°C, and snap-frozen in triplicate for RNA extraction. For wild-type growth, samples were collected during aerobic exponential-phase growth, 10 h postinoculation in anoxic medium (anoxic, exponential-phase growth), and approximately 70 h into anoxic growth (anoxic, stationary-phase growth). Samples for mutant cell growth were harvested at similar time points, and 10 h postinoculation into anoxic medium represented the lag phase for the mutant when transferred to anoxia. All samples were centrifuged and snap-frozen in triplicate, and RNA was extracted and used subsequently for microarray analysis.
Transcriptomics.
Microarray fabrication, hybridization, probe labeling, image acquisition, and processing were carried out as described previously (1, 17). Gene expression analysis was performed using three biological replicates for each microarray experiment, and each slide contained two replicates of two independent probes for each considered gene in the S. oneidensis MR-1 transcriptome (32). Microarray data analyses were performed using gene models from NCBI. All mRNA changes were assessed with total genomic DNA as a control. Log2 ratios and z scores were computed as previously described (32).
DO and ORP measurements.
Dissolved oxygen (DO) was measured with an SG6 DO meter (Mettler Toledo) at 5-s intervals for 4 min. Oxidation-reduction potential (ORP) was measured via an HQ20 probe (Hach) at 5-s intervals for 4 min. Measurements were made for wild-type and mutant cultures at similar cell densities (optical density [OD] at 600 nm of approximately 0.3) during static incubation of an aerobic culture or during growth at a respective shake speed. It should be noted that cultures were pregrown at the respective condition and the inoculums were in mid-exponential phase.
SDS-PAGE and cytochrome stain.
In order to determine the c-type cytochrome content of wild-type and mutant cells, spheroplast and periplasmic fractions were obtained as previously described (42). Prior to electrophoresis, samples were incubated with urea and SDS at room temperature (1 h) as previously described (42) and separated on a gradient polyacrylamide gel (4 to 20%). The c-type cytochromes were observed via a heme-linked peroxidase stain with TMBZ (3,3′,5,5′-tetramethylbenzidine) as previously described (42). Protein was quantified via the Lowry method, with serum albumin as the standard.
Fumarate reductase.
Cells were harvested and sonicated at a constant rate (1-s bursts) for 12 s on ice 4 times. After sonication, cells were centrifuged at 4°C for 15 min at 9,000 × g. Protein concentrations were obtained via the Lowry method, and equal amounts of protein were loaded. Fumarate reductase activity in native gels was detected as a clear band as a result of oxidized methyl viologen after the addition of fumarate (250 mM). Gels were incubated in a round-bottom flask with 10 mM methyl viologen in 0.05 M potassium phosphate (10 ml; pH 7.2; 1 mM sodium dithionite) that was gassed continuously with oxygen-free N2 (33).
Fumarate reductase activity was quantified by the benzyl viologen-linked reductase assay as described previously (49, 57). Reagents (75 mM sodium phosphate buffer [pH 6.8], 0.2 mM benzyl viologen, and cell extract) were added to a 1-ml cuvette through the stopper while being gassed continuously. Sodium dithionite (20 mM) was added to the cuvette until absorbance at 585 nm reached 0.8 to 0.9 (half-reduced benzyl viologen). Sodium fumarate (5 mM, final concentration) was then added to the mixture, and oxidation was immediately recorded at 585 nm. Activity was expressed in millimoles of benzyl viologen oxidized minute−1 microgram−1.
Quantitative PCR.
Quantitative PCR (qPCR) was performed with RNA extracts from wild-type and mutant cells under aerobic and anoxic conditions. cDNA was prepared by reverse transcription with 5 μg RNA. A mixture was prepared containing RNA and random primers and was incubated at 70°C for 10 min and then cooled on ice. Reverse transcription was performed by adding 4 μl dithiothreitol (DTT), 1 μl deoxynucleoside triphosphates (dNTPs) at 10 mM, 1 μl RNase inhibitor, and 1 μl R reverse transcriptase (Invitrogen). cDNA was generated with incubation at 42°C for 2 h and 70°C for 15 min. After being cooled, the concentration of cDNA was measured at 260 nm. In order to perform quantitative PCR, cDNA was first diluted to 20 ng μl−1, and 2 μl of diluted sample was used per reaction. Primers were added at a 10 mM concentration along with SYBR green Master Mix (Applied Biosystems) and nuclease-free water. Standards were prepared by carrying out serial dilution of genomic DNA, starting with 108 copies μl−1 to 101 copies μl−1. Negative control without cDNA was included along with all runs. qPCR was performed using Smart Cycler II (Cepheid) by using the following conditions: initial denaturation, 95°C for 9.5 min; amplification, 95°C for 15 s, 55°C for 30 s, and 60°C for 30 s. Stage 2 was repeated to complete 45 cycles. Final extension was at 60°C for 95 s.
Total heme quantification.
Wild-type and mutant cells were harvested and sonicated at a constant rate for 15 s (4 times) on ice. Cells were then centrifuged at 4°C for 15 min at 9,000 × g. Protein was quantified by the Lowry assay of the fractions obtained after sonication. Total heme was measured per μg of protein using the QuantiChrom heme assay kit according to the manufacturer's instructions (BioAssay Systems).
RESULTS AND DISCUSSION
SO3389 in Shewanella.
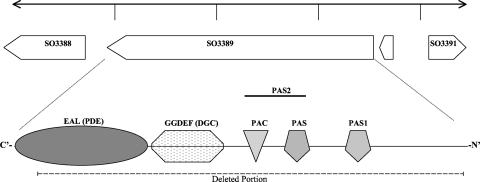
The predicted monocistronic ORF (SO3389) encodes a putative 879-amino-acid polypeptide, and the predicted protein was assigned to COG5001, which contained EAL (E value of 4.0e−111; named for conserved amino acids), GGDEF (E value of 3.6e−62; named for conserved amino acids), and PAS (5.5e+0.0; E value of 2.4e−08) domains (Fig. 1; E values are from the SMART database). The respective Interpro families were IPR003018, IPR000014, IPR013656, and IPR013767 (http://www.ebi.ac.uk/interpro/). A signal sequence was not predicted via SignalP (version 3.0) (14) or TatP (version 1.0) (2), although one hydrophobic α-helix was predicted from residue 137 to 162 with TMphred (22) and DAS (9, 9a) and weakly predicted with TMHMM (version 2.0) (35). Further work is needed to confirm the localization of SO3389 in the cytoplasm or cytoplasmic membrane.
Fig. 1.
Genome region view and domain architecture of SO3389. SO3388 is annotated as an RNA helicase, SO3390 is annotated as a small (36-amino-acid) hypothetical protein, and SO3391 is annotated as an ATP-dependent protease. The domains were predicted with SMART version 6.0 (http://smart.embl-heidelberg.de/).
Phylogenetic relationships.
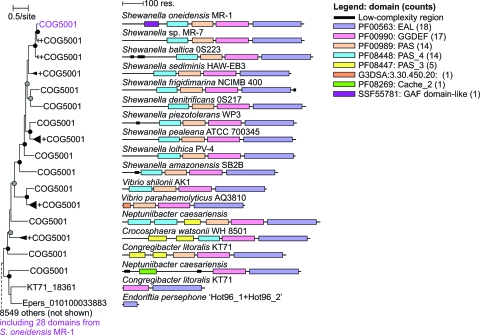
The proteins assigned to COG5001 are identified in 708 genomes from very diverse bacteria, and over 20 genomes contain 20 or more COG5001 proteins (data not shown). To date, 22 Shewanella genome sequences are available in public databases (http://img.jgi.doe.gov), and 15 contained an ortholog to SO3389 with peptide sequence identity between 52 and 85% (http://microbesonline.org). Shewanella putrefaciens CN-32, S. putrefaciens 200, Shewanella woodyi, Shewanella pealeana, Shewanella violacea, and Shewanella W3-18-1 did not contain a predicted ortholog to SO3389. The closely related sequences of SO3389 were detected in Shewanella ANA-3, Shewanella MR-4, and Shewanella MR-7 (84 to 85% identity) as well as in Vibrio species (Fig. 2). When the entire protein sequence of SO3389 was compared to sequenced genomes, the closest non-Shewanella relatives were putative sensory box proteins in Vibrio species, and sequences were also detected in Cyanothece, Neptuniibacter, Congregibacter, Crocosphaera, and Endoriftia. Based upon PAS domain sequence phylogeny (see Materials and Methods), the closest relatives to SO3389 were observed in other Shewanella and Vibrio species; however, physiological roles have not been assigned to these putative proteins (Fig. 2).
Fig. 2.
Phylogram based upon PAS domains related to SO3389 with a neighbor-joining method within the MicrobesOnline workbench (http://microbesonline.org).
Growth phenotypes.
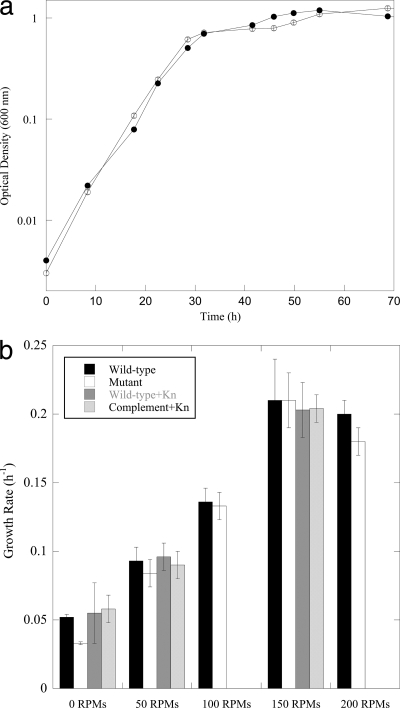
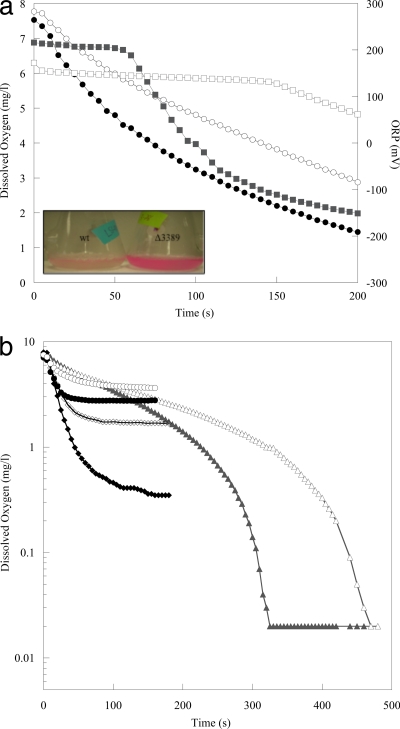
The mutant was tested for growth defects in aerobic (static and aerated) and anoxic defined minimal medium. The cell cultures (wild-type and ΔSO3389 cultures) did not differ significantly in growth rates in shaken aerobic medium (50 to 200 rpm), but the mutant culture had a lower growth rate in aerobic, static cultures than the wild type (decreased 1.6-fold; P = 0.05) (Fig. 3 a and b). Oxygen concentrations were depleted at a lower rate by mutant cells (first-order rate constants were approximately 1.5-fold lower) than those by wild-type cells when cultures grown at 150 rpm were then incubated statically (Fig. 4 a). In addition, the oxidation-reduction potential (ORP) declined at a lower rate for the mutant culture than for the wild type (Fig. 4a). When the DO concentrations were measured in actively shaken cultures, the mutant also had lower rates of O2 consumption (approximately 1.5-fold) but also had higher steady-state DO concentrations (0.35 mg l−1 [0.01 mM] versus 1.7 mg l−1 [0.05 mM] and 2.8 mg l−1 [0.09 mM] versus 3.7 mg l−1 [0.12 mM], respectively, for wild-type and mutant cultures) (Fig. 4b). These results indicated that wild-type cultures increased consumption rates in response to increasing O2 concentrations. In addition, the mutant culture was deficient in O2 regulation, which resulted in less-efficient O2 consumption at low and high O2 concentrations.
Fig. 3.
(a) Growth curves of wild-type MR-1 (•) and ΔSO3389 (○) cells in aerobic, defined minimal medium with lactate, shaken at 150 rpm (error bars represent standard deviations). (b) Growth rates of wild-type (black) and mutant (white) planktonic cultures at different shake speeds (rpm). The static wild-type and mutant cultures were statistically different (P = 0.05). In addition, wild-type with empty vector (dark gray) and complement (light gray) strains were grown at the respective shake speeds in the presence of kanamycin.
Fig. 4.
(a) Dissolved oxygen measurements for WT (•) and ΔSO3389 (○) cells and oxidative-reductive potential (mV) measurements for WT (▪) and ΔSO3389 (□) cells versus time when shaken aerobic cultures were incubated statically. The inset image shows the resazurin reduction-oxidation indicator for wild-type (left) and mutant (right) cultures postincubation. (b) The decrease in DO (mg/liter) was measured for cultures growing in lactate medium for wild-type (filled symbols) and mutant (empty symbols) cells at 0 rpm (▴,▵), 150 rpm (⧫,⋄), and 200 rpm (•,○). The data represent an average of results from multiple experiments.
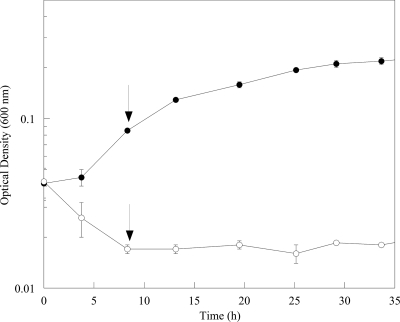
When cells were transferred from aerobic to anoxic medium with lactate and fumarate, the ΔSO3389 cells did not grow (Fig. 5). Similar results were observed when the anoxic medium contained lactate as the electron donor and DMSO or Fe(III)-citrate as the electron acceptor (data not shown). These results indicated that the mutant was deficient in response to anoxia.
Fig. 5.
Growth curves of wild-type MR-1 (•) and ΔSO3389 (○) cells in anaerobic, defined minimal medium with lactate and fumarate. Aerobic cultures were grown in shake flasks and used to inoculate anoxic cultures to similar initial ODs. The arrows depict the sampling time point for transcriptomic analyses. Error bars represent standard deviations.
Complementation.
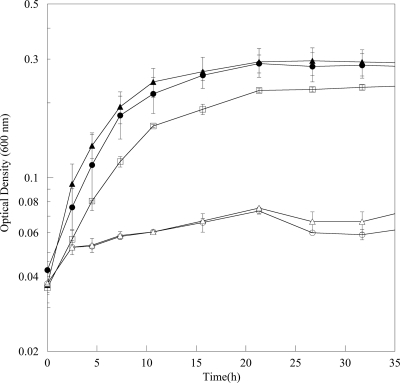
Complementation was achieved with the pBBRMCS-2 vector and a full-length SO3389 gene. The complemented strain, ΔSO3389:pBBR1MCS-2-SO3389, was able to grow when transferred to anoxic medium without a lag (Fig. 6). In addition, the complemented strain grew more similarly to the wild type (empty vector strain) under aerobic conditions (Fig. 3b). These results confirmed that the growth defect during growth at low DO concentrations and transition from aerobic conditions to anoxia were due to the ΔSO3389 mutation.
Fig. 6.
Growth curves of wild-type MR-1 (•), ΔSO3389 (○), wild-type pBBR1MCS-2 (▴), ΔSO3389 pBBR1MCS-2 (▵), and ΔSO3389::pBBR1MCS-2-SO3389 (□) cells in defined minimal medium with lactate as the electron donor and fumarate as the electron acceptor. Wild-typekn and ΔSO3389kn were constructed by mating with WM3064 empty plasmid pBBRMCS-2. Error bars represent standard deviations.
qPCR was used to monitor the expression of SO3389 and SO3388 in wild-type and mutant cells under aerobic and anoxic conditions. Wild-type cells had higher expression levels of SO3389 under aerobic and anoxic conditions than the deletion mutant (2.5-fold), and the SO3388 and SO3390 genes had similar expression levels in both wild-type and mutant cells under aerobic and anoxic conditions (data not shown). These results indicated that the ΔSO3389 mutation had not altered SO3388 or SO3390 expression.
Cytochrome c-type content.
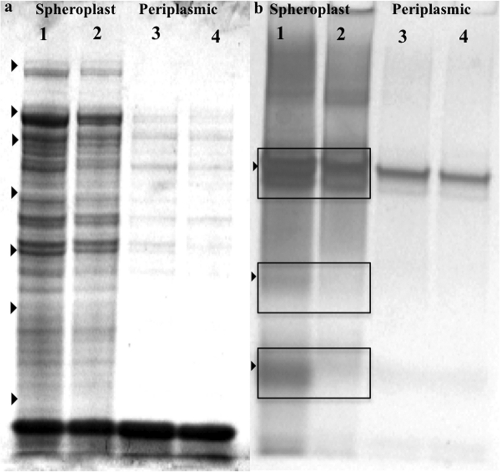
Due to the response to anoxic growth, spheroplast and periplasmic fractions were obtained as previously described in order to determine c-type cytochrome content (42). Minor differences were observed in the spheroplast and periplasmic fractions for aerobically grown wild-type and mutant cells (i.e., intensity differences). When cells were allowed to transition from aerobic to anoxic conditions (5 to 10 h posttransfer), differences were observed in the spheroplast fraction, most noticeably for heme-containing polypeptides with estimated molecular weights of 57, 33, and 20 kDa (Fig. 7 a and b). These results indicated that the ΔSO3389 mutant was deficient in at least three c-type cytochromes during the transition period from aerobic to anoxic conditions.
Fig. 7.
SDS-PAGE gels of spheroplast (lanes 1 and 2) and periplasmic-shock (lanes 3 and 4) fractions of wild-type and ΔSO3389 cells stained with Coomassie blue for total protein (a) or cytochrome c heme stain (b). Equal amounts of total protein for wild-type (lanes 1 and 3) and ΔSO3389 (lanes 2 and 4) were loaded per well, and molecular weight markers are denoted with arrows in panel a: 150, 100, 75, 50, 35, 25, and 15 kDa.
In addition to the qualitative analysis of cytochromes, total heme content (soluble and membrane) was quantified for wild-type and mutant cells grown under aerobic conditions and transition to anoxia. There was not a significant difference in the heme contents of wild-type and mutant cell fractions grown aerobically (1.4 ± 0.1 versus 1.5 ± 0.1 ng μg−1 protein), and these data coincided with the similar cytochrome profile of wild-type and mutant cells grown under aerobic conditions. During the transition to anoxia, the mutant cells exhibited elevated levels of heme in comparison to wild-type cells from membrane fractions (0.15 ± 0.01 versus 0.27 ± 0.06 ng μg−1 protein).
Gene expression.
A possible explanation for elevated heme content in the mutant is the overexpression of heme-containing proteins in order to compensate for the decline in oxygen affinity (at the cellular level) and/or the mutant failed to down-express certain cytochromes typically expressed during aerobic growth once transferred to anoxia. The later explanation is more likely and coincides with the microarray data for numerous cytochromes that were significantly down-expressed in wild-type but not mutant cells upon transfer to anoxia (e.g., SO3285, SO3286, SO1427) (Table 2). During the transition from aerobic to anoxic conditions, wild-type cells up-expressed 54 genes and down-expressed 103 genes (log2 values of ≥2.0 and z scores of ≥2.0). In comparison, under the tested transitions from aerobic to anoxic conditions, the mutant cells did not have any significant expression changes that were greater than 2.0 (z scores of ≥2.0).
Table 2.
Comparison of log2 expression levels for selected genes when wild-type or mutant cells were compared between aerobic and anoxic conditions, respectivelya
| Gene | Gene annotation | Log2 expression (z score) when transferred to anoxia |
|
|---|---|---|---|
| Wild-type culture | ΔSO3389 culture | ||
| SO0054 | Conserved hypothetical (oxidoreductase) | 1.55 (2.23) | 0.06 (0.10) |
| SO0399 (frdB) | Succinate dehydrogenase/fumarate reductase | −1.35 (−2.09) | 0.17 (0.31) |
| SO0583(bfd) | Bacterioferritin-associated ferredoxin | 2.89 (3.15) | 0.67 (1.01) |
| SO0768 | Flavin reductase | 2.90 (3.36) | 0.63 (1.38) |
| SO1329 (cyaA) | Adenylate cyclase | 2.11 (2.88) | 0.41 (0.73) |
| SO1427 | Decaheme cytochrome c DMSO reductase subunit | −3.30 (−2.64) | 0.79 (1.16) |
| SO1519 | l-Lactate dehydrogenase (subunit) | −0.67 (−1.63) | 0.15 (0.40) |
| SO1520 | FeS cluster protein | −1.05 (−1.83) | −0.38 (−0.75) |
| SO1521 | d-Lactate dehydrogenase | −2.17 (−2.51) | −0.76 (−1.42) |
| SO1522 | Lactate permease | −2.37 (−3.26) | −1.46 (−1.70) |
| SO1927 (sdhC) | Succinate dehydrogenase | 1.29 (1.59) | 0.24 (0.63) |
| SO1928 (sdhA) | Succinate dehydrogenase/fumarate reductase | 1.06 (1.12) | 0.12 (0.22) |
| SO1929 (sdhB) | Succinate dehydrogenase/fumarate reductase | 0.77 (1.78) | 0.34 (1.09) |
| SO1930 (sucA) | 2-Oxoglutarate dehydrogenase (E1) | 2.01 (2.98) | 0.90 (1.72) |
| SO1931 (sucB) | 2-Oxoglutarate dehydrogenase (E2) | 1.43 (2.59) | 0.63 (1.34) |
| SO1932 (sucC) | Succinyl-CoA synthase (β) | 1.33 (2.16) | 0.79 (1.45) |
| SO2097 (hydC) | Ni/Fe hydrogenase | −3.22 (−2.41) | −0.53 (−0.89) |
| SO2098 (hyaB) | Ni/Fe hydrogenase | −3.46 (−2.49) | 1.22 (1.04) |
| SO3285 (cydB) | Cytochrome oxidase | −3.24 (−2.97) | −1.14 (−1.68) |
| SO3286 (cydA) | Cytochrome oxidase | −2.69 (−3.02) | −0.68 (−1.17) |
| SO4047 | Monoheme cytochrome c | 0.86 (2.03) | 0.45 (1.29) |
| SO4048 | Monoheme cytochrome c | 0.91 (2.16) | 0.20 (0.70) |
Bolding, up-expressed genes; underlining, down-expressed genes (|z score| > 1.6). The time of sampling for anoxic culture is denoted by the arrow in Fig. 5.
SO1427 was previously shown to be a DMSO reductase subunit (18), and the expression data suggested that SO3389 could be involved in coordinating the expression of reductases in the absence of oxygen. Interestingly, SO0054 displayed increased expression in the wild-type cells compared to that in the mutant cells upon transfer to anoxia (Table 2). SO0054 is assigned to a family of conserved hypothetical proteins that belong to COG2081 (predicted flavoproteins) and IPR013027 (FAD-linked oxidoreductases). Future work is needed to elucidate a possible role for SO0054 during transitions to anoxic growth conditions.
S. oneidensis MR-1 has over 40 putative cytochrome c genes, and two putative monoheme cytochrome c genes (SO4047 and SO4048) located in an operon were up-expressed in wild-type cells but not in mutant cells after transfer to anoxia (Table 2). The predicted molecular weights are 38 and 21 kDa, respectively. A putative decaheme cytochrome c gene (SO4360) has a predicted molecular weight of 33.1 kDa, and expression for SO4360 was lower in the mutant culture transferred to anoxia than in the wild type (log2 R = −0.91; z score = −2.10). Recently, SO4360 was predicted to be an mtrA paralog, but a specific function for the cytochrome is not known (7).
Recent work demonstrated that S. oneidensis MR-1 can utilize both l- and d-lactate, and it was hypothesized that SO1518 to SO1520 encodes an l-lactate dehydrogenase and SO1521 encodes a d-lactate dehydrogenase (40). In our study, these genes were down-expressed in wild-type but not mutant cells when transitioned to anoxia compared to in aerobic cells. The Pinchuk et al. (40) study reported that these genes functioned under both aerobic and anaerobic conditions, and the decreased expression observed in our study might be a result of a decline in lactate consumption under anoxic conditions compared to that under aerobic conditions. The results suggested that SO3389 plays a potential role in down-expressing genes involved in lactate consumption when oxygen becomes limited.
The fccA (SO0970) gene in S. oneidensis has been shown to be a major soluble fumarate reductase during anaerobic growth (39), but fccA expression was not significantly up-expressed at the transcriptional level in wild-type or mutant cultures under the tested conditions. However, recent work has shown that FccA might be involved in multiple periplasmic electron transfer networks (48). It should be noted that gene expression was done with cultures that had been grown aerobically and then transferred to anoxic conditions; therefore, gene expression for some genes may differ from those reported in previous studies that have used cultures grown in prereduced, anaerobic medium for longer time periods. The current study was focused on the transition from aerobic to anoxic conditions, for which the mutant was deficient.
Wild-type cells had slightly elevated expression levels for a succinate dehydrogenase/fumarate reductase operon (sdh; SO1927 to SO1929) compared to those of the mutant, and the mutant also did not up-express components of the 2-oxoglutarate dehydrogenase (sucAB) or succinyl coenzyme A (succinyl-CoA) synthase (sucC) (Table 2). These tricarboxylic acid cycle enzymes were up-expressed in wild-type cells transferred to anoxia compared to in aerobic cells and may be a result of carbon flow from the added glutamate. However, mutant cells did not up-express the same genes when transferred to anoxia and further indicated that the mutant was deficient in the ability to respond to anoxic conditions.
A presumptive bacterioferritin-associated ferredoxin (SO0583), a flavin reductase (SO0768), and a presumptive adenylate cyclase (SO1329) were also up-expressed in wild-type but not mutant cells when transferred to anoxia (Table 2). The class III adenylate cyclase was recently shown to regulate anaerobic respiration in S. oneidensis MR-1, and separate studies have shown that cyclic AMP (cAMP) levels were involved in the regulation of anaerobic respiration (8, 44). Hence, SO3389 may be a sensor involved in the global regulation of different modulators for the up- and down-expression of genes related to shifts between aerobic and anoxic metabolism.
Fumarate reductase activity.
Because the transition to anoxic conditions was done in the presence of lactate and fumarate, fumarate reductase activities were measured. During the transition, wild-type cells increased fumarate reductase activity more than mutant cells as detected with activity gels, and this further corroborated the observation that the reductase activity necessary for anoxic growth was not up-expressed in mutant cells during the transition to anoxia. A small amount of activity was detected in the mutant cultures, but this activity was similar to the levels observed in aerobic cultures. In addition, fumarate reductase activity was quantified in wild-type and mutant cultures spectrophotometrically during the transition to anoxia. After transfer to anoxic medium, activity was not detected for the mutant, compared to 0.76 ± 0.09 mM benzyl viologen min−1 μg−1 for wild-type cultures.
Structural similarity to PAS O2/redox sensors.
A role in O2/redox sensing for SO3389 coincides with the strong evidence that PAS domains can be sensors for gases (e.g., O2) and/or intracellular redox potentials (53). For example, the PAS protein NifA has been shown to respond to O2 via a flavin adenine dinucleotide (FAD) (6), and the E. coli Dos protein (EcDos) is a heme-containing gas sensor that has N-terminal PAS domains (12). PAS domain families comprise a protein clan with divergent sequences (15); however, a recent study characterized the structures of PAS domains with known and unknown cofactors and showed a broadly conserved structure that is comprised of a five-stranded antiparallel β-sheet and several α-helices for all PAS domains characterized to date (34).
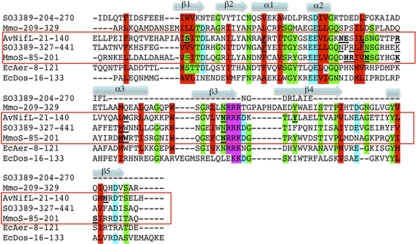
The NifL sensor has been shown to be a reversible, FAD-based O2/redox sensor that helps control the expression of nitrogen fixation genes in Azotobacter (21, 26). More recently, the MmoS in Methylococcus capsulatus (strain Bath) has been shown to be an FAD-based PAS sensor that coordinates responses to Cu via changes in redox (55). The SO3389 PAS1 domain did not have significant (E value of >0.1) amino acid sequence identity with characterized PAS domains but had 50% amino acid sequence identity (E value of 4.7e−12; SMART database) with a hypothetical protein (VP0092) in Vibrio parahemolyticus. The SO3389 PAS2 domain had the highest peptide sequence identity (42% [E value of 4e−23]) with the MmoS PAS1 domain from M. capsulatus (followed by 38% [3e−12] with EcAer PAS [E. coli], 31% [2e−20] with AzNifL PAS [Azotobacter vinelandii], 28% [1e−13] with MmoS PAS2 [M. capsulatus], and 23% [4e−06] with EcDos PAS [E. coli]). Important residues for FAD binding were previously predicted from the crystal structure of MmoS (55), and the SO3389 PAS2 peptide sequence shared 6 of these MmoS residues and also 5 of the 10 conserved amino acids for FAD binding in the A. vinelandii NifL (Fig. 8).
Fig. 8.
Alignment of M. capsulatus MmoS PAS1 (amino acids 85 to 201), M. capsulatus MmoS PAS2 (amino acids 209 to 329), A. vinelandii NifL PAS (amino acids 21 to 140), E. coli Dos PAS (amino acids 16 to 133), B. japonicum FixL PAS (amino acids 151 to 257), SO3389 PAS1 (amino acids 204 to 270), and SO3389 PAS2 (amino acids 327 to 441). Hydrophobic or small residues are colored red, acidic residues are colored cyan, basic residues are colored magenta, and residues with hydroxyl or amine are colored green. Important residues for FAD ligand interactions in MmoS and NifL are denoted by underlining and bolding, and similar residues are underlined in SO3389 PAS2. Approximate location of β-sheets and α-helices are denoted based upon the MmoS crystal structure (3EWK) (58).
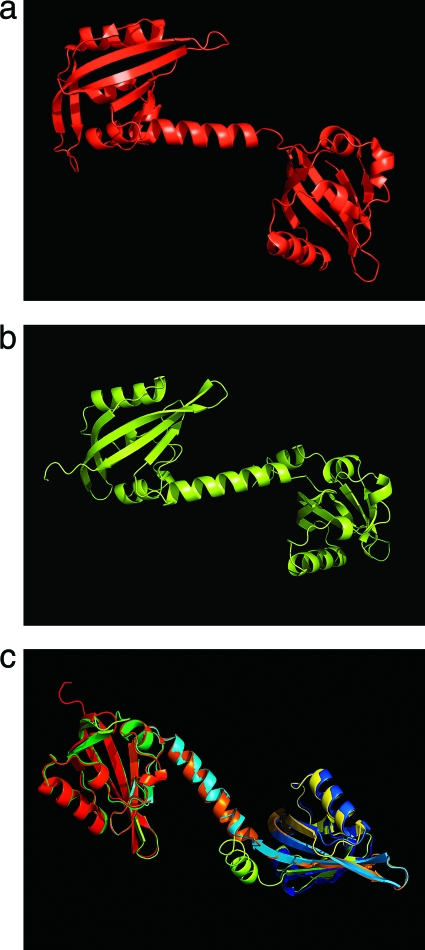
In order to compare SO3389 to known PAS domain structures, models were predicted with CHPModels and I-Tasser tools. Both models were similar, and the I-Tasser model was used for analysis. The I-Tasser model for the SO3389 PAS1/2 domains had a C score of 0.8, a TM score of 0.7 ± 0.1, and an experimental RMSD (root mean square deviation) of 5.6 ± 3.5 (positive C scores and TM scores of >0.5 indicate models with correct topology) (43). Moglich et al. (34) used z scores from structural superpositions to construct a dendrogram based upon the degree of structural diversity between PAS domains from different proteins, and PAS domains with known cofactors (i.e., FMN, FAD, and heme) formed separate clusters. Therefore, we compared the predicted model of SO3389 PAS1/2 to known PAS sensors to gain insight into possible functions of SO3389 in conjunction with the presented phenotypic data.
The I-Tasser model (http://zhanglab.ccmb.med.umich.edu/I-TASSER) predicted the closest match with 3EWK from M. capsulatus (91% coverage; z score of 4.91) (Fig. 9). When the DALI Protein Structure Database (version 3.0; http://ekhidna.biocenter.helsinki.fi/dali_server/start) was used, the closest matches with the SO3389 PAS1/2 model were the FAD-binding MmoS PAS1 from M. capsulatus (3EWK) and the NifL PAS1 (2GJ3) from A. vinelandii (RMSD of 0.6 Å, z score of 24.9; RMSD of 1.4 Å, z score of 15.4, respectively). In addition, the Phyre server (http://www.sbg.bio.ic.ac.uk/∼phyre/index.cgi) predicted that 2GJ3 was the closest match based upon protein sequence and structure (E value of 2.3e−15; 30% sequence identity). Both 2GJ3 and 3EWK are known FAD-based redox PAS sensors (26, 51, 55).
Fig. 9.
Structure of the M. capsulatus MmoS (a) (PDB:3EWK) and SO3389 (b) PAS domains and the structural superposition (c). The SO3389 PAS domain model was predicted with I-Tasser, and the structural alignment was visualized with PyMol (www.pymol.org).
The SO3389 ORF also contains putative GGDEF and EAL domains (originally named for the conserved amino acid residues) (9, 24, 38). The two domains are thought to interact with cyclic-diguanosine monophosphate (c-di-GMP), and c-di-GMP was recently proposed to be a global secondary messenger involved in regulating cell-cell and cell-surface interactions (9). The GGDEF domain was recently shown to be associated with the synthesis of c-di-GMP via diguanylate cyclase (DGC) and the EAL domain to contain phosphodiesterase (PDE) activity in Yersinia, Caulobacter, and Salmonella (9, 16, 27, 24, 38) and more recently in Shewanella (54). In addition, the involvement of DGC and PDE domains in cell metabolism and cell behavior has recently been shown in Burkholderia, Xanthomonas, Streptococcus, Vibrio, and Pseudomonas (for examples, see references 5 and 30). Interestingly, sequence comparisons suggested that SO3389 was a phosphodiesterase and not a cyclase based upon conserved amino acids predicted for active phosphodiesterases (data not shown) (47).
Our data indicated that SO3389 was involved in sensing DO/redox levels that affected both aerobic growth and transitions to anoxia. The resultant phenotypes were a consequence of the inability to regulate genes that included cytochromes and reductases. The sequence and structure comparisons suggested that SO3389 could be a FAD-based O2/redox sensor, and future work includes the characterization of ligand interactions for SO3389. It is interesting to speculate that the orthologs identified in the other genera (e.g., Vibrio, Cyanothece, Endoriftia) (Fig. 2) could function in a similar manner to help cells control growth associated with O2 and/or anoxia.
The most similar gene sequences to that of SO3389 were annotated as conserved hypothetical and sensory box proteins, and thus SO3389 encodes a novel protein for which a function has not been previously described. Numerous systems biology studies have demonstrated the often realized but unknown importance of hypothetical and conserved hypothetical proteins in microorganisms (13), and the elucidation of function for these proteins provides great insight into the ability of microorganisms to sense external stimuli and optimize metabolism.
ACKNOWLEDGMENTS
This work was conducted by ENIGMA (Ecosystems and Networks Integrated with Genes and Molecular Assemblies) and was supported by the Office of Science, Office of Biological and Environmental Research, of the U.S. Department of Energy under contract no. DE-AC02-05CH11231.
M.W.F. and A.S. thank L. A. Actis and W. L. Jones for helpful discussions.
Footnotes
Published ahead of print on 20 May 2011.
REFERENCES
- 1. Beliaev A. S., et al. 2002. Microarray transcription profiling of a Shewanella oneidensis etrA mutant. J. Bacteriol. 184:4612–4616 [DOI] [PMC free article] [PubMed] [Google Scholar]
- 2. Bendtsen J. D., Nielsen H., Widdick D., Palmer T., Brunak S. 2005. Prediction of twin-arginine signal peptides. BMC Bioinformatics 6:167. [DOI] [PMC free article] [PubMed] [Google Scholar]
- 3. Benkert P., Künzli M., Schwede T. 2009. QMEAN server for protein model quality estimation. Nucleic Acids Res. 37:W510–W514 [DOI] [PMC free article] [PubMed] [Google Scholar]
- 4. Blatny J. M., Brautaset T., Winther-Larsen H. C. 1997. Construction and use of a versatile set of broad-host-range cloning and expression vectors based on the RK2 replicon. Appl. Environ. Microbiol. 63:370–379 [DOI] [PMC free article] [PubMed] [Google Scholar]
- 5. Borlee B. R., et al. 2010. Pseudomonas aeruginosa uses a cyclic-di-GMP-regulated adhesin to reinforce the biofilm extracellular matrix. Mol. Microbiol. 75:827–842 [DOI] [PMC free article] [PubMed] [Google Scholar]
- 6. Bueno E., Mesa S., Sanchez C., Bedmar E. J., Delgado M. J. 2010. NifA is required for maximal expression of denitrification genes in Bradyrhizobium japonicumemi. Environ. Microbiol. 12:393–400 [DOI] [PubMed] [Google Scholar]
- 7. Carousolle D., Gralnick J. A. 2010. Modularity of the Mtr respiratory pathway of Shewanella oneidensis strain MR-1. Mol. Microbiol. 77:995–1008 [DOI] [PubMed] [Google Scholar]
- 8. Charania M. A., et al. 2009. Involvement of a membrane-bound class III adenylate cyclase in regulation of anaerobic respiration in Shewanella oneidensis MR-1. J. Bacteriol. 191:4298–4306 [DOI] [PMC free article] [PubMed] [Google Scholar]
- 9. Christen B., et al. 2006. Allosteric control of cyclic di-GMP signaling. J. Biol. Chem. 281:32015–32024 [DOI] [PubMed] [Google Scholar]
- 9a. Cserzo M., Eisenhaber F., Eisenhaber B., Simon I. 2002. On filtering false positive transmembrane protein predictions. Protein Eng. 15:745–752 [DOI] [PubMed] [Google Scholar]
- 10. Davis I. W., et al. 2007. MolProbity: all-atom contacts and structure validation for proteins and nucleic acids. Nucleic Acids Res. 35:W375–W383 [DOI] [PMC free article] [PubMed] [Google Scholar]
- 11. Dehal P. S., et al. 2010. MicrobesOnline: an integrated portal for comparative and functional genomics. Nucleic Acids Res. 38:D396–D400 [DOI] [PMC free article] [PubMed] [Google Scholar]
- 12. Delgado-Nixon V. M., Gonzalez G., Gilles-Gonzalez M. A. 2000. Dos, a heme-binding PAS protein from Escherichia coli, is a direct oxygen sensor. Biochemistry 39:2685–2691 [DOI] [PubMed] [Google Scholar]
- 13. Elias D. A., et al. 2009. Expression profiling of hypothetical genes in Desulfovibrio vulgaris leads to improved functional annotation. Nucleic Acids Res. 37:2926–2939 [DOI] [PMC free article] [PubMed] [Google Scholar]
- 14. Emanuelsson O., Brunak S., von Heijne G., Nielsen H. 2007. Locating proteins in the cell using TargetP, SignalP, and related tools. Nat. Protoc. 2:953–971 [DOI] [PubMed] [Google Scholar]
- 15. Finn R. D., et al. 2006. Pfam: clans, Web tools and services. Nucleic Acids Res. 34:D247–D251 [DOI] [PMC free article] [PubMed] [Google Scholar]
- 16. Galperin M. Y. 2004. Bacterial signal transduction network in a genomic perspective. Environ. Microbiol. 6:552–567 [DOI] [PMC free article] [PubMed] [Google Scholar]
- 17. Gao W., et al. 2006. Knock-out of a prohibitin-like protein results in alteration of iron metabolism, increased spontaneous mutation and hydrogen peroxide sensitivity in the bacterium Shewanella oneidensis. BMC Genomics 7:76. [DOI] [PMC free article] [PubMed] [Google Scholar]
- 18. Gralnick J. A., Brown C. T., Newman D. K. 2005. Anaerobic regulation by an atypical Arc system in Shewanella oneidensis. Mol. Microbiol. 56:1347–1357 [DOI] [PubMed] [Google Scholar]
- 19. Guindon S., Gascuel O. 2003. A simple, fast, and accurate algorithm to estimate large phylogenies by maximum likelihood. Syst. Biol. 52:696–704 [DOI] [PubMed] [Google Scholar]
- 20. Heidelberg J. F., et al. 2002. Genome sequence of the dissimilatory metal ion-reducing bacterium Shewanella oneidensis. Nat. Biotech. 20:1118–1123 [DOI] [PubMed] [Google Scholar]
- 21. Hill S., Austin S., Eydmann T., Jones T., Dixon R. 1996. Azotobacter vinelandii NifL is a flavoprotein that modulates transcriptional activation of nitrogen-fixation genes via a redox-sensitive switch. Proc. Nat. Acad. Sci. U. S. A. 93:2143–2148 [DOI] [PMC free article] [PubMed] [Google Scholar]
- 22. Hofmann K., Stoffel W. 1993. TMbase—a database of membrane spanning protein segments. Biol. Chem. 374:166 [Google Scholar]
- 23. Holm L., Kaariainen S., Rosenstrom P., Schenkel A. 2008. Searching protein structure databases with DaliLite v. 3. Bioinformatics 24:2780–2781 [DOI] [PMC free article] [PubMed] [Google Scholar]
- 24. Jenal U. 2004. Cyclic di-guanosine monophosphate comes of age: a novel secondary messenger involved in modulating cell surface structures in bacteria. Curr. Opin. Microbiol. 7:185–191 [DOI] [PubMed] [Google Scholar]
- 25. Kelley L. A., Sternberg M. J. E. 2009. Protein structure prediction on the Web: a case study using the Phyre server. Nat. Protoc. 4:363–371 [DOI] [PubMed] [Google Scholar]
- 26. Key J., Hefti M., Purcell E. B., Moffat K. 2007. Structure of the redox sensor domain of Azotobacter vinelandii NifL at atomic resolution: signaling, dimerization, and mechanism. Biochemistry 46:3614–3623 [DOI] [PubMed] [Google Scholar]
- 27. Kirillina O., Fetherston J. D., Bobrov A. G., Abney J., Perry R. 2004. HmsP, a putative phosphodiesterase, and HmsT, a putative diguanylate cyclase, control Hms-dependent biofilm formation in Yersinia pestis. Mol. Microbiol. 54:75–88 [DOI] [PubMed] [Google Scholar]
- 28. Kolker E., et al. 2005. Global profiling of Shewanella oneidensis MR-1: expression of hypothetical genes and improved functional annotations. Proc. Natl. Acad. Sci. U. S. A. 102:2099–2104 [DOI] [PMC free article] [PubMed] [Google Scholar]
- 29. Kovach M. E., et al. 1995. Four new derivatives of the broad-host-range cloning vector pBBR1MCS, carrying different antibiotic-resistance cassettes. Gene 166:175–176 [DOI] [PubMed] [Google Scholar]
- 30. Krasteva P. V., et al. 2010. Vibrio cholerae VpsT regulates matrix production and motility by directly sensing cyclic di-GMP. Science 327:866–868 [DOI] [PMC free article] [PubMed] [Google Scholar]
- 31. Letunic I., Doerks T., Bork P. 2009. SMART 6: recent updates and new developments. Nucleic Acids Res. 37:D229–D232 [DOI] [PMC free article] [PubMed] [Google Scholar]
- 32. Liu Y. Q., et al. 2005. Transcriptome analysis of Shewanella oneidensis MR-1 in response to elevated salt conditions. J. Bacteriol. 187:2501–2507 [DOI] [PMC free article] [PubMed] [Google Scholar]
- 33. Lund K., DeMoss J. A. 1976. Association-dissociation behavior and subunit structure of heat released nitrate reductase from Escherichia coli. J. Biol. Chem. 251:2207–2216 [PubMed] [Google Scholar]
- 34. Moglich A., Ayers R. A., Moffat K. 2009. Structure and signaling mechanism of Per-ARNT-Sim domains. Cell Struct. 17:1282–1294 [DOI] [PMC free article] [PubMed] [Google Scholar]
- 35. Moller S., Croning M. D. R., Apweiler R. 2001. Evaluation of methods for the prediction of membrane spanning regions. Bioinformatics 17:646–653 [DOI] [PubMed] [Google Scholar]
- 36. Myers C. R., Myers J. M. 1997. Replication of plasmids with the p15A origin in Shewanella putrefaciens MR-1. Lett. Appl. Microbiol. 24:221–225 [DOI] [PubMed] [Google Scholar]
- 37. Nielsen M., Lundegaard C., Lund O., Petersen T. N. 2010. CPHmodels-3.0 remote homology modeling using structure guided sequence profiles. Nucleic Acids Res. 38:W576–W581 [DOI] [PMC free article] [PubMed] [Google Scholar]
- 38. Paul R., et al. 2004. Cell cycle-dependent dynamic localization of a bacterial response regulator with a novel di-guanylate cyclase output domain. Genes Dev. 18:715–727 [DOI] [PMC free article] [PubMed] [Google Scholar]
- 39. Pealing S. L., et al. 1992. Sequence of the gene encoding flavocytochrome c from Shewanella putrefaciens: a tetraheme flavoenzyme that is a soluble fumarate reductase related to the membrane-bound enzymes from other bacteria. Biochemistry 31:12132–12140 [DOI] [PubMed] [Google Scholar]
- 40. Pinchuk G. E., et al. 2009. Genomic reconstruction of Shewanella oneidensis MR-1 reveals a previously uncharacterized machinery for lactate utilization. Proc. Natl. Acad. Sci. U. S. A. 106:2874–2879 [DOI] [PMC free article] [PubMed] [Google Scholar]
- 41. Ponting C. P., Aravind L. 1997. PAS: a multifunctional domain family comes to light. Curr. Biol. 7:R674–R677 [DOI] [PubMed] [Google Scholar]
- 42. Reyes-Ramirez F., Dobbin P., Sawers G., Richardson D. J. 2003. Characterization of transcriptional regulation of Shewanella frigidimarina Fe(III)-induced flavocytochrome c reveals a novel iron-responsive gene regulation system. J. Bacteriol. 185:4564–4571 [DOI] [PMC free article] [PubMed] [Google Scholar]
- 43. Roy A., Kucukural A., Zhang Y. 2010. I-TASSER: a unified platform for automated protein structure and function prediction. Nat. Protoc. 5:725–738 [DOI] [PMC free article] [PubMed] [Google Scholar]
- 44. Saffarini D. A., Schultz R., Beliaev A. S. 2003. Involvement of cyclic AMP (cAMP) and cAMP receptor protein in anaerobic respiration of Shewanella oneidensis. J. Bacteriol. 185:3668–3671 [DOI] [PMC free article] [PubMed] [Google Scholar]
- 45. Saltikov C. W., Newman D. K. 2003. Genetic identification of a respiratory arsenate reductase. Proc. Natl. Acad. Sci. U. S. A. 100:10983–10988 [DOI] [PMC free article] [PubMed] [Google Scholar]
- 46. Scheuermann T. H., Yang J. S., Zhan L., Gardner K. H., Bruick R. K. 2007. Hypoxia-inducible factors P-ER/ARNT/S-IM domains: structure and function. Methods Enzymol. 435:3. [DOI] [PubMed] [Google Scholar]
- 47. Schmidt A. J., Ryjenkov D. A., Gomelsky M. 2005. The ubiquitous protein domain EAL is a cyclic diguanylate-specific phospodiesterase: enzymatically active and inactive EAL domains. J. Bacteriol. 187:4774–4781 [DOI] [PMC free article] [PubMed] [Google Scholar]
- 48. Schuetz B., Schicklberger M., Kuermann J., Spormann A. M., Gescher J. 2009. Periplasmic electron transfer via the c-type cytochromes MtrA and FccA of Shewanella oneidensis MR-1. Appl. Environ. Microbiol. 75:7789–7796 [DOI] [PMC free article] [PubMed] [Google Scholar]
- 49. Sellars M. J., Hall S. J., Kelly D. J. 2002. Growth of Campylobacter jejuni supported by respiration of fumarate, nitrate, nitrite, trimethylamine-N-oxide, or dimethyl sulfoxide requires oxygen. J. Bacteriol. 184:4187–4196 [DOI] [PMC free article] [PubMed] [Google Scholar]
- 50. Shi L., Lin J. T., Markillie L. M., Squier T. C., Hooker B. S. 2005. Overexpression of multi-heme c-type cytochromes. Biotechniques 38:297–299 [DOI] [PubMed] [Google Scholar]
- 51. Slavny P., Richard L., Salinas P., Clarke T. A., Dixon R. 2010. Quaternary structure changes in a second Per-Arnt-Sim domain mediate intramolecular redox signal relay in the NifL regulatory protein. Mol. Microbiol. 75:61–75 [DOI] [PubMed] [Google Scholar]
- 52. Sukchawalit R., Vattanaviboon P., Sallabhan R., Mongkolsuk S. 1999. Construction and characterization of regulated l-arabinose-inducible broad host range expression vectors in Xanthomonas. FEMS Microbiol. Lett. 181:217–223 [DOI] [PubMed] [Google Scholar]
- 53. Taylor B. L., Zhulin I. B. 1999. PAS domains: internal sensors of oxygen, redox potential, and light. Microbiol. Mol. Biol. Rev. 63:479–506 [DOI] [PMC free article] [PubMed] [Google Scholar]
- 54. Thormann K. M., et al. 2006. Control of formation and cellular detachment from Shewanella oneidensis MR-1 biofilms by cyclic di-GMP. J. Bacteriol. 188:2681–2691 [DOI] [PMC free article] [PubMed] [Google Scholar]
- 55. Ukaegbu U. E., Rosenzweig A. C. 2009. Structure of the redox sensor domain of Methylococcus capsulatus (Bath) MmoS. Biochemistry 48:2207–2215 [DOI] [PMC free article] [PubMed] [Google Scholar]
- 56. Wan X. F., et al. 2004. Transcriptomic and proteomic characterization of the Fur modulon in the metal-reducing bacterium Shewanella oneidensis. J. Bacteriol. 186:8385–8400 [DOI] [PMC free article] [PubMed] [Google Scholar]
- 57. Weingarten R. A., Taveirne M. E., Olson J. W. 2009. The dual-functioning fumarate reductase is the sole succinate:quinine reductase in Campylobacter jejunis and is required for full host colonization. J. Bacteriol. 191:5293–5300 [DOI] [PMC free article] [PubMed] [Google Scholar]
- 58. Wiederstein M., Sippl M. J. 2007. ProSA-Web: interactive Web service for the recognition of errors in three-dimensional structures of proteins. Nucleic Acids Res. 35:W407–W410 [DOI] [PMC free article] [PubMed] [Google Scholar]
- 59. Zhulin I. B., Taylor B. L. 1999. 1998. Correlation of PAS domains with electron transport-associated proteins in completely sequenced microbial genomes. Mol. Microbiol. 29:1522–1523 [PubMed] [Google Scholar]


