

Abstract
From group hunting to global warming, how to deal with collective action may be formulated in terms of a public goods game of cooperation. In most cases, contributions depend on the risk of future losses. Here, we introduce an evolutionary dynamics approach to a broad class of cooperation problems in which attempting to minimize future losses turns the risk of failure into a central issue in individual decisions. We find that decisions within small groups under high risk and stringent requirements to success significantly raise the chances of coordinating actions and escaping the tragedy of the commons. We also offer insights on the scale at which public goods problems of cooperation are best solved. Instead of large-scale endeavors involving most of the population, which as we argue, may be counterproductive to achieve cooperation, the joint combination of local agreements within groups that are small compared with the population at risk is prone to significantly raise the probability of success. In addition, our model predicts that, if one takes into consideration that groups of different sizes are interwoven in complex networks of contacts, the chances for global coordination in an overall cooperating state are further enhanced.
Keywords: climate change, collective risk, game theory
Human cooperation in public goods problems is often threatened by the immediate advantage of free riding, which can drive the population into the tragedy of the commons (1). An excellent example of such a class of problems concerns the mitigation of the effects of global warming, which has been described as one of the greatest public goods dilemmas that humans face and the one that we cannot afford to lose (2–6). Indeed, given that the welfare of our planet is an indivisible good accessible by all, individuals, regions, or nations may opt to be free riders, hoping to benefit from the efforts of others while choosing not to make any effort themselves (1–12). Moreover, nations and their leaders seek a collective goal that is shadowed by the uncertainty of its achievement (13). Such types of uncertainties have repeatedly happened throughout human history (14, 15) from group hunting (16, 17) to voluntary adoption of public health measures (18) and prospective choices (19, 20). Hence, in general, investments or efforts targeting the mitigation of future losses will depend on how likely such losses seem to be, which is beautifully illustrated in actual experiments making use of a repeated game (3) in which the perception of risk was shown to constitute an inescapable issue in dealing, in that case, with the problem of climate change. In the following work, we shall propose an evolutionary approach to such broad classes of collective action problems in which the risk of group failure plays a central role in individual decisions.
Let us consider a population of size Z in which individuals engage in an N person dilemma characterized by a limited set of behaviors: to cooperate or to defect. Game participants each have an initial endowment b. Cooperators (Cs) contribute a fraction c of their endowment, whereas defectors (Ds) do not contribute. Furthermore, we require a minimum collective investment to ensure any benefit. If a group of size N does not contain at least M Cs (or equivalently, a collective effort of Mcb), all members will lose their remaining endowments with a probability r (the risk); otherwise, everyone will keep whatever they have. Imposing such a threshold mimics situations common to most of the public endeavors described above, and it also extends to nonhuman dilemmas (21–23), where a minimum combined effort is needed to achieve a collective goal. This is also the case in international environmental agreements (extensive reviews in refs. 5, 6, 11, and 12), which demand a minimum number of ratifications to come into practice (3, 24, 25).
Rational players facing this one-shot dilemma will opt for defection, because Ds always get a higher payoff in mixed groups. However, this reasoning ignores the collective (population-wide) dynamics, where a continuous (and eventually, long-term) process of behavioral revision (9, 26) takes place. One can model this process in terms of a repeated game, or one can also use a simpler evolutionary game theoretical formulation (9, 27–29), where individuals tend to copy others whenever these seem to be more successful. In the first case, strategies may be defined by a contingency plan, which, as argued before (26), is unlikely to be maintained on a long time scale. Differently, the evolutionary approach allows policies to change as time goes by, and likely, these policies will be influenced by the behavior (and achievements) of others, which was previously shown in the context of donations to public goods (30–32). For instance, international environmental agreements may be vulnerable to renegotiation, because individuals may agree on intermediate goals or assess actual and future consequences of their choices to revise their position (5, 6, 9, 11–13).
In the framework of evolutionary game theory, the evolution of the fraction x of Cs (and 1 − x of Ds) in a large population is governed by the gradient of selection associated with the replicator dynamics equation (33–35)  , which characterizes the behavioral dynamics of the population, where fC (fD) is the fitness of Cs (Ds), here associated with the game payoffs. According to the replicator equation, Cs (Ds) will increase in the population whenever
  . Fig. 1A shows that, in the absence of risk,
  is always negative, leading to the extinction of Cs (x = 0) regardless of the initial fraction of cooperators. The presence of risk, in turn, leads to the emergence of two mixed internal equilibria, rendering cooperation viable. For finite risk r, both Cs (below xL) and Ds (above xR) become disadvantageous when rare. Coexistence between Cs and Ds becomes stable at a fraction xR, which increases with r. Hence, collective coordination becomes easier to achieve under high risk, and after the coordination barrier is overcome (xL), high levels of cooperation will be reached.
Fig. 1.

Evolutionary dynamics of cooperation under the collective risk dilemma. (A) For each fraction x of Cs, if the gradient of selection  is positive (negative), the fraction of Cs will increase (decrease). Increasing risk (r) modifies the population dynamics, rendering cooperation viable depending on the initial fraction of Cs (N = 6, M = 3, and c = 0.1). (B) Internal roots x* of
  for different values of the cost to risk ratio γ = c/r at fixed group size (N = 6) and different coordination thresholds (M). For each value of γ, one draws a horizontal line; the intersection of this line with each curve gives the value(s) of x*, defining the internal equilibria of the replicator dynamics (M = 4 and γ = 0.15 in the example). Empty circles represent unstable fixed points (xL), and full circles represent stable fixed points (xR). Whenever
  (which also depends on M), there will be only one internal equilibrium at
  (Methods), whereas for
  , no internal equilibrium will occur. (C) Stationary distribution describing the prevalence of each fraction (k/Z) of cooperators in finite populations (Z = 50 in the presence of mutations and imitation errors). Whenever risk is high, stochastic effects (i) turn collective cooperation into a pervasive behavior and (ii) favor the overcome of coordination barriers, rendering cooperation viable regardless of the initial configuration (N = 6, M = 3, and c = 0.1).
The appearance of two internal equilibria under risk can be studied analytically, which we do in Methods. In Fig. 1B, we show the location of these equilibria as a function of the cost to risk ratio γ, defined as γ = c/r, and coordination threshold M. Scenarios with zero, one, and two interior fixed points are possible depending on γ, whether it is smaller than, larger than, or equal to, respectively, a critical value  (defined in Methods by an implicit equation). Hence, the cost to risk ratio γ plays a central role in dictating the viability of an overall cooperative state. Intuitively, the smaller the contribution required, the easier it will be to reach such a globally cooperative state. Moreover, the higher the perception of the risk at stake, the more likely that individuals will react to overcome such a cooperation dilemma. Fig. 1B also shows the role played by the threshold M: for fixed (and low) γ, increasing M will maximize cooperation (increase of xR) at the expense of making it more difficult to emerge (increase of xL).
In reality, however, populations are finite and in some cases, may be small, because in many collective endeavors, from animal group hunting and warfare to numerous human affairs such as small community collective projects, macroeconomic relations, and famous world summits on climate change, group and population sizes are of comparable size and of the order of the hundreds (5, 6, 14–17, 21, 22, 36). For such population sizes, stochastic effects play an important role, and the behavioral dynamics are best described by a finite population gradient of selection G(k/Z) (35, 37) (defined in Methods as the difference between the probabilities of increasing and decreasing the number of Cs by one) and the stationary distribution (38) of the population, which characterizes the pervasiveness in time of a given composition of the population. Stochastic effects are amplified in the presence of errors of different sorts (inducing behavioral mutations) (39), including errors of imitation (37, 40). Consequently, they may play an important role in the collective behavior at a population level.
In Fig. 1C, we show the stationary distributions for different values of risk for a population of size Z = 50 where n = 2M = 6. Although the finite population gradient of selection G(k/Z) exhibits a behavior qualitatively similar to  in Fig. 1A, Fig. 1C shows that the population spends most of the time in configurations where Cs prevail, regardless of the initial condition. This is a direct consequence of stochastic effects, which allow for tunneling through the coordination barrier associated with xL, rendering such coordination barrier (xL) irrelevant and turning cooperation into the prevalent strategy.
Besides perception of risk, group size must also be considered, because it defines the scale at which reaching an overall cooperative state may be optimized. In particular, cooperation for climate control can be pursued at different scales from regional to global agreements. Hence, even if the problem is certainly global, its solution may be attempted through the combination of several local agreements. So far, attempts have been concentrated in a single global group (12, 41). As shown by the stationary distributions of Fig. 2, cooperation is better dealt with within small groups, even if, for higher M/N values, coordination is harder to attain (Figs. 1B and 2C). Moreover, in some types of cooperation problems, such as CO2 emissions, larger groups may require a larger number of cooperative parties to ensure the same population-wide reduction level of emissions. In such cases, it is likely that M is no longer fixed but an increasing function of the group size N. In practice, we expect real problems to fall somewhere between the limits of constant and variable M, given the plethora of possibilities underlying both the definition of the dilemma and the setup of a particular group. Here, we explore the simplest choice for variable M assuming that it increases linearly with N (M/N = a with a being a fixed positive constant). The dynamical outcome from this limit is pictured in Fig. 2 B and D (a = 1/2). As before, cooperation prevails mostly when groups are small. Moreover, the minimum coordination (xL) needed to reach the cooperative basin of attraction is reduced for smaller groups, contrary to the scenario of constant M. However, as shown in Fig. 2D, this scenario shows the central importance of risk, because the decrease of cooperation occurs faster for high values of the cost to risk ratio.
Fig. 2.

Evolutionary dynamics of cooperation for different group sizes. (A) Stationary distributions for different group sizes and constant threshold M = 2. Cooperation will be maximized when risk is high and groups are small (small N), because goal achievement involves stringent requirements. (B) The same trend remains valid (to a lesser extent) whenever the threshold M increases linearly with the group size [here chosen as M = N/2 (c/r = 0.1 in both A and B)]. In C and D, we picture the internal roots of G(k) ≡ T+(k) − T−(k) for different values of the cost to risk ratio γ = c/r for (C) M = 2 and (D) N/M = 2. Regardless of the scenario, coexistence occurs for a higher fraction of cooperators whenever groups are smaller. However, whenever the threshold increases with the group size (D), cooperation becomes increasingly more sensitive to the group size and the level of risk. In A–D, the population size is Z = 50.
Taken as a whole, Fig. 2 confirms that, with increasing group size, cooperation is inhibited in both scenarios. When applied to the problem of climate control, the present results suggest that decentralized agreements between smaller groups (small N), possibly focused on region-specific issues where risk is high and goal achievement involves tough requirements (large relative M), may be preferable to world summits, because they effectively raise the probability of reaching an overall cooperative state. This is particularly relevant, because in this case, collective perception of risk is not necessarily high, whereas social, economic, and technologic constraints still require sizeable costs from the parties involved (6).
The success in self-organizing cooperative behavior within small groups compared with global dilemmas naturally begs the question of how these groups should be organized to maximize the chances of cooperation. So far, all groups and individuals have been assumed as identical. However, sociopolitical dynamics are often grounded on a strong diversity in roles and positions (10). As previously discussed in the context of international summits (5), countries or regions are part of intricate networks of overlapping and interrelated alliances or agreements that also involve geographical neighbors and others with a global character that transcends geography. Similarly, diversity in geographical positions or social or political configurations means that some players may play a pivotal role in a global outcome, because they may participate in a larger number of collective dilemmas than others. The overall number and size of the dilemmas faced by each individual may be seen as a result of a complex interaction network, where nodes represent individuals and links represent exchanges, collective investments, or shared interests (28, 30, 42–49). As exemplified in Fig. 3A, each neighborhood of such structure may represent a group with a size given (e.g., by the connectivity of the focal individual). In Fig. 3B, we show the effect of such heterogeneity or diversity of group sizes in the problem at stake, comparing the finite gradients of selection in a homogeneous setting—taking the well-mixed population as reference*—with a heterogeneous case. For the latter, we adopt the ubiquitous power law distribution of connectivities resulting from a scale-free interaction network (51) (Methods) and a constant M. This leads to distributions of group sizes and numbers of games played by each player, which also follow a power law. As shown in Fig. 3B, a heterogeneous contact network changes the location of the internal equilibria without changing either the nature of the effective game or the nature of the internal equilibria. However, the impact of such a diversity on the type of game played in each local group is sizeable. In large groups, coordination is easier to achieve (M/N is small), but coexistence occurs for a lower fraction of cooperators; in small groups, coordination faces stern requirements (M/N increases), but after these requirements are met, most group members will actually cooperate. Hence, in heterogeneous environments, one obtains, in a single population, a combination of the different scenarios pictured in Figs. 1B and 2C. Fig. 3B indicates that, whenever the risk of failure is high, introducing group diversity primarily enlarges the stable fraction xR at equilibrium, also determining a slight increase of the size of the cooperative basin of attraction. Because coordination is easily achieved in large groups, highly connected players at the group centers will acquire a larger fitness. Whenever such hubs happen to be occupied by cooperators (shown in ref. 46), they will influence the participants of small groups (the majority) to cooperate, hence enabling small groups to overcome their stringent coordination requirements. Overall, this will act to reduce the average xL of the population. After this coordination barrier is surpassed, coexistence will be determined by the small size of the majority of the groups, leading to the dominance of cooperators at xR. The same trend remains valid, to a lesser extent, whenever we assume that, instead of a fixed M, we fix the ratio M/N for all groups, as shown in Fig. 3C. In this case, the positive effect resulting from having most (small) groups turning to cooperation is hampered by the fact that now it is more difficult for large groups to foster any cooperation in the rest of the population, which was previously shown in Fig. 2D. Nonetheless, regardless of the limit chosen, the equilibrium fraction of cooperators is clearly enhanced in heterogeneous environments.
Fig. 3.

Evolutionary dynamics in heterogeneous populations. (A) Given an interaction network of size Z and average degree <ζ>, where nodes represent individuals and links represent exchanges or shared goals, collective risk dilemmas may be associated with neighborhoods in this network. As an example, the central individual (blue) participates in six groups, hence participating in six public goods games, each with a given group size. The individual fitness derives from the payoff accumulated from all games in which the individual participates. (B and C) Gradients of selection (Gs) for a homogeneous (well-mixed) population (dashed lines) and heterogeneous (scale-free) networks (solid lines) for different values of risk, a population size of Z = 500, and an average group size of <N> = 7 = <ζ> + 1 (Methods). In B, coordination requirements are kept constant at M = 3, whereas in C, M increases linearly with the group size; our choice of M = 3N/7 in C ensures that the average value of M is the same in both B and C. In the heterogeneous cases, both size and number of the N person games in which each individual participates follow a power law distribution.
Overall, the increase in risk transforms a dilemma in which contributors are always disadvantageous into one in which they may prevail. The impact of risk is enhanced in the presence of small behavioral mutations and errors and when global coordination is attempted in a majority of small groups under stringent requirements to meet goals. The combination of a small average group size and the inherent diversity of modern interaction networks also improves the chances of cooperation. Additionally, we would like to emphasize that, although our model may be simple enough to be applicable as a bare metaphor for a large plethora of collective dilemmas in which risk management plays an important role, it is inevitably stripped of many of the complexities present in modern human decisions. In dealing with climate change—an example of the class of problems to which this formulation may apply—countries (or regions or whatever unit of negotiation is best found) in general will be better informed, and this will condition decisions contingent on presently available information. Also, we have opted to limit individuals’ behavior to binary choices, where in fact, there are several issues related to the amount each participant might decide to contribute and the ensuing returns attained. Needless to say, other mechanisms (10, 29, 52–58), from kinship-based relations to reciprocity (direct and indirect), punishment, or multilevel selection as well as exogenous measures of community enforcement (known to encourage collective action) may also enlarge the window of opportunity for cooperation to thrive in the presence of risk.
Methods
Internal Roots of the Replicator Equation in Infinite Well-Mixed Populations.
Let us use an infinite well-mixed population with a fraction x of Cs and the remaining fraction (1 − x) of Ds. Random sampling leads to groups with compositions that follow a binomial distribution. Hence, we may write the average fitness of Cs (fc) and Ds (fD) as (35, 59, 60)  and
and  , where ΠD(k) (ΠC(k)) stands for the payoff of a D (C) in a group of size N and k Cs. The payoff of a D can be written as ΠD(k) = b{θ(k − M) + (1 − r)[1 − θ(k − M)]}, where θ(x) = 0 if x < 0 and θ(x) = 1 otherwise, whereas the payoff of a C is given by ΠC(k) = ΠD(k) − cb (0 ≤ c ≤ 1). M < N stands for the coordination threshold (3, 35) necessary to achieve a collective benefit. For sufficiently high risk, new internal roots appear in the replicator equation
  (34) that are associated with the roots of fC − fD in the open interval (0, 1). From the equations above, we may write, after some algebra, that fC − fD = b(Γ(x)r − c), where
  . Defining the cost to risk ratio as γ = c/r (i.e., the ratio between the fraction of the initial budget invested by every C and the risk of losing it), the sign of fC(x) − fD(x) is conveniently analyzed by using the polynomial p(x,γ) = Γ(x) − γ, which in turn, can be used to determine the critical value
  below which an interior fixed point x* ∈ (0, 1) emerges (Fig. 1B) (obtained by finding the roots of
  numerically).
Given that  , where s(x) = 1 + (N − 1)x − M, and because N > 2 and 1 < M < N, then
  has a single internal root for
  . In addition, s(x) is positive (negative) for
  , which means that Γ has a global maximum for
  .
.
Let  , where
  is defined as above (see also Fig. 1B). Then, it can be shown that (i) whenever
  , the evolutionary dynamics does not exhibit interior fixed points, (ii) whenever
  , there is one single interior fixed point, which is unstable, and finally, (iii) whenever
  , there are two interior fixed points
  , such that xR is stable and xL is unstable. Let us first prove i and ii. Because Γ has a maximum at
  , it follows that Γ(x) = 0 has no solutions for
  and a single solution, at
  , for
, for  . Moreover, both when x → 0 and x → 1, p(x,γ) < 0, making x = 0 a stable fixed point and x = 1 an unstable fixed point. Therefore, if
  is a root, it must be unstable. To prove iii, we start by noticing that Γ(0) = Γ(1) = 0. From the sign of s(x) (above), Γ(x) is clearly monotonic increasing (decreasing) to the left (right) of
  . Hence, there is a single root xL (xR) in the interval
  . Because x = 0 is stable and x = 1 is unstable, xR must be stable, and xL must be unstable.
Evolutionary Dynamics in Finite Well-Mixed Populations.
For finite well-mixed populations of size Z, the binomial sampling is replaced by a hypergeometric sampling (sampling without replacement). As a result, the average fitness of Ds and Cs in a population with k Cs is now written as (35, 60, 61) 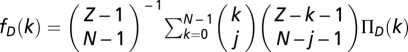 and
and 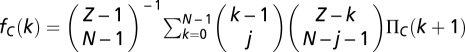 , respectively. We adopt a stochastic birth–death process (38) combined with the pair-wise comparison rule to describe the social dynamics of Cs (and Ds) in a finite population. Under pair-wise comparison (37, 62), each individual i adopts the strategy of a randomly selected member of the population j, with probability given by the Fermi function (from statistical physics) p ≡ [1 + e−β(fj − fi)]−1. Here, β (an inverse temperature in physics and equal to 5.0 in Figs. 1–3) controls the intensity of selection. For β << 1, selection is weak, and individual fitness is but a small perturbation to random drift in behavioral space. Under this regimen, one recovers the replicator equation in the limit Z → ∞ (37). For arbitrary β, the quantity
  specifying the gradient of selection is replaced in finite populations by
 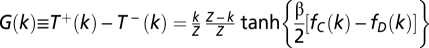 , where k stands for the total number of Cs in the population and
  stands for the probabilities to increase and decrease the number of Cs in the population by one individual (37).
In the presence of behavioral mutations, the population will never fixate in any of the two possible monomorphic states (63). This fact, together with the stochastic nature of the dynamics in finite populations, renders the stationary distribution an important tool to analyze the behavior of the population.† Consequently, we compute the stationary distribution P(k/Z) of the complete Markov chain with Z + 1 states shown in Figs. 1C and 2 A and B. The probabilities entering the tridiagonal transition matrix S = [pij]T are defined as  and pk,k = 1 − pk,k − 1 − pk,k + 1, where
  stands for the transition probabilities for an arbitrary mutation rate μ, which are given by
  for the probability to increase from k to k + 1 Cs and
  for the probability to decrease to k − 1 (39). Figs. 1C and 2 A and B were obtained for μ = 0.01. The stationary distribution is then obtained from the eigenvector corresponding to the eigenvalue 1 of S (38).
Evolutionary Dynamics in Structured Populations.
The finite gradients of selection G(k) = T+(k) − T−(k) for structured populations (Fig. 3 B and C) were computed numerically by adopting the same stochastic update rule defined above (37). For each random distribution k/Z of Cs, we compute numerically the average probability that each C (D) imitates a D (C) randomly chosen from the population. Scale-free networks of average degree <ζ> were constructed according to the Barabási–Albert model of growth and preferential attachment. Starting from a small number of nodes m0, at each time step, we add a new node with degree m = <ζ>/2 = m0. Assuming a probability  that the new node will be connected to an existing node i of degree ζi, we get a power-law distribution d(ζ) ∝ ζ−3 (47, 51) of degree and consequently, of group sizes and collective endeavors that each individual that participates. G(k) is obtained from the computation of all possible transitions, averaging over 2 × 10⁴ different distributions and 10 different scale-free interaction structures of size Z = 500 and average degree <ζ> = 6. Both homogeneous and heterogeneous interaction schemes represent populations experiencing games with the same average group size (<ζ> + 1 = <N> = 7). By construction, the Barabási–Albert model imposes a minimum group size of <ζ>/2 + 1 = 4 (47, 51) in all scale-free networks. This means that, in the limit of a constant threshold, collective coordination may be achieved in all groups for M = 3.
Footnotes
The authors declare no conflict of interest.
This article is a PNAS Direct Submission.
*The gradients of selection in well-mixed populations can be shown to be equivalent to those associated with a population structured as a lattice or homogeneous random network (50) for the studied dilemma, because all groups share the same size and all players participate in the same number of games.
†In the absence of mutations, evolution will only stop whenever the population reaches a monomorphic state (63). In this case, the time required for the population to reach any of the two absorbing states may be, however, arbitrarily long (64). This will happen whenever G(k) exhibits basins of attraction to stable polymorphic configurations.
References
- 1.Hardin G. The tragedy of the commons. Science. 1968;162:1243–1248. [PubMed] [Google Scholar]
- 2.Dreber A, Nowak MA. Gambling for global goods. Proc Natl Acad Sci USA. 2008;105:2261–2262. doi: 10.1073/pnas.0800033105. [DOI] [PMC free article] [PubMed] [Google Scholar]
- 3.Milinski M, Sommerfeld RD, Krambeck HJ, Reed FA, Marotzke J. The collective-risk social dilemma and the prevention of simulated dangerous climate change. Proc Natl Acad Sci USA. 2008;105:2291–2294. doi: 10.1073/pnas.0709546105. [DOI] [PMC free article] [PubMed] [Google Scholar]
- 4.Milinski M, Semmann D, Krambeck HJ, Marotzke J. Stabilizing the earth's climate is not a losing game: Supporting evidence from public goods experiments. Proc Natl Acad Sci USA. 2006;103:3994–3998. doi: 10.1073/pnas.0504902103. [DOI] [PMC free article] [PubMed] [Google Scholar]
- 5.Barrett S. Environment and Statecraft: The Strategy of Environmental Treaty-Making. New York: Oxford University Press; 2005. [Google Scholar]
- 6.Barrett S. Why Cooperate? The Incentive to Supply Global Public Goods. New York: Oxford University Press; 2007. [Google Scholar]
- 7.Olson M. The Logic of Collective Action: Public Goods and the Theory of Groups. Cambridge, MA: Harvard University Press; 1971. Revised Version Ed. [Google Scholar]
- 8.Kollock P. Social dilemmas: The anatomy of cooperation. Annu Rev Sociol. 1998;24:183–214. [Google Scholar]
- 9.Bowles S. Microeconomics: Behavior, Institutions, and Evolution. Princeton: Princeton University Press; 2006. [Google Scholar]
- 10.Skyrms B. The Stag Hunt and the Evolution of Social Structure. Cambridge, UK: Cambridge University Press; 2004. [Google Scholar]
- 11.Barrett S. Self-enforcing international environmental agreements. Oxf Econ Pap. 1994;46:878–894. [Google Scholar]
- 12.Barrett S. Towards a theory of international environmental cooperation. In: Carraro C, Siniscalco D, editors. New Directions in the Economic Theory of the Environment. Cembridge, UK: Cambridge University Press; 1998. [Google Scholar]
- 13.Heal G, Kristrom B. Uncertainty and climate change. Environ Resour Econ. 2002;22:3–39. doi:10.1023/A:1015556632097. [Google Scholar]
- 14.Boehm C. Hierarchy in the Forest: The Evolution of Egalitarian Behavior. Cambridge, MA: Harvard University Press; 1999. [Google Scholar]
- 15.Wrangham R, Peterson D. Demonic Males: Apes and the Origins of Human Violence. New York: Mariner Books; 1996. [Google Scholar]
- 16.Alvard MS, Nolin DA. Rousseau's whale hunt? Coordination among big-game hunters. Curr Anthropol. 2002;43:533–559. doi:10.1086/341653. [Google Scholar]
- 17.Bryant J. Coordination theory, the stag hunt and macroeconomics. In: Friedman JW, editor. Problems of Coordination in Economic Activity. Dordrecht, the Netherlands: Kluwer; 1994. [Google Scholar]
- 18.Brewer NT, et al. Meta-analysis of the relationship between risk perception and health behavior: The example of vaccination. Health Psychol. 2007;26:136–145. doi: 10.1037/0278-6133.26.2.136. doi:10.1037/0278-6133.26.2.136. [DOI] [PubMed] [Google Scholar]
- 19.Ferguson N. Capturing human behaviour. Nature. 2007;446:733. doi: 10.1038/446733a. [DOI] [PubMed] [Google Scholar]
- 20.Van Segbroeck S, Santos FC, Pacheco JM. Adaptive contact networks change effective disease infectiousness and dynamics. PLoS Comput Bio. 2010;6:e1000895. doi: 10.1371/journal.pcbi.1000895. doi:10.1371/journal.pcbi.1000895. [DOI] [PMC free article] [PubMed] [Google Scholar]
- 21.Boesch C. Cooperative hunting roles among Tai chimpanzees. Hum Nature Int Bios. 2002;13:27–46. doi: 10.1007/s12110-002-1013-6. [DOI] [PubMed] [Google Scholar]
- 22.Creel S, Creel NM. Communal hunting and pack size in African wild dogs, Lycaon-Pictus. Anim Behav. 1995;50:1325–1339. doi:10.1016/0003-3472(95)80048-4. [Google Scholar]
- 23.Stander PE. Cooperative hunting in lions—the role of the individual. Behav Ecol Sociobiol. 1992;29:445–454. doi:10.1007/BF00170175. [Google Scholar]
- 24.Heal G. Formation in international environmental agreements. In: Carraro C, editor. Trade, Innovation, Environment. Dordrecht, the Netherlands: Kluwer; 1993. [Google Scholar]
- 25.Black J, Levi M, De Meza D. Creating a good atmosphere: Minimum participation for tackling the 'greenhouse effect.'. Economica. 1993;60:281–293. doi:10.2307/2554852. [Google Scholar]
- 26.McGinty M. International environmental agreements as evolutionary games. Environ Resour Econ. 2009;45:251–269. doi:10.1007/s10640-009-9314-4. [Google Scholar]
- 27.Rendell L, et al. Why copy others? Insights from the social learning strategies tournament. Science. 2010;328:208–213. doi: 10.1126/science.1184719. doi:10.1126/science.1184719. [DOI] [PMC free article] [PubMed] [Google Scholar]
- 28.Tomasello M, Call J. Primate Cognition. London: Oxford University Press; 1997. [Google Scholar]
- 29.Sigmund K, De Silva H, Traulsen A, Hauert C. Social learning promotes institutions for governing the commons. Nature. 2010;466:861–863. doi: 10.1038/nature09203. doi:10.1038/nature09203. [DOI] [PubMed] [Google Scholar]
- 30.Fowler JH, Christakis NA. Cooperative behavior cascades in human social networks. Proc Natl Acad Sci USA. 2010;107:5334–5338. doi: 10.1073/pnas.0913149107. doi:10.1073/pnas.0913149107. [DOI] [PMC free article] [PubMed] [Google Scholar]
- 31.Rees MA, et al. A nonsimultaneous, extended, altruistic-donor chain. N Engl J Med. 2009;360:1096–1101. doi: 10.1056/NEJMoa0803645. doi:10.1056/NEJMoa0803645. [DOI] [PubMed] [Google Scholar]
- 32.Carman KG. Social Influences and the Private Provision of Public Goods: Evidence from Charitable Contributions in the Workplace. Stanford, CA: Stanford Institute for Economic Policy Research; 2003. Discussion Paper 02–13. [Google Scholar]
- 33.Hofbauer J, Sigmund K. Evolutionary Games and Population Dynamics. Cambridge, UK: Cambridge University Press; 1998. [Google Scholar]
- 34.Sigmund K. The Calculus of Selfishness. Princeton: Princeton University Press; 2010. [Google Scholar]
- 35.Pacheco JM, Santos FC, Souza MO, Skyrms B. Evolutionary dynamics of collective action in N-person stag hunt dilemmas. Proc Biol Sci. 2009;276:315–321. doi: 10.1098/rspb.2008.1126. doi:10.1098/rspb.2008.1126. [DOI] [PMC free article] [PubMed] [Google Scholar]
- 36.Jervis R. Cooperation under the security dilemma. World Polit. 1978;30:167–214. doi:10.2307/2009958. [Google Scholar]
- 37.Traulsen A, Nowak MA, Pacheco JM. Stochastic dynamics of invasion and fixation. Phys Rev E Stat Nonlin Soft Matter Phys. 2006;74:011909. doi: 10.1103/PhysRevE.74.011909. doi:10.1103/PhysRevE.74.011909. [DOI] [PMC free article] [PubMed] [Google Scholar]
- 38.Karlin S, Taylor HMA. A First Course in Stochastic Processes. 2nd Ed. London: Academic; 1975. [Google Scholar]
- 39.Traulsen A, Hauert C, De Silva H, Nowak MA, Sigmund K. Exploration dynamics in evolutionary games. Proc Natl Acad Sci USA. 2009;106:709–712. doi: 10.1073/pnas.0808450106. doi:10.1073/pnas.0808450106. [DOI] [PMC free article] [PubMed] [Google Scholar]
- 40.Traulsen A, Pacheco JM, Nowak MA. Pairwise comparison and selection temperature in evolutionary game dynamics. J Theor Biol. 2007;246:522–529. doi: 10.1016/j.jtbi.2007.01.002. doi:10.1016/j.jtbi.2007.01.002. [DOI] [PMC free article] [PubMed] [Google Scholar]
- 41.Asheim G, Froyn C, Hovi J, Menz F. Regional versus global cooperation for climate control. J Environ Econ Manage. 2006;51:93–109. doi:10.1016/j.jeem.2005.04.004. [Google Scholar]
- 42.Lazer D, et al. Social science. Computational social science. Science. 2009;323:721–723. doi: 10.1126/science.1167742. doi:10.1126/science.1167742. [DOI] [PMC free article] [PubMed] [Google Scholar]
- 43.Amaral LA, Scala A, Barthelemy M, Stanley HE. Classes of small-world networks. Proc Natl Acad Sci USA. 2000;97:11149–11152. doi: 10.1073/pnas.200327197. doi:10.1073/pnas.200327197. [DOI] [PMC free article] [PubMed] [Google Scholar]
- 44.Buchanan M. Nexus: Small Worlds and the Groundbreaking Science of Networks. New York: WW Norton & Company; 2003. [Google Scholar]
- 45.Santos FC, Pacheco JM, Lenaerts T. Evolutionary dynamics of social dilemmas in structured heterogeneous populations. Proc Natl Acad Sci USA. 2006;103:3490–3494. doi: 10.1073/pnas.0508201103. doi:10.1073/pnas.0508201103. [DOI] [PMC free article] [PubMed] [Google Scholar]
- 46.Santos FC, Santos MD, Pacheco JM. Social diversity promotes the emergence of cooperation in public goods games. Nature. 2008;454:213–216. doi: 10.1038/nature06940. doi:10.1038/nature06940. [DOI] [PubMed] [Google Scholar]
- 47.Dorogovtsev SN. Lectures on Complex Networks. Oxford: Oxford University Press; 2010. [Google Scholar]
- 48.Barrat A, Barthelemy M, Vespignani A. Dynamical Processes in Complex Networks. Cambridge, UK: Cambridge University Press; 2008. [Google Scholar]
- 49.Szabó G, Fáth G. Evolutionary games on graphs. Phys Rep. 2007;446:97–216. doi:10.1016/j.physrep.2007.04.004. [Google Scholar]
- 50.Santos FC, Rodrigues JF, Pacheco JM. Epidemic spreading and cooperation dynamics on homogeneous small-world networks. Phys Rev E Stat Nonlin Soft Matter Phys. 2005;72:056128. doi: 10.1103/PhysRevE.72.056128. doi:10.1103/PhysRevE.72.056128. [DOI] [PubMed] [Google Scholar]
- 51.Barabási AL, Albert R. Emergence of scaling in random networks. Science. 1999;286:509–512. doi: 10.1126/science.286.5439.509. doi:10.1126/science.286.5439.509. [DOI] [PubMed] [Google Scholar]
- 52.Hamilton WD. The genetical evolution of social behaviour. I. J Theor Biol. 1964;7:1–16. doi: 10.1016/0022-5193(64)90038-4. doi:10.1016/0022-5193(64)90038-4. [DOI] [PubMed] [Google Scholar]
- 53.Wilson DS. A theory of group selection. Proc Natl Acad Sci USA. 1975;72:143–146. doi: 10.1073/pnas.72.1.143. doi:10.1073/pnas.72.1.143. [DOI] [PMC free article] [PubMed] [Google Scholar]
- 54.Ostrom E. Governing the Commons: The Evolution of Instituitions for Collective Action. Cambridge, UK: Cambridge University Press; 1990. [Google Scholar]
- 55.Fehr E, Gachter S. Cooperation and punishment in public good experiments. Am Econ Rev. 2000;90:980–994. doi:10.1257/aer.90.4.980. [Google Scholar]
- 56.Milinski M, Semmann D, Krambeck HJ. Reputation helps solve the ‘tragedy of the commons.’. Nature. 2002;415:424–426. doi: 10.1038/415424a. doi:10.1038/415424a. [DOI] [PubMed] [Google Scholar]
- 57.Nowak MA. Five rules for the evolution of cooperation. Science. 2006;314:1560–1563. doi: 10.1126/science.1133755. doi:10.1126/science.1133755. [DOI] [PMC free article] [PubMed] [Google Scholar]
- 58.West SA, Griffin AS, Gardner A. Evolutionary explanations for cooperation. Curr Biol. 2007;17:R661–R672. doi: 10.1016/j.cub.2007.06.004. doi:10.1016/j.cub.2007.06.004. [DOI] [PubMed] [Google Scholar]
- 59.Hauert C, Michor F, Nowak MA, Doebeli M. Synergy and discounting of cooperation in social dilemmas. J Theor Bio. 2006;239:195–202. doi: 10.1016/j.jtbi.2005.08.040. [DOI] [PMC free article] [PubMed] [Google Scholar]
- 60.Souza MO, Pacheco JM, Santos FC. Evolution of cooperation under N-person snowdrift games. J Theor Biol. 2009;260:581–588. doi: 10.1016/j.jtbi.2009.07.010. doi:10.1016/j.jtbi.2009.07.010. [DOI] [PubMed] [Google Scholar]
- 61.Hauert C, Traulsen A, Brandt H, Nowak MA, Sigmund K. Via freedom to coercion: The emergence of costly punishment. Science. 2007;316:1905–1907. doi: 10.1126/science.1141588. doi:10.1126/science.1141588. [DOI] [PMC free article] [PubMed] [Google Scholar]
- 62.Szabó G, Toke C. Evolutionary prisoner's dilemma game on a square lattice. Phys Rev E Stat Phys Plasmas Fluids Relat Interdiscip Topics. 1998;58:69–73. doi: 10.1103/physreve.62.1095. doi:10.1103/PhysRevE.58.69. [DOI] [PubMed] [Google Scholar]
- 63.Nowak MA, Sasaki A, Taylor C, Fudenberg D. Emergence of cooperation and evolutionary stability in finite populations. Nature. 2004;428:646–650. doi: 10.1038/nature02414. doi:10.1038/nature02414. [DOI] [PubMed] [Google Scholar]
- 64.Antal T, Scheuring I. Fixation of strategies for an evolutionary game in finite populations. Bull Math Biol. 2006;68:1923–1944. doi: 10.1007/s11538-006-9061-4. doi:10.1007/s11538-006-9061-4. [DOI] [PubMed] [Google Scholar]