

Abstract
Objective
Systemic lupus erythematosus (SLE) T cells display a hyperactive calcineurin-NFAT pathway. The aim of this study is to answer whether this pathway is responsible for the aberrant SLE T cell function and test the effectiveness of the recently recognized calcineurin inhibitor dipyridamole in limiting SLE related pathology.
Methods
T and mononuclear cells were isolated from the peripheral blood of patients with SLE and healthy individuals. Murine cells were isolated from the spleens and lymph nodes of lupus prone MRL/lpr mice and control MRL/MpJ mice. Cells were treated in vitro with tacrolimus, dipyridamole or control. MRL/lpr mice were injected intraperitoneally with dipyridamole 50 mg/kg three times a week for 3 weeks.
Results
MRL/lpr T cells, especially CD3+CD4-CD8- displayed a robust calcium influx upon activation and increased levels of NFATc1. MRL/lpr T cells (both CD4+ and CD3+CD4-CD8- cells) provided help to B cells to produce immunoglobulin in a calcineurin-dependent fashion. Dipyridamole treatment of SLE T cells inhibited significantly the expression of CD154, the production of IFN-γ, IL-17, IL-6, and the T cell dependent B cell immunoglobulin secretion. Treatment of MRL/lpr mice with dipyridamole alleviated lupus nephritis and prevented the appearance of skin ulcers.
Conclusion
NFAT activation is a key step in the activation of SLE T cells and the production of immunoglobulin. Dipyridamole inhibits SLE T cell function and improves disease pathology in lupus-prone mice. We propose that dipyridamole can be used in treatment regimens of SLE patients.
Introduction
Upon engagement of the T cell receptor (TCR), T cells from patients with systemic lupus erythematosus (SLE) show robust calcium response (1) and mobilize the transcription factor Nuclear Factor of Activated T cells (NFAT) c2 into the nucleus at higher rates than T cells from healthy volunteers (2, 3). Aggregation of lipid rafts (4), substitution of the CD3ζ chain-Zap70 signaling duet by FcRγ-Syk (5, 6), and mitochondrial hyperpolarization (7) have been claimed as causing the enhanced and accelerated early T cell response.
It is currently accepted that SLE T cells provide aberrant help to B cells to produce pathogenic autoantibodies through increased expression of co-stimulatory molecules such as the ligand for CD40, CD154 (8). At the same time, activated SLE T cells directly invade tissues such as the kidneys and the skin. These tissue infiltrating T cells can be either CD4+ or CD4-CD8- (double negative, DN T cells), and produce the pro-inflammatory cytokine IL-17 (9). DN T cells are expanded in SLE and the lupus-prone MRL/lpr mouse and appear to be of pathogenic importance.
The degree to which the enhanced early signaling events contribute to the observed SLE T cell helper and effector functions is unclear to date. In this communication we demonstrate that MRL/lpr T cells provide aberrant help to normal mouse B cells in a calcineurin-dependent manner, linking SLE T cell hyperactivity to T cell helper function. Moreover, we show that the enhanced calcium-calcineurin-NFAT pathway in human and murine SLE T cells can be suppressed in the presence of dipyridamole, a recently recognized specific inhibitor of calcineurin-NFAT interaction (10). Finally, administration of dipyridamole to MRL/lpr mice improved disease pathology.
Patients and Methods
Subjects
Patients (N=19) who fulfilled the American College of Rheumatology criteria for the diagnosis of SLE (11) were enrolled in the study by donating 50 mL of blood in heparin-lithium tubes. The patients were 95% female with a mean age of 36 (23-54) years old. 42% of SLE patients were white, 42% African American, and 11% Asian-American.
Disease activity was calculated using the SLE disease activity index (SLEDAI) (12). The mean SLEDAI score was 5.5, with 3 patients being quiescent (SLEDAI of 0) and 5 patients having high disease activity (SLEDAI>8). 60% of the patients were taking corticosteroids at a mean dose of 22 (5-60) mg per day. Other immunosuppressive medications the patients were on at the time of the study included: hydroxychloroquine (75%), azathioprine (20%), and mycophenolate mofetil (50%). Two patients were on intravenous monthly cyclophosphamide, one patient on cyclosporine and one patient on weekly methotrexate at the time of the study. Prednisone was held for at least 12 h prior to the blood draw. The institutional review board of Beth Israel Deaconess Medical Center approved the study protocol and informed consents were obtained from all the study subjects.
Animals
MRL/lpr/2J (MRL/lpr) and MRL/MpJ were purchased from the Jackson Laboratories (Bar Harbor, ME) and housed in the barrier animal facility of Beth Israel Deaconess Medical Center (BIDMC). Tartaric acid and dipyridamole were injected using 29G needles intraperitoneally under sterile conditions. The Institutional Animal Care and Use Committee (IACUC) at BIDMC approved all animal related procedures.
Urine analysis
The Urine that was collected from individual mice was analyzed for protein, blood and white cells using the Multistix 10 SG reagent strips and the Clinitek Status analyzer (Bayer Healthcare). All analyses were done using a semiquantitative method. For proteinuria, +:30 mg/dL, ++:100 mg/dL, +++: 1000 mg/dL, ++++:> 2000mg/dL.
Histology
Longitudinal sections of the skin were fixed in 4% buffered paraformaldehyde and then embedded in paraffin. The skin sections were subsequently cut at 3μm thickness. The sections were stained with hematoxylin and eosin (HE).
Cell isolation, culture, stimulation and proliferation assays
The blood was incubated for 30 minutes with an antibody mixture against CD14, CD16, CD19, CD56 and glyA that attaches non-T cells to erythrocytes. Ficoll containing Lymphoprep gradient (Nycomed, Oslo, Norway) was subsequently used to separate these complexes from T cells. Using flow-cytometry, we have established that the purified cells were >98% positive for CD3. The cells during culture were incubated in RPMI medium with 10% (vol/vol) fetal calf serum (heat inactivated FCS, Sigma Aldrich) supplemented L-glutamine, and 100 U penicillin and 100 μg streptomycin per ml at 37 °C, in a humidified atmosphere of 5% CO2 in culture incubator. Where mentioned T cells were stimulated plate bound anti-CD3 antibody (2 μg/ml) and anti-CD28 antibody (2 μg/ml). For the drug treatment experiments, purified T cells were incubated at 37 °C for half hour with the drug prior to stimulation. Peripheral blood mononuclear cells were isolated using the above protocol without the antibody mixture and were cultured for up to 13 days in RPMI medium as above.
Cells were extracted from murine spleens and lymph nodes by filtering the tissue through a 70 μM BD Falcon cell strainer. The extracts were centrifuged at 1200 rpm for 5 minutes. ACK lysing buffer (Quality Biological, MD) solution was added in the cell pellet in order to lyse the red blood cells. The treated cell pellet was subsequently washed once with DMEM with 10% (vol/vol) FCS supplemented with 50 μM mercaptoethanol, 1 mM sodium pyruvate, nonessential amino acids, L-glutamine, and 100 U penicillin and 100 μg streptomycin per ml. When mentioned they were cultured at 37 °C, in a humidified atmosphere of 5% CO2 in culture incubator. For cell sorting CD3, CD4, CD8 and CD19 antibodies were used and the sorting was done at the cell sorting facility at BIDMC. CD4+ naïve cells were isolated from murine splenic extracts using the MACS CD4+CD62L+ T Cell Isolation Kit II (Miltenyi Biotec, Gladbach, Germany)
For the proliferation assays, lymphocytes were suspended at a concentration of 5×10⁶/ml in PBS/2% FCS. CFSE (5,6-carboxyfluorescein diacetate succinimidyl ester, Molecular Probes, Eugene, OR) was added at a final concentration of 10μM and incubated at 37°C for 5 minutes. At the end of the incubation period, the cells were washed three times in cold complete RPMI, before being stimulated for 3-5 days.
Protein purification and Western Blotting
After several washings, the cells were treated initially on ice with a 200 μl lysis buffer (10 mM HEPES (pH 7.9), 10 mM KCl, 0.1 mM EDTA, 0.1 mM EGTA supplemented with freshly added 1 mM DTT, 0.5 mM PMSF, 2 mM aprotinin, 1 mM of leupeptin, 10 mM NaF, and 2 mM Na3VO4) for 15 min. At the end of the incubation, Nonidet P-40 was added to the reaction mixture at a concentration of 0.6%. The reaction mixture was vortexed for 10 seconds and then subjected to centrifugation at 13,000 rpm for 15 seconds. The supernatant was saved as cytoplasmic extract. The pellet was re-suspended in 25 μl of buffer (20 mM HEPES (pH 7.9), 0.4 M NaCl, 1 mM EDTA, 1 mM EGTA, 10 mM NaF, 1 mM Na3VO4, 1 mM PMSF, 2 mM aprotinin, and 1 mM of leupeptin) and then shook for 15 min at 4°C. After centrifugation for 5 minutes at 13,000 rpm, the supernatant was stored as nuclear extract. We followed the manufacturer's instructions (ECL, Amersham, Piscataway, NJ) for the Western blotting. A digital photograph was obtained and the density of each band was calculated with QuantityOne software (Bio-Rad, Hercules, CA).
Immunoglobulin and cytokine measurement
Measurement of human and murine IgG was performed using the ELISA kit from Immunology Laboratories according to the manufacturer's instructions. Human CD154 were measured using ELISA kits (R&D systems) according to manufacturer's instructions and murine CD154 using an ELISA kit from Promocell. The cytokines (human and murine) were measured using the flow cytometry-based bead cytokine array (BD biosciences).
Calcium Flux experiments
Murine lymphocytes (5×10⁶) were isolated, diluted in RPMI with 1% FCS and stained with fluorescent anti-CD4 and anti-CD8 antibodies as above. The cells were then washed and incubated with 1 mg/ml Indo-AM (Molecular Probes Inc., Eugene, OR) for 30 min at 37°C. After washing the cells again, the samples were run using LSRII flowcytometer (BD Biosciences) for 45 sec before adding anti-CD3 antibody (10 mg/ml). The samples were run on the flow cytometer for another 45 sec before adding a hamster anti-rat cross-linking antibody (Southern Biotech, Birmingham, AL). The samples were run for 5 minutes after that. The ratio of violet to blue emission of Indo-1, which is directly proportional to free cytosolic Ca2+, was then recorded and analyzed using FlowJo v. 9.0.1 (TreeStar, Ashland, OR).
Flow cytometry
Cells were isolated from peripheral blood of patients and healthy controls. Murine cells were isolated from lymph nodes and spleens of mice. The cells were stained with an antibody conjugated with a fluorescent dye for 20 minutes in room temperature, washed and then run on the flow cytometer. The analysis was done using the LSRII flow cytometer (BD Biosciences). In all experiments, at least 10,000 events were recorded and analyzed (FlowJo, v. 9.0.1, TreeStar, Ashland, OR).
Reagents
Anti-NFATc2, anti-NFATc1, anti-actin, anti-rabbit-horseradish peroxidase, anti-goat-horseradish peroxidase, anti-mouse-horseradish peroxidase antibodies and hamster anti-rat IgG were purchased from Santa Cruz Biotechnology (Santa Cruz, CA). Anti-human and anti-mouse CD3 and CD28 were purchased from Biolegend (San Diego, CA). Anti-human CD3, Anti-human CD8, Anti-human CD4, Anti-mouse CD3, Anti-mouse CD8, Anti-mouse CD4, Anti-mouse CD154 and anti-human CD154 fluorescent antibodies were purchased from BD Biosciences. Anti-mouse CD86 was purchased by eBioscience. Annexin V from Biolegend (San Diego, CA), and propidium iodide (PI) from Invitrogen Inc (Carlsbad, CA). Tartaric Acid was purchased by Ricca (Arlington, TX), tacrolimus and dipyridamole from Sigma Aldrich.
Statistical Analysis
The analysis was done using Graph Pad Prism 5.0™. The unpaired (or paired where appropriate) two-tail t-test was used. Statistical significance was defined as p<0.05.
Results
Calcium flux is robust and NFATc1 is over-expressed in MRL/lpr lymphocytes
The full repercussions of the robust calcium mobilization following the engagement of TCR (1) in human SLE T cells are unclear. To answer this question, we used lymphocytes from MRL/lpr mice with established nephritis (15 week-old) and control MRL/MpJ mice. Engagement of CD3 with an anti-CD3 antibody, followed by a crosslinking antibody resulted in higher and earlier calcium flux in the MRL/lpr T cells as compared to control T cells (Time (sec) to reach peak calcium content: MRL/lpr CD3+CD4-CD8- vs. MRL/lpr CD4+ vs. MRL/MpJ CD4+ ±SD: 32.8±14.3 vs. 97.2±18.2 vs. 228.1±11.1, p<0.0001 between each of the MRL/lpr groups and the control T cells, Fig. 1A and B). Among the major T cell subtypes, CD4-CD8- cells displayed the most robust response. Notably, CD3+CD4-CD8- cells displayed calcium influx prior to the addition of the cross-linking antibody probably due to the fact that lipid rafts are pre-aggregated on surface membranes of these cells (4, 13). Next we asked whether MRL/lpr T cells express higher levels of NFAT than control T cells. Indeed, we found that NFATc1 is increased in the cytoplasmic and the nuclear fractions of freshly isolated MRL/lpr lymphocytes as compared to MRL/MpJ lymphocytes (Fig. 1C). In contrast to patients with SLE (2), the levels of NFATc2 were not increased in MRL/lpr T cells as compared to control T cells (data not shown).
Figure 1. The calcium-NFAT pathway is hyperactive in MRL/lpr T cells.

Lymph node cells were isolated from MRL/lpr and MRL/MpJ mice. (A) The cells were stimulated in vitro with anti-CD3 antibody and anti-mouse cross-linking antibody, and the calcium tracing was recorded. Blue tracing: MRL/lpr CD3+CD4-CD8- cells; green: MRL/lpr CD4+ cells; red: MRL/MpJ CD4+ cells. (B) The time to reach the highest intracellular calcium concentration after the addition of the cross-linking antibody (n=3) is depicted here. (*): statistically significant difference. (C) Western blot of nuclear and cytoplasmic lysates from non-stimulated cells using anti-NFATc1 and actin antibodies are depicted here. (One out of three independent experiments). (D) MRL/lpr mice (n=3) ages 15-17 weeks and MRL/MpJ mice (n=2) of the same age were sacrificed. Spleen and lymph node CD3+CD4+ and CD3+CD4-CD8-, and CD19+ cells were isolated. The T cells were pretreated with tacrolimus 100 μg/mL or PBS for 30 min prior to activation. Then T cells were cultured for 13 days with B cells in the presence of anti-CD3/anti-CD28 antibodies. The IgG was measured in the supernatants. The IgG production of control T:B cell cultures was arbitrarily set at 1 and all IgG values are plotted as fold increase over control.
We also compared the calcium flux and NFATc1 levels in naïve T cells that were isolated from young pre-clinical disease (9 week-old) MRL/lpr and MRL/MPJ mice. We found that MRL/lpr naïve CD4+ cells had a faster calcium flux as compared to MRL/MpJ naïve CD4+ cells and that both groups had very low levels of NFATc1. This finding suggests that while the calcium hyper-responsiveness is an early feature of lupus T cells, the accumulation of NFATc1 happens gradually as the T cells acquire an effector phenotype.
Overall, our data suggest that MRL/lpr T cells show a hyperactive phenotype akin to human SLE T cells. Interestingly, this phenotype is prominent in the double negative population of MRL/lpr T cells, a population that is greatly expanded in these mice, and known to produce IL-17A rather than IL-2 and IFN-γ.
MRL/lpr T cells help B cells to produce immunoglobulin in a calcineurin-dependent manner
NFAT activation leads to increased transcription of an array of genes such as CD154, a co-stimulatory molecule that is important for the T cell directed autoantibody production by B cells (8, 14) in patients with SLE. To assess the role of the calcineurin-NFAT pathway in T cell-dependent B cell antibody production, we cultured sorted CD3+CD4+ and CD3+CD4-CD8- from MRL/lpr mice (15-17 weeks-old) and control mice with control mouse B cells in the presence of anti-CD3/anti-CD28 antibodies. As shown in Fig. 1D only MRL/lpr T cells provided help to normal B cells to produce immunoglobulin. There was no statistical difference between CD4-CD8- and CD4+ MRL/lpr T cells in their ability to stimulate IgG production by normal B cells. This T directed B cell antibody production was completely abrogated in the presence of the calcineurin inhibitor tacrolimus. These results expand our previous observations in patients with SLE, and suggest that the calcineurin-NFAT pathway is important in the T cell dependent overproduction of immunoglobulin in SLE.
Dipyridamole inhibits calcium-dependent signaling events in SLE T cells
Recently, it was reported that dipyridamole, a drug widely used to limit platelet activation, inhibits the calcineurin-NFAT pathway (10). We therefore asked whether dipyridamole inhibits the production of inflammatory cytokines and co-stimulatory molecules by human SLE T cells. First, normal T cells were activated with anti-CD3/anti-CD28 antibodies for 18 hours and the soluble CD154 levels in the supernatant were measured. As shown in Fig. 2A, dipyridamole at a concentration of 50μM prevented the secretion of CD154 by T cells (p: 0.04) similar to tacrolimus. Contrary to the effect on T cells, dipyridamole did not affect B cell activation, as measured by the expression of CD86 on B cells (Fig. 2B). Tacrolimus on the other hand partially inhibited B cell activation (Fig. 2B).
Figure 2. Dipyridamole blocks the expression of CD154 by T cells and does not affect B cell activation.
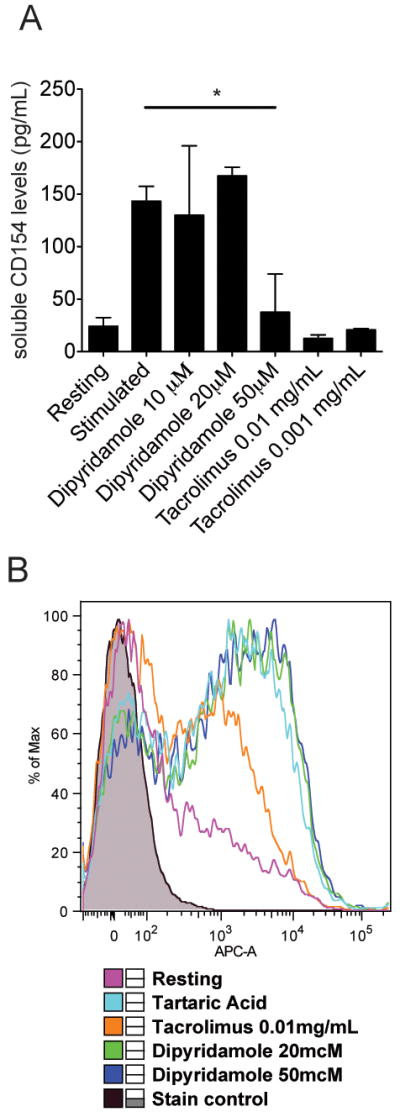
(A) Normal T cells were activated in vitro for 18 hours with anti-CD3 and anti-CD28 plate bound antibodies in the presence of absence of dipyridamole or tacrolimus in the concentrations indicated. Tartaric acid 0.4% was used as control. CD154 levels in the supernatant were measured by ELISA (summary of three independent experiments). (*) denotes statistically significant differences. (B) Normal B cells were isolated from leukapheresed blood and activated in vitro with an anti-IgM antibody for 18 hours. The cells were stained with an anti-CD86-APC conjugated antibody and the expression of CD86 was measured using flow cytometry (one out of three independent experiments).
Given these results we then asked whether dipyridamole could limit the expression of CD154 by SLE T cells and consequently the production of immunoglobulin by B cells. Indeed, as shown in Fig. 3A, dipyridamole at a concentration of 50 μM, blocked the secretion of CD154 by human SLE T cells almost as efficiently as tacrolimus (soluble CD154 (pg/mL)±SD: Tartaric acid vs. tacrolimus vs. dipyridamole treated samples: 396±125 (n=12) vs. 31±13 (n=5) 53±31 (n=9), p:0.0172 between tartaric acid and dipyridamole). Similarly (Fig. 3B), dipyridamole decreased the expression of surface CD154 on activated human SLE T cells, suggesting that the decrease in CD154 in the supernatants of cell cultures is a result of decrease in the expression of CD154 by activated SLE T cells and not a result of decreased CD154 shedding (% CD154+ activated T cells±SD: Tartaric acid treated vs. dipyridamole treated samples: 6.8±1.6 vs. 2.1±0.7, n=9, p: 0.0172). In a different set of experiments we evaluated the effect of dipyridamole on SLE T cell-directed B cell immunoglobulin production. Peripheral blood derived mononuclear cells (PBMC) from SLE patients were activated in vitro with anti-CD3/anti-CD28 antibodies in the presence of control tartaric acid or dipyridamole 50μM. As seen in Fig 3C, after 13 days of activation the immunoglobulin produced by the SLE PBMC in response to T cell activation was decreased by more than 50% in the presence of dipyridamole (p: 0.0098, n=11).
Figure 3. Dipyridamole blocks the expression of CD154 by SLE T cells and the production of immunoglobulin by SLE PBMC.

(A) T cells from SLE patients (n=9) were activated in vitro for 18 hours with anti-CD3/anti-CD28 plate bound antibodies in the presence of dipyridamole 50μM, tacrolimus 0.01 mg/mL or tartaric acid 0.4% (control). CD154 levels in the supernatant were measured with ELISA. (B) T cells from SLE patients (n=9) were activated in vitro for 18 hours with anti-CD3/anti-CD28 plate bound antibodies in the presence of dipyridamole 50μM or tartaric acid 0.4% (control). The surface CD154 was measured using flow cytometry and the percentage of CD154 expressing CD4+ T cells are plotted here. (C) PBMC from SLE patients (n=11) were activated with anti-CD3/CD28 antibodies in the presence of tartaric acid 0.4% or dipyridamole 50μM as described in the Patients and Methods. The IgG was measured in the culture supernatant using an ELISA. (*): statistically significant difference.
Dipyridamole inhibits cytokine production by SLE T cells
To determine whether dipyridamole inhibits the production of cytokines, SLE T cells were incubated with either dipyridamole 50μM or tartaric acid 0.4% and activated with anti-CD3/anti-CD28 antibodies for 18 hours, and the amount of the produced cytokines were determined in culture supernatants. As shown in Fig. 4A, IFN-γ, TNF-α, and IL-2 production were inhibited by dipyridamole. Similarly the secretion of the IL-17 (Fig. 4B) and IL-6 (Fig. 4C) were inhibited by dipyridamole. Of note, only SLE T cells and not normal T cells (data not shown) produced IL-17.
Figure 4. Dipyridamole blocks the expression of pro-inflammatory cytokines by SLE T cells.

T cells from SLE patients (n=9) were activated in vitro for 18 hours with anti-CD3 and anti-CD28 plate bound antibodies in the presence of dipyridamole 50 μM or tartaric acid 0.4 % (control). The supernatants were tested using a flow cytometry based method (see Materials and Methods) for various cytokine concentrations. (A) IFN-γ, TNF-α, IL-4 and IL-2 levels are shown here. (B) IL-17 levels are shown here. (C) IL-6 levels are shown here. (*): statistically significant difference between dipyridamole and tartaric acid treated activated T cells.
Since dipyridamole inhibited T cell cytokine production we postulated that it might also affect cell proliferation and/or apoptosis. As seen in Suppl. Fig. 1 (left panel), dipyridamole 50μM did not increase apoptosis in T cells from either healthy individuals or SLE patients. In contrast, dipyridamole 50μM prevented the proliferation of human SLE T cells similarly to tacrolimus as shown in Suppl. Fig. 1 (right panel). These results suggest that dipyridamole prevents the activation of SLE T cells, the production of pro-inflammatory cytokines and cell proliferation.
Dipyridamole inhibits the production of IL-6 and delays the emergence of nephritis and skin disease in lupus-prone mice
We next asked whether dipyridamole alters disease progression in lupus-prone mice. We treated MRL/lpr lupus-prone mice (11 week old) with either dipyridamole 50mg/kg (N=5) intraperitoneally three times a week or tartaric acid 0.4% (N=5). This dipyridamole dose is the mouse equivalent dose of 4 mg/kg in humans (15), a daily dose that is used routinely in clinical practice (oral administration). We found that during 3 weeks of treatment, the dipyridamole-treated animals had slower progression of nephritis when compared to control animals as measured by the development of proteinuria and pyuria (Fig. 5A and B). None of the dipyridamole-treated animals developed skin disease as opposed to 60% animals treated with vehicle that developed inflammatory ulcers (Fig. 5C and D). At the end of the three-week treatment only 40% of the control-treated mice were still alive while none of the dipyridamole-treated animals died. At the end of the treatment, the two groups did not differ in the size of the spleen and lymph nodes. The splenocyte population in the dipyridamole-treated group vs. control-treated group was characterized by a lower percentage of CD3+ cells (43.3±6.5% vs. 87.7±0.6%, p=0.02). Among the CD3+ cells, the CD3+CD4-CD8- population was significantly decreased in the dipyridamole-treated group with a reciprocal relative increase in the number of CD4+ and CD8+ cells (Fig. 6A). We observed a relative increase in the total B cell population in the dipyridamole-treated group. Total IgG and dsDNA antibody levels were no different in the sera of the two groups. IL-6 levels in the serum of vehicle treated animals were increased significantly compared to the dipyridamole treated group (Fig. 6B). IFN-γ, IL-2 and TNF-α levels did not differ between the two groups or control normal mice (data not shown). It has to be noted that the animals in the control group that did not survive beyond the third week and were presumably the sickest (higher proteinuria levels and worse skin ulcers) were not included in these comparisons. We conclude, therefore, that dipyridamole beyond anti-T cell activity in vitro, can be useful anti-SLE medication at doses that are within the therapeutic window for patients.
Figure 5. Dipyridamole delays the progression of kidney disease and prevents the emergence of skin ulcers in MRL/lpr mice.

5 mice were treated with three times weekly dipyridamole 50 mg/kg i.p. and 5 mice with Tartaric acid 0.4%. The progression of proteinuria (A) and pyuria (B) as measured by a semiquantitave method (described in Patients and Methods) is depicted here. (C) Dipyridamole-treated animals (top panel) did not develop the skin ulcers that control treated mice developed (lower panel). (D) H&E stain (4×) of the ulcerative lesion from an MRL/lpr mouse and a higher power (20×) exhibiting vacuolar changes at the epithelial basement in healthy appearing skin close to the ulcer.
Figure 6. Dipyridamole treatment of MRL/lpr mice leads to a relative decrease in the number of CD3+CD4-CD8- cells in the spleens of treated animals and a decrease in IL-6 in their serum.

(A) Splenocytes from MRL/lpr mice treated with control (upper panel) or dipyridamole (lower panel) for 3 weeks were isolated and stained for CD3, CD4 and CD8. The cells depicted here are gated on CD3. (B) The IL-6 was measured in the serum of the MRL/lpr mice treated with dipyridamole or control at the end of the 3-week treatment using flow cytometry. (*): statistically significant difference.
Discussion
The aberrant phenotype that characterizes SLE T cells results in a skewing of the T cell response towards heightened effector and deficient regulatory functions (16). We have previously shown that SLE T cells display increased calcium influx following TCR engagement. The exact functional repercussions of this observation are fully explored for the first time in this communication. We show that T cells from MRL/lpr mice and especially the double negative population are characterized by robust calcium influx following in vitro activation and have increased levels of NFATc1. In T cells from SLE patients, NFATc2 is increased (2), where herein we report that NFATc1 is increased in MRL/lpr T cells. Given similar functions of the two isomers, we assume transferability between human and murine data.
Previously thought as anergic, CD3+CD4-CD8- cells do not produce IL-2 and IFN-γ, but are expanded in patients with SLE and lupus prone mice and produce IL-17 in an IL-23-dependent fashion (9, 17, 18). In this communication we show that DN T cells are characterized by robust and early calcium flux and that they provide help to B cells in a calcineurin-dependent manner. This is in agreement with previous data from human SLE T cell lines (19, 20).
Given these data, we evaluated the usefulness of inhibiting the NFAT pathway in SLE. The traditional calcineurin inhibitor tacrolimus is highly effective in blocking NFAT activation in SLE T cells (Fig. 1D) but has significant side effects, including hypertension and renal toxicity, when used in patients with SLE. In this communication we provide definitive evidence that the newly recognized calcineurin-NFAT interaction inhibitor dipyridamole (10) can suppress human and murine SLE T cell function.
Dipyridamole is a phosphodiesterase inhibitor that leads to an increase in intracellular cAMP. It is primarily used for its anti-platelet and vasodilator effects in the treatment of various conditions including strokes and certain types of nephritis (22). More recently, it has been recognized that dipyridamole has anti-inflammatory properties (eg inhibiting the production of metalloproteinases) and that it can act synergistically to corticosteroids (21).
Herein, we show that dipyridamole suppressed the production of cytokines and co-stimulatory molecules by SLE T cells and limited their proliferation. We also show in in vivo experiments that lupus-related pathology was suppressed in dipyridamole-treated lupus prone mice. It has to be noted though that the effect of dipyridamole on T cell proliferation was not as striking in vivo as the in vitro experiments would have suggested, possibly reflecting pharmacodynamic and/or pharmacokinetic limitations. Another explanation could be that dipyridamole also limits the production of cytokines such as IL-2, TNF-α that may play a role in immune homeostasis (eg IL-2 is important in Treg activity). Further studies in animals with lupus are needed to define the role and more importantly the timing of dipyridamole administration in order to minimize its potential effects on immune homeostasis.
B cell activation does not seem to be affected by dipyridamole, which is probably the reason why MRL/lpr immunoglobulin levels and B cell numbers were not affected by this treatment. It is possible though that if dipyridamole is administered to lupus-prone animals early in their disease course, it may suppress the generation and activation of B cells by blocking T cell help.
In conclusion, the demonstrated ability of dipyridamole to block cytokine production, T cell-mediated help to B cells, and control pathology in the MRL/lpr mouse, urge the performance of definitive clinical trials in patients with SLE where dipyridamole is added to standard treatment.
Supplementary Material
Naïve CD4+CD62L+ cells were isolated from MRL/lpr and MRL/MpJ mice as described in Materials and Methods. (A) The cells were stimulated in vitro with anti-CD3 antibody and anti-mouse cross-linking antibody (cross-linker), and the calcium tracing was recorded. The blue tracing corresponds to MRL/lpr naïve T cells, and the red to MRL/MpJ naïve T cells. (B) Western blot of total non-stimulated cell lysates from the indicated populations. The membranes were stained with anti-NFATc1 and actin antibodies.
T cells from SLE patients (n=3) were isolated. (A) The cells were stimulated with anti-CD3/anti-CD28 for 18 hrs and then stained for Annexin V. (B) The same SLE T cells were loaded with CFSE and then stimulated with anti-CD3/anti-CD28 for 5 days. The level of fluorescence as measured by flow cytometry is depicted here. The tinted line represents the fluorescence of resting cells, the black tracing corresponds to stimulated cells, the long-dashed line to tacrolimus treated cells and the dotted line to dipyridamole-treated cells.
Acknowledgments
We would like to thank Dr. Madhukar Shinde for his help with the cell separation, culture and Western blots.
Financial Support Information: This work was supported by National Institute of Health Grants RO1 AI42269, RO1 AI 49954 (GCT), and K23 AR055672 (VCK).
The work presented herein was exclusively supported by NIH funds. None of the authors have received or are expected to receive royalties from industry as a result of this.
Footnotes
None of the authors has potential financial conflicts that could compromise the claims made herein.
References
- 1.Vassilopoulos D, Kovacs B, Tsokos GC. TCR/CD3 complex-mediated signal transduction pathway in T cells and T cell lines from patients with systemic lupus erythematosus. J Immunol. 1995;155(4):2269–81. [PubMed] [Google Scholar]
- 2.Kyttaris VC, Wang Y, Juang YT, Weinstein A, Tsokos GC. Increased levels of NF-ATc2 differentially regulate CD154 and IL-2 genes in T cells from patients with systemic lupus erythematosus. J Immunol. 2007;178(3):1960–6. doi: 10.4049/jimmunol.178.3.1960. [DOI] [PubMed] [Google Scholar]
- 3.Mehta J, Genin A, Brunner M, Scalzi LV, Mishra N, Beukelman T, et al. Prolonged expression of CD154 on CD4 T cells from pediatric lupus patients correlates with increased CD154 transcription, increased nuclear factor of activated T cell activity, and glomerulonephritis. Arthritis Rheum. 62(8):2499–509. doi: 10.1002/art.27554. [DOI] [PMC free article] [PubMed] [Google Scholar]
- 4.Krishnan S, Nambiar MP, Warke VG, Fisher CU, Mitchell J, Delaney N, et al. Alterations in lipid raft composition and dynamics contribute to abnormal T cell responses in systemic lupus erythematosus. J Immunol. 2004;172(12):7821–31. doi: 10.4049/jimmunol.172.12.7821. [DOI] [PubMed] [Google Scholar]
- 5.Krishnan S, Juang YT, Chowdhury B, Magilavy A, Fisher CU, Nguyen H, et al. Differential expression and molecular associations of Syk in systemic lupus erythematosus T cells. J Immunol. 2008;181(11):8145–52. doi: 10.4049/jimmunol.181.11.8145. [DOI] [PMC free article] [PubMed] [Google Scholar]
- 6.Krishnan S, Warke VG, Nambiar MP, Tsokos GC, Farber DL. The FcR gamma subunit and Syk kinase replace the CD3 zeta-chain and ZAP-70 kinase in the TCR signaling complex of human effector CD4 T cells. J Immunol. 2003;170(8):4189–95. doi: 10.4049/jimmunol.170.8.4189. [DOI] [PubMed] [Google Scholar]
- 7.Nagy G, Barcza M, Gonchoroff N, Phillips PE, Perl A. Nitric oxide-dependent mitochondrial biogenesis generates Ca2+ signaling profile of lupus T cells. J Immunol. 2004;173(6):3676–83. doi: 10.4049/jimmunol.173.6.3676. [DOI] [PMC free article] [PubMed] [Google Scholar]
- 8.Desai-Mehta A, Lu L, Ramsey-Goldman R, Datta SK. Hyperexpression of CD40 ligand by B and T cells in human lupus and its role in pathogenic autoantibody production. J Clin Invest. 1996;97(9):2063–73. doi: 10.1172/JCI118643. [DOI] [PMC free article] [PubMed] [Google Scholar]
- 9.Crispin JC, Oukka M, Bayliss G, Cohen RA, Van Beek CA, Stillman IE, et al. Expanded double negative T cells in patients with systemic lupus erythematosus produce IL-17 and infiltrate the kidneys. J Immunol. 2008;181(12):8761–6. doi: 10.4049/jimmunol.181.12.8761. [DOI] [PMC free article] [PubMed] [Google Scholar]
- 10.Mulero MC, Aubareda A, Orzaez M, Messeguer J, Serrano-Candelas E, Martinez-Hoyer S, et al. Inhibiting the calcineurin-NFAT (nuclear factor of activated T cells) signaling pathway with a regulator of calcineurin-derived peptide without affecting general calcineurin phosphatase activity. J Biol Chem. 2009;284(14):9394–401. doi: 10.1074/jbc.M805889200. [DOI] [PMC free article] [PubMed] [Google Scholar]
- 11.Hochberg MC. Updating the American College of Rheumatology revised criteria for the classification of systemic lupus erythematosus. Arthritis Rheum. 1997;40(9):1725. doi: 10.1002/art.1780400928. [DOI] [PubMed] [Google Scholar]
- 12.Bombardier C, Gladman DD, Urowitz MB, Caron D, Chang CH. Derivation of the SLEDAI. A disease activity index for lupus patients. The Committee on Prognosis Studies in SLE. Arthritis Rheum. 1992;35(6):630–40. doi: 10.1002/art.1780350606. [DOI] [PubMed] [Google Scholar]
- 13.Deng GM, Tsokos GC. Cholera toxin B accelerates disease progression in lupus-prone mice by promoting lipid raft aggregation. J Immunol. 2008;181(6):4019–26. doi: 10.4049/jimmunol.181.6.4019. [DOI] [PMC free article] [PubMed] [Google Scholar]
- 14.Koshy M, Berger D, Crow MK. Increased expression of CD40 ligand on systemic lupus erythematosus lymphocytes. J Clin Invest. 1996;98(3):826–37. doi: 10.1172/JCI118855. [DOI] [PMC free article] [PubMed] [Google Scholar]
- 15.Reagan-Shaw S, Nihal M, Ahmad N. Dose translation from animal to human studies revisited. FASEB J. 2008;22(3):659–61. doi: 10.1096/fj.07-9574LSF. [DOI] [PubMed] [Google Scholar]
- 16.Crispin JC, Liossis SN, Kis-Toth K, Lieberman LA, Kyttaris VC, Juang YT, et al. Pathogenesis of human systemic lupus erythematosus: recent advances. Trends Mol Med. 2010;16(2):47–57. doi: 10.1016/j.molmed.2009.12.005. [DOI] [PMC free article] [PubMed] [Google Scholar]
- 17.Kyttaris VC, Zhang Z, Kuchroo VK, Oukka M, Tsokos GC. Cutting edge: IL-23 receptor deficiency prevents the development of lupus nephritis in C57BL/6-lpr/lpr mice. J Immunol. 2010;184(9):4605–9. doi: 10.4049/jimmunol.0903595. [DOI] [PMC free article] [PubMed] [Google Scholar]
- 18.Zhang Z, Kyttaris VC, Tsokos GC. The role of IL-23/IL-17 axis in lupus nephritis. J Immunol. 2009;183(5):3160–9. doi: 10.4049/jimmunol.0900385. [DOI] [PMC free article] [PubMed] [Google Scholar]
- 19.Rajagopalan S, Zordan T, Tsokos GC, Datta SK. Pathogenic anti-DNA autoantibody-inducing T helper cell lines from patients with active lupus nephritis: isolation of CD4-8- T helper cell lines that express the gamma delta T-cell antigen receptor. Proc Natl Acad Sci U S A. 1990;87(18):7020–4. doi: 10.1073/pnas.87.18.7020. [DOI] [PMC free article] [PubMed] [Google Scholar]
- 20.Shivakumar S, Tsokos GC, Datta SK. T cell receptor alpha/beta expressing double-negative (CD4-/CD8-) and CD4+ T helper cells in humans augment the production of pathogenic anti-DNA autoantibodies associated with lupus nephritis. J Immunol. 1989;143(1):103–12. [PubMed] [Google Scholar]
- 21.Zimmermann GR, Avery W, Finelli AL, Farwell M, Fraser CC, Borisy AA. Selective amplification of glucocorticoid anti-inflammatory activity through synergistic multi-target action of a combination drug. Arthritis Res Ther. 2009;11(1):R12. doi: 10.1186/ar2602. [DOI] [PMC free article] [PubMed] [Google Scholar]
- 22.Demircin G, Oner A, Erdogan O, Delibas A, Baysun S, Bulbul M, et al. Long-term efficacy and safety of quadruple therapy in childhood diffuse proliferative lupus nephritis. Ren Fail. 2008;30(6):603–9. doi: 10.1080/08860220802132171. [DOI] [PubMed] [Google Scholar]
Associated Data
This section collects any data citations, data availability statements, or supplementary materials included in this article.
Supplementary Materials
Naïve CD4+CD62L+ cells were isolated from MRL/lpr and MRL/MpJ mice as described in Materials and Methods. (A) The cells were stimulated in vitro with anti-CD3 antibody and anti-mouse cross-linking antibody (cross-linker), and the calcium tracing was recorded. The blue tracing corresponds to MRL/lpr naïve T cells, and the red to MRL/MpJ naïve T cells. (B) Western blot of total non-stimulated cell lysates from the indicated populations. The membranes were stained with anti-NFATc1 and actin antibodies.
T cells from SLE patients (n=3) were isolated. (A) The cells were stimulated with anti-CD3/anti-CD28 for 18 hrs and then stained for Annexin V. (B) The same SLE T cells were loaded with CFSE and then stimulated with anti-CD3/anti-CD28 for 5 days. The level of fluorescence as measured by flow cytometry is depicted here. The tinted line represents the fluorescence of resting cells, the black tracing corresponds to stimulated cells, the long-dashed line to tacrolimus treated cells and the dotted line to dipyridamole-treated cells.