Abstract
Background
Previous studies have implicated histone deacetylases (HDACs) and HDAC inhibitors (HDIs) such as Trichostatin A (TSA) in the regulation of gene expression during drug addiction. Furthermore, an increase in HDAC activity has been linked to neurodegeneration. Alcohol has also been shown to promote abundant generation of reactive oxygen species (ROS) resulting in oxidative stress. TSA inhibits HDACs and has been shown to be neuroprotective in other neurodegenerative disease models. Although HDACs and HDIs have been associated with drug addiction, there is no evidence of the neurodegenerative role of HDAC2 and neuroprotective role of TSA in alcohol addiction. Therefore, we hypothesize that alcohol modulates HDAC2 through mechanisms involving oxidative stress.
Methods
In order to test our hypothesis, the human neuronal cell line, SK-N-MC, was treated with different concentrations of alcohol (EtOH); and HDAC2 gene and protein expression were assessed at different time points. Pharmacological inhibition of HDAC2 with TSA was evaluated at the gene level using qRT-PCR and at the protein level using western blot and flow cytometry. ROS production was measured with a fluorescence microplate reader and fluorescence microscopy.
Results
Our results showed a dose dependent increase of HDAC2 expression with EtOH treatment. Additionally, alcohol significantly induced ROS, and pharmacological inhibition of HDAC2 with TSA was shown to be neuroprotective by significantly inhibiting HDAC2 and ROS.
Conclusion
These results suggest that EtOH can upregulate HDAC2 through mechanisms involving oxidative stress and HDACs may play an important role in Alcohol Use Disorders (AUDs). Moreover, the use of HDIs may be of therapeutic significance for the treatment of neurodegenerative disorders including AUDs.
Keywords: Ethanol, histone deacetylases, trichostatin A, SK-N-MC, oxidative stress
Introduction
Despite the efforts to develop new medications for Alcohol Use Disorders (AUD), there is still a lack of more effective treatments. According to National Institute of Alcohol Abuse and Alcoholism (NIAAA), approximately 18 million Americans suffer from alcohol use disorders and only 7% of these individuals received any form of treatment (NIAAA, 2009). Alcohol dependence (AD) is a complex addiction regulated by multiple mechanisms including neurotransmitters and enzymes. Histone deacetylases (HDACs) as well as their inhibitor, Trichostatin A (TSA), have been found to regulate various genes during drug addiction. Although HDACs have been associated with drug addiction or addictive behavior, the role of HDAC dysregulation has not been examined in alcohol addiction. Amongst class I HDACs that are ubiquitously expressed in various tissues and cell types, HDAC1 and HDAC2 have been shown to be involved in neuronal fate. Moreover, HDAC2 has also been shown to be involved in neuronal cell differentiation (Bai et al., 2005). In the current study, we explore the role of alcohol on HDAC2 expression in the human neuronal cell line, SK-N-MC.
Histone acetyltransferases (HATs) and histone deacetylases (HDACs) are enzymes that remove acetyl groups to and from target lysine residues within histones (Min-Hao and Allis, 1998, Peterson and Laniel, 2004) resulting in regulation of gene expression. HATs tend to be transcriptional activators whereas HDACs tend to be repressors (Bannister, 2010). Regulation of gene expression is known to contribute to the long-term effects in response to drugs of abuse and recent studies have demonstrated that HDACs and Histone Deacetylase inhibitors (HDIs) play a major role in drug dependence (Romieu et al., 2008) . Furthermore, these enzymes have been implicated in human disease, making them important drug targets. Recent studies have indicated that ethanol exposure induces global protein hyperacetylation which likely leads to alcohol-induced hepatotoxicity (Shepard and Tuma, 2009). Therefore, such histone modifications may underlie the mechanisms involved in ethanol induced cellular injury (Shukla and Aroor, 2006). However, most of the studies have been focused on the effects of alcohol in hepatocytes and liver injury; and very little is known about the effects of alcohol on HDAC2 and the role of its inhibitor TSA in alcohol-mediated effects in human CNS cells.
While HDACs are expressed abundantly in the brain, little is known about their roles in brain function. Evidence suggests that these enzymes regulate neuronal survival and neurodegeneration (D'Mello, 2009). Furthermore, HDIs have recently been known to modulate genes involved in drug addiction such as the µ opioid receptor gene (MOR) (Lin et al., 2008), and decrease cocaine self administration in rats (Romieu et al., 2008). Impressively, HDIs have been found to be neuroprotective in cellular and animal models of acute and chronic neurodegenerative diseases such as Alzheimer’s (Alan et al., 2009) and the neuroprotective role of HDIs seems to extend to other diseases that share mechanisms of oxidative stress, inflammation and neuronal cell apoptosis (Gray and Dangond, 2006). TSA can be used to alter gene expression by interfering with the removal of acetyl groups from histones, and therefore can interfere with transcription factors and their ability to access the DNA molecules inside chromatin. Although HDACs have been associated with drug addiction and TSA has been shown to be neuroprotective in other disease models, there is no evidence of the neuroprotective role of HDACs and TSA in alcohol addiction. Therefore, it is hypothesized that alcohol modulates HDAC2 through mechanisms involving oxidative stress. In the current study, we report the effects of alcohol on the expression of HDAC2 in the neuronal cell line, SK-N-MC. Moreover, pharmacological inhibition with TSA was also performed to test the specific alcohol regulation of HDAC2. To delineate the mechanisms of action of alcohol, we measured ROS production after treatment with EtOH, TSA, or anti-oxidants; and the effect of antioxidants on HDAC2 gene expression was further analyzed. Our results show that alcohol upregulates HDAC2 through mechanisms involving oxidative stress and these effects can be blocked with harmacological inhibition of histone deacetylases.
Materials and Methods
SK-N-MC Cell Culture
The neuronal cell line, SK-N-MC was purchased from ATCC (catalog # HTB-10, Manassas, VA) and cultured in Eagle’s Minimum Essential Medium (MEM) (catalog # 30–2003) supplemented with fetal bovine serum to a final concentration of 10% (catalog # 30–2020) and 1% antibiotic/antimycotic solution (Sigma-Aldrich, St. Louis, MO). For all the gene and protein experiments, SK-N-MC were cultured at a concentration of 5 × 10⁵ cells/ml in 6 well plates overnight to allow them to reach at least 60% confluency before any further treatment.
Alcohol (EtOH) and Trichostatin A (TSA) Treatment of SK-N-MC
After incubating the cells overnight and allowing them to reach 60% confluency, SK-N-MC cells were treated with 0.05% (~10 mM), 0.1% (~20 mM), and 0.2% (~40 mM) EtOH (catalog # E7023). For the TSA experiments, after reaching confluency, the cells were pre-treated for 2 hours with 50–250 nM TSA, then treated with 20 mM EtOH for 24 and 48 hours. Based on dose response results (data not shown), the lower concentration of TSA (50 nM) was used for subsequent studies. The EtOH and TSA (catalog # T1952) used in the present experiments were obtained from Sigma-Aldrich (St. Louis, MO). The medium was changed and reagents were replenished every 24 hours. At these concentrations, alcohol and TSA did not affect the viability of the cells as tested by MTT assay (data not shown).
RNA Extraction and Quantitative Real-Time PCR (qRT-PCR)
SK-N-MC cells were harvested at 24 and 48 hours, and the RNA was extracted from the cell pellets using the RNAeasy mini kit from Qiagen (Valencia, CA). Equal quantities of RNA (1 µg) from all the samples were reversed transcribed using the high-capacity cDNA reverse transcription kit from Applied Biosystems (Foster City, CA) to perform qRT-PCR using the Taqman gene expression assays (Applied Biosystems) for the expression of HDAC2 (Assay ID Hs00231032_m1) gene. GAPDH (Hs99999905_m1) and 18S rRNA (catalog # 4333760F) were used as endogenous controls. Relative abundance of each mRNA species was assessed using the Brilliant qRT-PCR master mix from Stratagene (Cedar Creek, TX) as previously described by us (Gandhi et al., 2010). All data were controlled for quantity of RNA input by performing measurements on two endogenous reference genes GAPDH and 18S rRNA. In addition, results on RNA from treated samples were normalized to results obtained on RNA from control, untreated samples.
Intracellular HDAC2 Analysis by Flow Cytometry
To assess the levels of HDAC2 protein in SK-N-MC, the cells were treated with ~20 mM EtOH, or 50 nM TSA, or pretreated with TSA (50nM) two hours prior to EtOH treatment. The cells were then harvested at 48 hours after EtOH treatment and counted; equal amounts of cells (1 × 10⁶) were aliquoted in 12 × 75 mm polystyrene falcon tubes, catalog # 352058 (BD Biosciences, San Jose, CA), blocked with human serum and normal goat serum (Chemicon International, Temecula, CA), and fixed and permeabilized with Cytofix/Cytoperm solution (BD Bioscience). The HDAC2 protein was detected with the primary monoclonal antibody, rabbit anti-histone deacetylase 2 (Millipore) and secondary antibody, goat anti-rabbit IgG FITC-conjugated (Millipore). Cells were acquired on a Beckman Coulter instrument and analyzed with WinMDI 2.5 software. A total of 10,000 events were collected for each sample. Cells were gated based on unlabeled and secondary antibody controls. Cells positive for specific protein are shown in the histograms with shifted mean fluorescence intensity compared to controls.
HDAC2 protein levels by Western Blot Analysis
For the HDAC2 western blot analysis, the cells were treated for 48 hours with ~20 mM EtOH, or 50 nM TSA, or pretreated with TSA 2 hours prior to EtOH treatment; the cells were harvested and the cell lysates were prepared in protein extraction reagent (Pierce Biotechnology, Rockford, IL) containing protease inhibitor (Pierce Biotechnology) following manufacture’s recommendations. The protein levels were quantified using the protein assay reagent (Bio-Rad laboratories, Hercules, CA). Equal quantities of protein (10 µg) were denatured and subjected to SDS-PAGE and transferred into a nitrocellulose membrane (Bio-Rad laboratories), blocked with 10% nonfat dry milk, washed with tris-buffered saline-tween 20 (TBST), and incubated overnight with primary antibodies, rabbit anti-histone deacetylase 2 (Millipore). After overnight incubation, the membranes were washed and incubated for 1 hour with secondary antibody, goat anti-rabbit IgG horseradish peroxidase (HRP)-conjugated (Millipore). The blot was developed using the super signal west pico chemiluminescent substrate (Pierce Biotechnology).
Reactive Oxygen Species (ROS) Detection
ROS levels in SK-N-MC were detected using dichlorofluorescein diacetate assay (DCF-DA; Molecular Probes, Eugene, OR). Cells were cultured in 96-well plates (100,000 cells/well) overnight to allow 60% confluency. The next day, the cells were washed and pretreated with antioxidants, catalase (0.001 mg) or uric acid (50 µM), or TSA for 2 hours. The cells were then treated with DCF-DA (100 µM) for 30 minutes at 37 °C, and treated with EtOH (0.1–0.2%) or H2O2 (50 µM) for 2 hours, and read in a Biotek Synergy HT microplate reader (excitation 485 nm and emission 528 nm). Proper controls with cells treated with antioxidants or H2O2 alone were included. Furthermore, fluorescence was visualized in an Olympus IX51 microscope and image captured and analyzed with the Qimaging camera and software.
Statistics
All experiments were performed at least three times in triplicates and the values obtained were averaged. Data are represented as the mean ± SE. Comparisons between two groups were performed using the student’s paired t-test. Differences were considered significant at P ≤ 0.05.
Results
Alcohol Induces HDAC2 Gene Expression
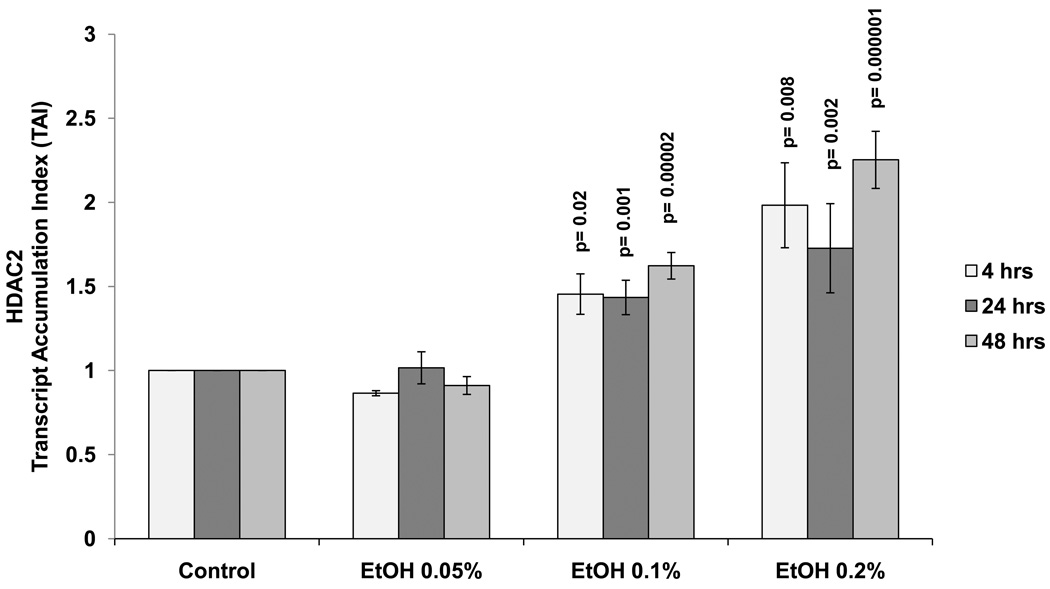
Data presented in figure 1 show the kinetic as well as the dose response (0.05 to 0.2%) effects of alcohol on HDAC2 in SK-N-MC cells at 4 to 48 hours. There is a significant dose dependent increase of HDAC2 gene at 0.1% and 0.2% alcohol concentrations compared to the untreated controls. Since there were no significant differences observed between time points, the 24 hour treatment period and the 0.1% alcohol concentration were selected for subsequent experiments. The EtOH concentrations (0.05–0.2%) used are non-toxic and do not affect cell viability as demonstrated by MTT cell viability assay and trypan blue cell count (data not shown).
Figure 1. Alcohol Induces HDAC2 Gene Expression.
SK-N-MC (5 × 10⁵ cells/ml) were incubated in 6-well plates overnight to allow attachment and 60% confluency. They were treated with EtOH (0.05%-0.2%) for 4–48 hours. After incubation, the cells were harvested, RNA was extracted and reverse transcribed followed by qRT- PCR for HDAC2 and endogenous GAPDH and 18S rRNA gene expression. Data are expressed as mean ± SEM of TAI values of three independent experiments. A value of p ≤ 0.05 was indicative of significance.
TSA Inhibits HDAC2 Gene Expression
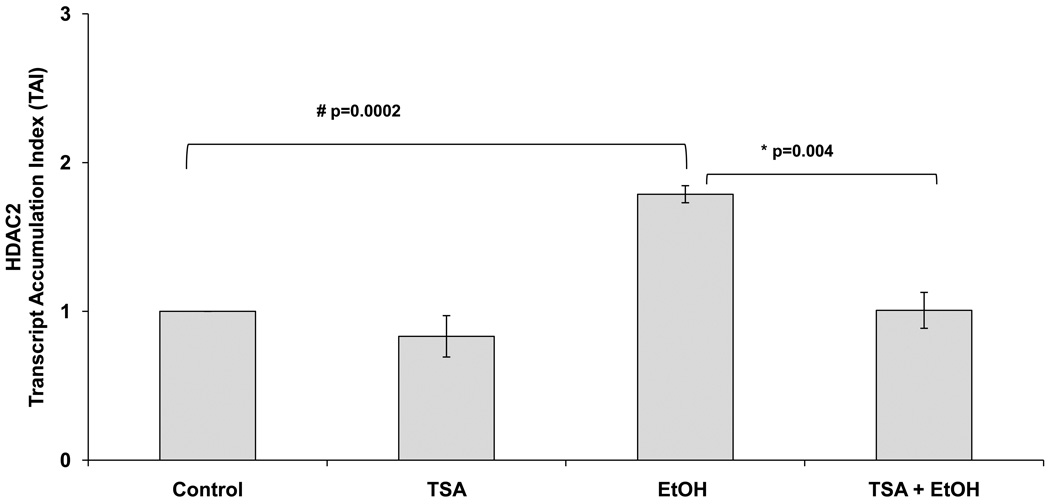
TSA is a widely used HDI known to selectively inhibit the class I and II mammalian HDAC families of enzymes; therefore, in this set of experiments, we used it to inhibit the alcohol-mediated upregulation of HDAC2. Data in figure 2 show a significant inhibition of HDAC2 gene expression in SK-N-MC cells by TSA (50 nM) treatment prior to EtOH (~20 mM) treatment (24 hours).
Figure 2. Alcohol Induces HDAC2 Gene and this Effect is Inhibited by TSA.
After reaching confluency, SK-N-MC were pre-treated with TSA (50 nM) for 2 hours, then treated with EtOH (0.1%) for 24 hours. After incubation, cells were harvested, RNA was extracted and reverse transcribed followed by qRT- PCR for HDAC2 and housekeeping GAPDH and 18sRNA gene expression. EtOH significantly enhanced HDAC2, while TSA + EtOH treatment significantly inhibited HDAC2 gene. Data are expressed as mean ± SEM of TAI values of at least three independent experiments. # represents significance compared to control. * represents significance compared to EtOH treatment.
TSA Inhibits HDAC2 Protein Levels
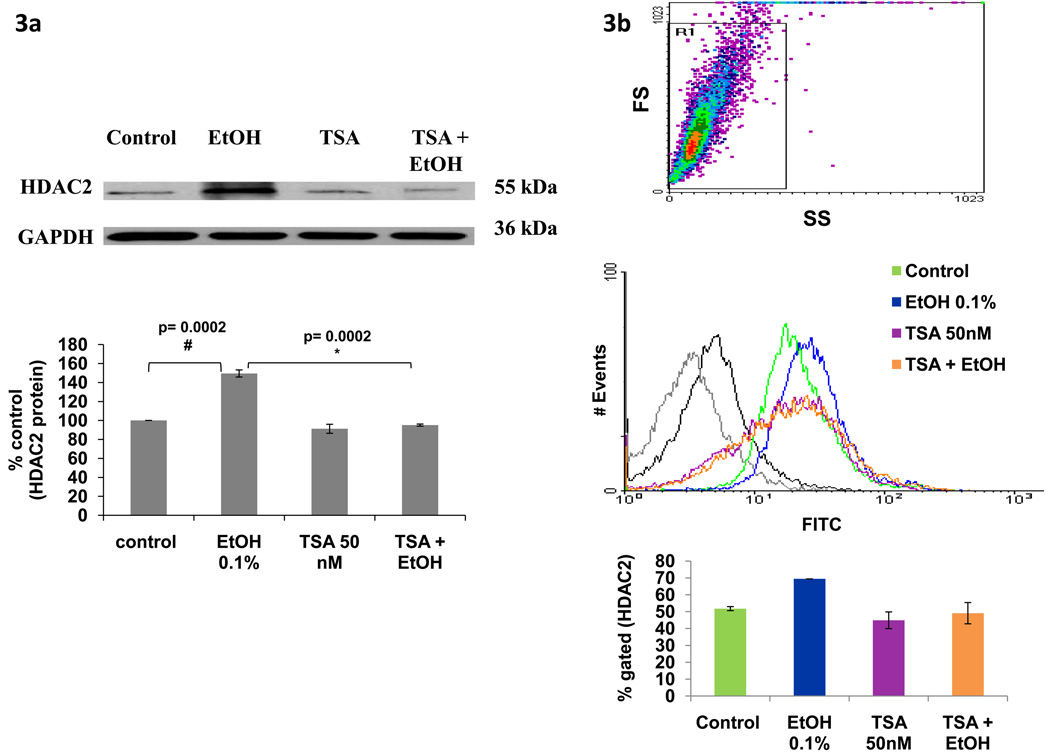
Besides gene expression studies, we also determined protein levels using western blot and flow cytometry. SK-N-MC cells were treated with EtOH (20 mM), TSA (50 nM), or pretreated for 2 hours with TSA and then treated with EtOH for 48 hours. The cell lysates or the cell pellets were analyzed using western blot (figure 3a) and flow cytometry (figure 3b), respectively. Results from figures 3a and 3b show an increase in protein levels of HDAC2 after treatment with EtOH, and this effect is inhibited by TSA. These results are consistent with the gene expression results presented in figure 2.
Figure 3. Alcohol Induces HDAC2 Protein and this Effect is Inhibited by TSA.
After reaching confluency, SK-N-MC were pre-incubated with TSA for 2 hours, then treated with EtOH (0.1%) for 48 hours. In figure 3a, 10 µg of protein were analyzed using western blot with primary anti-HDAC2 and secondary anti-IgG-HRP antibodies. GAPDH was used as a loading control. Data presented show a representative blot indicating modulation of HDAC2 protein expression and a bar graph representing the mean ± SE of % densitometry values of HDAC2 protein levels (% control) of three independent experiments. # represents significance compared to control. * represents significance compared to EtOH treatment. For the flow cytometry experiments, 1 × 10⁶ cells were fixed and permeabilized prior to intracellular staining with primary anti-HDAC2 and secondary anti-IgG-FITC antibody. Data presented in figure 3b show a representative histogram overlay of the gated cells. The bar graph represents the mean ± SE of % of gated cells expressing HDAC2. 10000 events were analyzed per sample. The gray and black histograms represent the unlabeled and secondary antibody controls respectively; the green histogram is the untreated control (~52%), blue represents EtOH (~69 %), purple represents TSA (~45%), and orange represents TSA + EtOH (~49%) treated cells. Data are representative of three independent experiments.
TSA Inhibits Alcohol-induced ROS Production
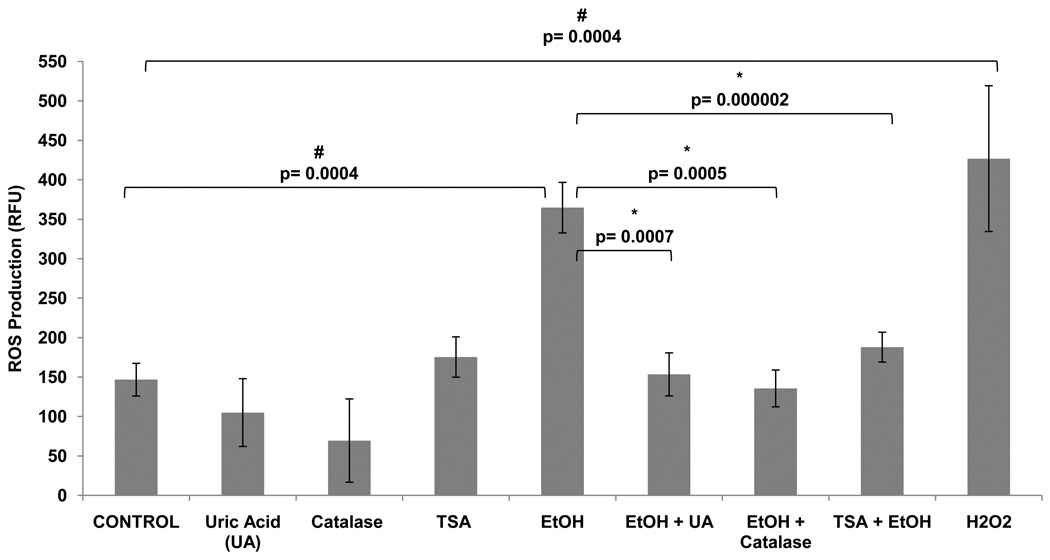
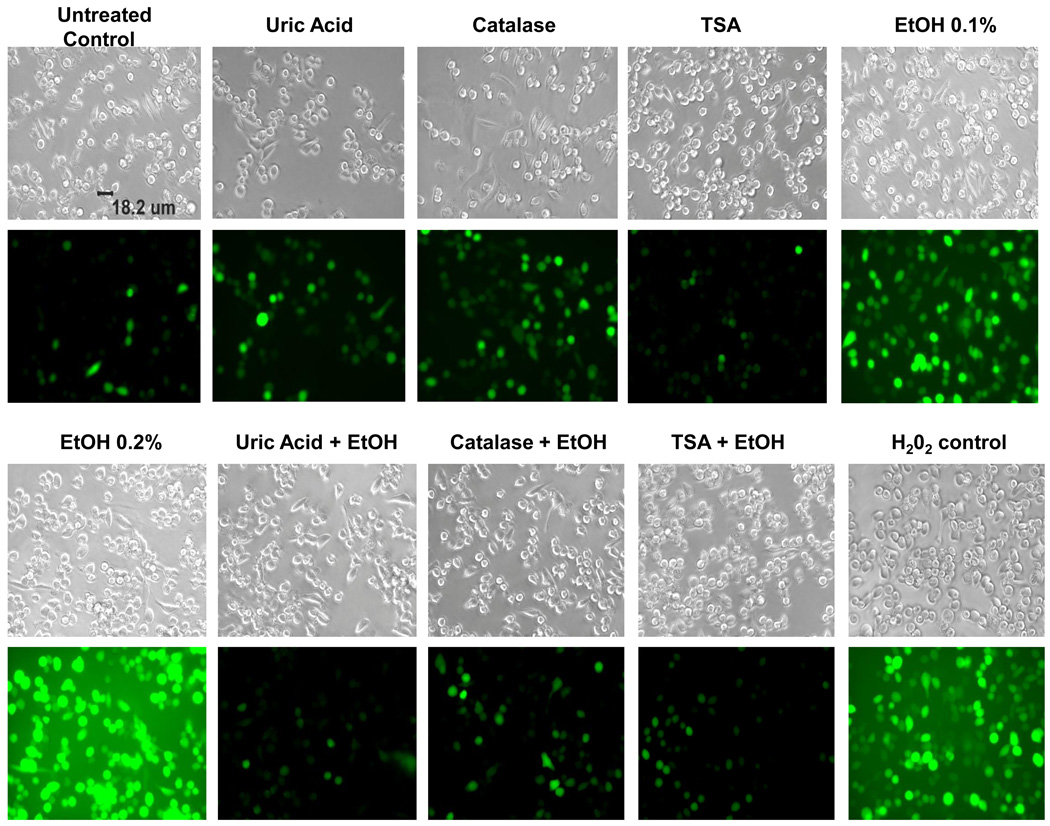
Previous studies have reported that EtOH induces ROS production in human primary neurons leading to oxidative stress and neuronal injury (Haorah et al., 2008). However, the effects of TSA on ROS production and the ability of TSA to prevent alcohol-induced ROS have not been reported yet. In this set of experiments, we tested the effect of TSA on alcohol-induced production of ROS. TSA was shown to decrease the levels of ROS to levels similar of those shown by antioxidants, catalase and uric acid. The fluorescence was measured by a fluorescence plate reader (figure 4) and results were expressed as mean relative fluorescence units (RFU). Fluorescence images were captured with an Olympus IX51 microscope (figure 5). According to our results, TSA is acting as an anti-oxidant by inhibiting ROS production.
Figure 4. Alcohol Induces ROS Production and this Effect is Inhibited by Antioxidants and TSA.
SK-N-MC (1 × 10⁵ cells) were incubated in 96-well plates overnight. Then, the cells were pre-incubated with TSA or antioxidants: uric acid (50 µM) or catalase (0.001 mg) for 2 hours, DCF-DA (100 µM) for 1 hour, then treated with EtOH or H2O2 (50 µM). Levels of ROS were measured with the Biotek Synergy HT plate reader. The fluorescence was detected at 485 excitation and at 528 emission spectra. Data are expressed as mean ± SE of RFU values of six independent experiments. A value of p ≤ 0.05 was indicative of significance. # represents significance compared to control. * represents significance compared to EtOH treatment.
Figure 5. Alcohol-induced ROS Production as Measured by Fluorescence Microscopy.
SKN-MC (1 × 10⁵ cells) were incubated in 96-well plates overnight. Then, the cells were pre-incubated with TSA or antioxidants: uric acid (50 µM) or catalase (0.001 mg) for 2 hours, DCF-DA (100 µM) for 1 hr., then treated with EtOH (0.1–0.2 %) H2O2 (50 µM) was used as a positive control. Reactive oxygen species were observed using fluorescence microcopy. Fluorescence images were captured with an Olympus IX51 microscope. Images are representative of three independent experiments.
Treatment with Antioxidants Inhibits HDAC2 Gene Expression
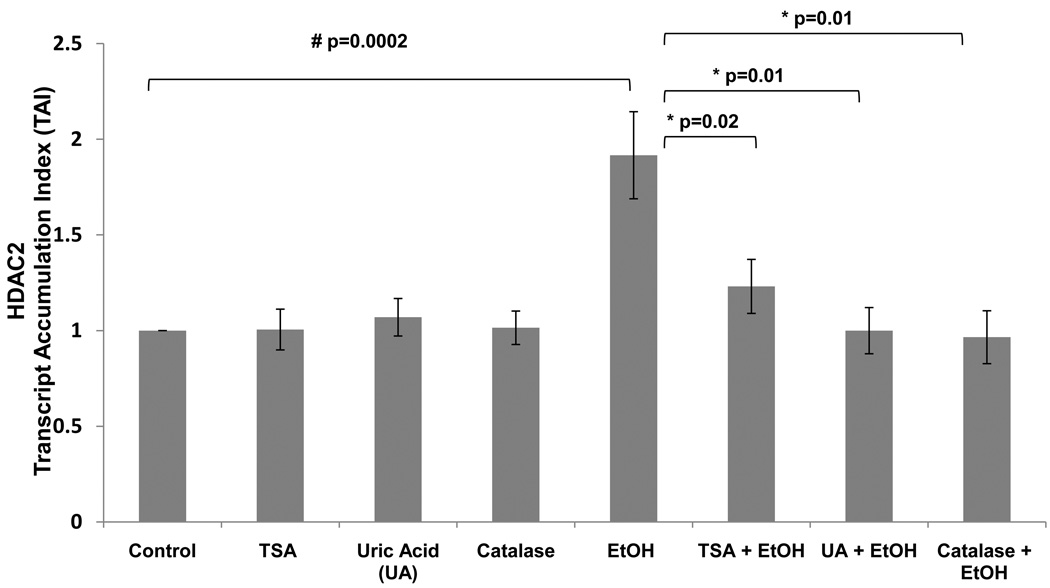
Our data above showed that alcohol is up-regulating HDAC2 in a dose dependent manner; inducing oxidative stress by an observed increase in ROS production; and these effects were blocked by pharmacological inhibition of HDAC2. TSA is acting similar to the anti-oxidants, catalase and uric acid, by inhibiting ROS production (figures 4 and 5). Therefore, in this set of experiments, we tested the effects of these antioxidants on HDAC2 gene expression to further confirm the involvement of oxidative stress on the alcohol-induced effect on HDAC2. Results in figure 6 show there is a significant inhibition of HDAC2 gene in the antioxidant pre-treated cells (p=0.01) compared to the alcohol treated cells.
Figure 6. Alcohol Induces HDAC2 Gene Expression and this Effect is Inhibited by Antioxidants.
After reaching confluency, SK-N-MC were pre-treated with TSA (50 nM) for 2 hrs, then treated with EtOH (0.1%) for 24 hrs. After incubation, cells were harvested, RNA was extracted and reverse transcribed followed by qRT- PCR for HDAC2 and endogenous GAPDH and 18S rRNA, gene expression. Data are expressed as mean ± SEM of TAI values of three independent experiments. # represents significance compared to control. * represents significance compared to EtOH treatment.
Discussion
Alcohol acts through numerous pathways to affect the brain and other organs leading to the development of neurodegeneration. There is no single process that can account for all the effects of alcohol on an organism; and instead many mechanisms act together to reflect the actions of alcohol. Recently, epigenetic mechanisms involving histone deacetylases and their inhibitors have been the main focus of brain research. For instance, Histone deacetylase inhibitors (HDIs) have been shown to have anti-inflammatory and neuroprotective effects in the brain (Kim et al., 2007). The neuroprotective role of HDIs seems to extend to diseases that share mechanisms of oxidative stress, inflammation, and neuronal cell apoptosis (Steven and Fernando, 2006). Therefore, in order to elucidate the mechanisms of alcohol and eventually identify genes that will have novel therapeutic relevance, we analyzed the effects of acute alcohol treatment on the HDAC2 gene and the role of the histone deacetylase inhibitor, TSA, on EtOH-induced effects. It is evident from our kinetic studies that acute alcohol treatment enhanced HDAC2 expression in a dose dependent manner (figure 1); and TSA inhibited HDAC2 gene (figure 2) and protein (figure 3) expression.
One factor that has been suggested to play a central role in many pathways of alcohol-induced damage is the excessive generation of free radicals, which can result in oxidative stress. Different mechanisms have been suggested for alcohol toxicity including an increase in oxidative stress, but the association between oxidative stress in the brain and EtOH-induced effects on HDACs are poorly understood. Interestingly, HDIs have been shown to protect cortical neurons from oxidative stress-induced cell death (Ryu et al., 2003) and they have been found to be neuroprotective in cellular and animal models of acute and chronic neurodegenerative diseases such as Alzheimer’s (Alan et al., 2009). Furthermore, HDIs have also been shown to inhibit the nuclear factor kappa B (NFκB)-mediated inflammatory responses by a variety of mechanisms in other neurodegenerative disease models (Segain et al., 2000). Although it has been shown that HDIs can protect neuronal cells from oxidative stress-induced cell death, the studies were done in other neurodegenerative disease models and there is no evidence of TSA’s neuroprotective effects in alcohol-induced toxicity. Since quantitative methods of ROS detection help elucidate the mechanisms of alcohol-induced neurodegeneration, ROS levels were measured after EtOH and TSA treatments. Since alcohol is inducing oxidative stress as shown by an increase in ROS production; and TSA has the ability to prevent ROS (figures 4 and 5), it is possible that the molecular basis of the effects observed on histone deacetylases after alcohol treatment may be mediated via oxidative stress.
In the current study, we are the first ones to show that TSA has neuroprotective properties and reduces EtOH-induced oxidative stress as shown by a decrease in ROS production (figures 4 and 5). The oxidative stress effects caused by alcohol were observed at early time points as shown by an increase in ROS after 2 hrs. of treatment and may subsequently result in the late onset effects observed in reference to HDAC2 gene and protein induced by EtOH. These results provide evidence for a possible mechanistic role of oxidative stress in the alcohol-induced upregulation of HDAC2. To further confirm the involvement of oxidative stress on the alcohol-induced effect on histone deacetylases, we tested the effects of antioxidants, uric acid and catalase, on HDAC2 gene expression. Inhibition of HDAC2 gene was evident when the cells were treated with antioxidants prior to EtOH treatment. In summary, the results presented in this study show for the first time a crucial involvement of HDAC2 in alcohol effects and demonstrate some of the novel neuroprotective properties of TSA for its use in alcohol use disorders.
Acknowledgements
This research was supported by grants from the National Institutes of Health (NIH): R37DA025576, R01DA012366, and R01DA021537.
References
- Alan PK, Yihua C, Tapadar S, Nancy EL, Peter MB, Zhenyu Z, Melissa ADA, Weng-Long W, Yong S, Brett L. Searching for Disease Modifiers - PKC Activation and HDAC Inhibition - A Dual Drug Approach to Alzheimer's Disease that Decreases Abeta Production while Blocking Oxidative Stress. ChemMedChem. 2009;4:1095–1105. doi: 10.1002/cmdc.200900045. [DOI] [PMC free article] [PubMed] [Google Scholar]
- Bai S, Ghoshal K, Datta J, Majumder S, Yoon SO, Jacob ST. DNA Methyltransferase 3b Regulates Nerve Growth Factor-Induced Differentiation of PC12 Cells by Recruiting Histone Deacetylase 2. Mol. Cell. Biol. 2005;25:751–766. doi: 10.1128/MCB.25.2.751-766.2005. [DOI] [PMC free article] [PubMed] [Google Scholar] [Retracted]
- Bannister A. Key epigenetic processes & links to cancer by Dr. Andy Bannister (Cambridge University) The role of epigenetics in cancer. 2010 Abcam plc. [Google Scholar]
- D'Mello SR. Histone deacetylases as targets for the treatment of human neurodegenerative diseases. Drug news & perspectives. 2009;22:513–524. doi: 10.1358/dnp.2009.9.1428871. [DOI] [PMC free article] [PubMed] [Google Scholar]
- Gandhi N, Saiyed ZM, Napuri J, Samikkannu T, Reddy PVB, Agudelo M, Khatavkar P, Saxena SK, Nair MPN. Interactive role of human immunodeficiency virus type 1 (HIV-1) clade-specific Tat protein and cocaine in blood-brain barrier dysfunction: Implications for HIV-1 associated neurocognitive disorder. Journal of Neurovirology. 2010;16:294–305. doi: 10.3109/13550284.2010.499891. [DOI] [PubMed] [Google Scholar]
- Gray S, Dangond F. Rationale for the Use of Histone Deacetylase Inhibitors as a Dual Therapeutic Modality in Multiple Sclerosis. Epigenetics. 2006;1:67–75. doi: 10.4161/epi.1.2.2678. [DOI] [PubMed] [Google Scholar]
- Haorah J, Ramirez SH, Floreani N, Gorantla S, Morsey B, Persidsky Y. Mechanism of alcohol-induced oxidative stress and neuronal injury. Free Radical Biology and Medicine. 2008;45:1542–1550. doi: 10.1016/j.freeradbiomed.2008.08.030. [DOI] [PMC free article] [PubMed] [Google Scholar]
- Kim HJ, Rowe M, Ren M, Hong J-S, Chen P-S, Chuang D-M. Histone Deacetylase Inhibitors Exhibit Anti-Inflammatory and Neuroprotective Effects in a Rat Permanent Ischemic Model of Stroke: Multiple Mechanisms of Action. Journal of Pharmacology and Experimental Therapeutics. 2007;321:892–901. doi: 10.1124/jpet.107.120188. [DOI] [PubMed] [Google Scholar]
- Lin Y-C, Flock KE, Cook RJ, Hunkele AJ, Loh HH, Ko JL. Effects of trichostatin A on neuronal mu-opioid receptor gene expression. Brain Research. 2008;1246:1–10. doi: 10.1016/j.brainres.2008.09.083. [DOI] [PMC free article] [PubMed] [Google Scholar]
- Min-Hao K, Allis CD. Roles of histone acetyltransferases and deacetylases in gene regulation. BioEssays. 1998;20:615–626. doi: 10.1002/(SICI)1521-1878(199808)20:8<615::AID-BIES4>3.0.CO;2-H. [DOI] [PubMed] [Google Scholar]
- NIAAA. National Institute on Alcohol Abuse and Alcoholism: Five Year Strategic Plan, FY07-11. Alcohol Acrooss the Lifespan. 2009 [Google Scholar]
- Peterson CL, Laniel M. Histones and histone modifications. Current Biology. 2004;14:R546–R551. doi: 10.1016/j.cub.2004.07.007. [DOI] [PubMed] [Google Scholar]
- Romieu P, Host L, Gobaille S, Sandner G, Aunis D, Zwiller J. Histone Deacetylase Inhibitors Decrease Cocaine But Not Sucrose Self-Administration in Rats. J Neurosci. 2008;28:9342–9348. doi: 10.1523/JNEUROSCI.0379-08.2008. [DOI] [PMC free article] [PubMed] [Google Scholar]
- Ryu H, Lee J, Olofsson BA, Mwidau A, Deodoglu A, Escudero M, Flemington E, Azizkhan-Clifford J, Ferrante RJ, Ratan RR. Histone deacetylase inhibitors prevent oxidative neuronal death independent of expanded polyglutamine repeats via an Sp1-dependent pathway. Proceedings of the National Academy of Sciences of the United States of America. 2003;100:4281–4286. doi: 10.1073/pnas.0737363100. [DOI] [PMC free article] [PubMed] [Google Scholar]
- Segain JP, De La Blétière DR, Bourreille A, Leray V, Gervois N, Rosales C, Ferrier L, Bonnet C, Blottiãre HM, Galmiche JP. Butyrate inhibits inflammatory responses through NFkB inhibition: implications for Crohn's disease. Gut. 2000;47:397–403. doi: 10.1136/gut.47.3.397. [DOI] [PMC free article] [PubMed] [Google Scholar]
- Shepard B, Tuma P. Alcohol-induced protein hyperacetylation: Mechanisms and consequences. World J Gastroenterol. 2009;15:1219–1230. doi: 10.3748/wjg.15.1219. [DOI] [PMC free article] [PubMed] [Google Scholar]
- Shukla S, Aroor A. Epigenetic effects of ethanol on liver and gastrointestinal injury. World J Gastroenterol. 2006;12:5265–5271. doi: 10.3748/wjg.v12.i33.5265. [DOI] [PMC free article] [PubMed] [Google Scholar]
- Steven G, Fernando D. Rationale for the use of histone deacetylase inhibitors as a dual therapeutic modality in multiple sclerosis. Epigenetics. 2006;1:67–75. doi: 10.4161/epi.1.2.2678. [DOI] [PubMed] [Google Scholar]


