Abstract
The development of cochlear ilmplants for the treatment of patients with profound hearing loss has advanced considerably in the last few decades, particularly in the field of speech comprehension. However, attempts to provide not only sound decoding but also spatial hearing are limited by our understanding of circuit adaptations in the absence of auditory input. Here we investigate the lateral superior olive (LSO), a nucleus involved in interaural level difference (ILD) processing in the auditory brainstem using a mouse model of congenital deafness (the dn/dn mouse). An electrophysiological investigation of principal neurons of the LSO from the dn/dn mouse reveals a higher than normal proportion of single spiking (SS) neurons, and an increase in the hyperpolarisation-activated Ih current. However, inhibitory glycinergic input to the LSO appears to develop normally both pre and postsynaptically in dn/dn mice despite the absence of auditory nerve activity. In combination with previous electrophysiological findings from the dn/dn mouse, we also compile a simple Hodgkin and Huxley circuit model in order to investigate possible computational deficits in ILD processing resulting from congenital hearing loss. We find that the predominance of SS neurons in the dn/dn LSO may compensate for upstream modifications and help to maintain a functioning ILD circuit in the dn/dn mouse. This could have clinical repercussions on the development of stimulation paradigms for spatial hearing with cochlear implants.
1. Introduction
In the last few decades, cochlear implants have become a clinical reality as a hope to restore hearing in deaf patients, even at the level of comprehension of speech. Implants can replace and bypass cochlear inner-hair cells, thereby restoring audition in profound deafness. This technology can be used in a variety of conditions including some cases of congenital deafness (Yang et al., 2004). However, several studies have shown that deafness changes the manner in which the nervous system processes auditory information (Kotak et al., 2005; Ryals et al., 1991). Previous studies from our laboratory have investigated the effects of congenital deafness (using the deafness – dn/dn – mouse as a model) on neurons and synapses of the anteroventral cochlear nucleus (AVCN) and the medial nucleus of the trapezoid body (MNTB) (Leao et al., 2005, 2004a, 2004b, 2006c; Oleskevich and Walmsley, 2002, 2004; Walmsley et al., 2006).
The dn/dn mouse is a spontaneous mutant mouse that suffers from a congenital form of asymptomatic deafness caused by a mutation in the Tmc1 gene (transmembrane cochlear-expressed gene 1), also implicated in several forms of hereditary deafness in humans (Kurima et al., 2002). From birth, these mice appear to lack both spontaneous auditory nerve activity (Durham et al., 1989; Leao et al., 2006c; Steel and Bock, 1980) and a cochlear microphonic response (Steel and Bock, 1980), with successive morphological degeneration of the entire organ of Corti (Bock et al., 1982; Durham et al., 1989; Marcotti et al., 2006; Pujol et al., 1983). Although spontaneous activity is again apparent at the level of the cochlear nucleus (Youssoufian et al., 2008), prior to hearing onset, the auditory brainstem of these mice develops without normal cochlea-driven spontaneous activity.
The dn/dn form of congenital deafness leads to a mosaic of changes in different areas of the auditory brainstem. Several pre and postsynaptic changes in central neurons of the auditory brainstem are apparent with virtually no changes in neuronal morphology (Leao et al., 2005, 2004a, 2004b; Oleskevich and Walmsley, 2002, 2004). Specifically, bushy cells in the AVCN display normal firing properties but glutamatergic EPSCs from the endbulb of Held show greater depression and more asynchronous release (Leao et al., 2005; Oleskevich and Walmsley, 2002). In contrast, the calyx of Held synapse seems to be normal (Oleskevich et al., 2004). Postsynaptically however, principal neurons of the MNTB show significant changes in firing properties and in several ion currents: the voltage-gated Na+ (Leao et al., 2006b), Ih (Leao et al., 2005) and low-threshold voltage-gated K+ current (Leao et al., 2004a). In addition, there is a perturbation of the (topo-graphically) graded distribution of ionic currents (Leao et al., 2006c). It is therefore apparent that a lack of cochlea-driven activity during development has diverse and unexpected affects on the different nuclei of the auditory brainstem (Walmsley et al., 2006).
Here, we investigated the development of inhibition to the LSO from the MNTB in congenitally deaf mice. Our results indicate that despite the lack of auditory nerve activity, and the abnormal development of the presynaptic nuclei of this sound localisation pathway, glycinergic inhibition to the LSO appears to have developed normally by postnatal day 13–15. In addition, we compiled the main findings on firing properties and synapses of bushy cells of the AVCN, and principal neurons of the MNTB and LSO of dn/dn mice into a computational model to acquire some insights into superior olivary complex (SOC) function in congenital deafness.
2. Methods
2.1. Electrophysiology
Control and congenitally deaf mice (CBA and dn/dn on CBA background respectively) were decapitated without anaesthetic at 13–30 days postnatal in accordance with the Australian National University Animals Ethics Committee Protocol. Transverse sections of the auditory brainstem (200 μM) were taken with a vibrating microtome (Integraslice 7550 PSDS, Campden Instruments), and continually perfused with an ice-cold low-calcium, hypertonic sucrose artificial cerebrospinal fluid (ASCF) consisting of (in mM) 218 sucrose, 26.2 NaHCO3, 10 glucose, 5 MgCl2, 3 KCl, 1.25 NaH2PO4 and 1 CaCl2 equilibrated and constantly bubbled with `carbogen' (95% O2, 5% CO2). Slices were then incubated for 1 h at 35 °C in modified ACSF (in mM: 130 NaCl, 26.2 NaHCO3, 10 glucose, 3 KCl, 1.25 NaH2PO4, 2 CaCl2 and 1 MgCl2), electrophysiological recordings were subsequently made at room temperature (22–25 °C) or at 35 °C.
Slices were visualised using infrared differential interference contrast optics (Hamamatsu) fitted to an upright microscope (Olympus). Whole cell patch electrode recordings (at a membrane potential of −60 mV) were made from LSO principal neurons. Patch electrodes (3–5 MΩ resistance) were pulled from borosilicate hematocrit glass tubing using a two-stage Narashige puller (Japan), and contained CsCl based (in mM: 120 CsCl, 4 NaCl, 4 MgCl2, 0.001 CaCl2, 10 HEPES, 3 Mg-ATP, 0.1 GTP-Tris, and 0.2–10 EGTA) or K-gluconate based (in mM: 17.5 KCl, 122.5 K-gluconate, 9 NaCl, 1 MgCl2, 1 HEPES and 0.2 EGTA) internal solution. pH was adjusted to 7.2 using CsOH or KOH and osmolarity was adjusted if necessary to 290 mOsm using sorbitol. Series resistance, which was <20 MΩ, was routinely compensated by >80%. Synaptic currents were recorded and filtered at 10 kHz with a multiclamp 700B amplifier (Molecular Devices) before being digitised at 20 kHz. Data acquisition and analysis were performed using Axograph X (Axograph). The amplitudes of spontaneous IPSCs were measured using semiautomated detection procedures as previously described (Clements and Bekkers, 1997). To isolate miniature glycinergic IPSCs (mIPSCs) we added (in μM): 10 6-cyano-7-nitroquinoxaline-2,3-dione (CNQX; Tocris), 50 (±)-2-amino-5-phosphonopentanoic acid (DAP5; RBI), 10 bicuculline methochloride (BIC; Tocris), and 1 tetrodotoxin (TTX; Alamone). Strychnine hydrochloride (STR; Sigma) was used (1 μM) in control experiments to abolish mIPSCs. In order to determine the amount of inhibition that is produced by glycine, a stimulating electrode was placed in the MNTB ipsilateral to the LSO to evoke IPSCs. Cells which were found to exhibit strong IPSCs in response to the stimulating pulse were then perfused with CNQX and DAP-5 in ACSF to determine the total amplitude of the inhibitory currents. BIC was added to the perfusate (in conjunction with CNQX and DAP-5) to remove the GABAA contribution to the IPSC. As a control, some cells were subsequently perfused with STR to abolish glycinergic currents. The amplitudes and decay time constants of evoked IPSCs were analysed in Axograph X. Decay time constants and amplitudes were then compared to pharmacologically isolated glycinergic IPSCs to determine what proportion of the total IPSCs were accounted for by current through GlyRs. We also analysed the reversal potential for glycine-mediated synaptic currents (Cl− ) in cell-attached configuration using symmetrical [K+](Verheugen et al., 1999). Details on the method can be found in Verheugen et al. (1999), but in summary, in cell-attached experiments, the pipette was filled with symmetrical K+ solution (in mM: 150 KCl, 2 EGTA, 2 MgCl2 and 5 HEPES; pH was adjusted to 7.3 with KOH) and a voltage ramp (−80 to + 40 mV) applied to determine the reversal of the K+ gradient before and immediately after the pressure-application of glycine (1 μM), thus indicating the effect of glycinergic currents on the membrane voltage. Results are expressed as mean ± SEM unless otherwise indicated; significance of results was assessed using a two-tailed student's t test, Kolmo-gorov–Smirnov test or Z test, with a significance threshold of p < 0.05.
2.2. Immunohistochemistry
All mice were anaesthetized intraperitoneally with Nembutal (50 mg/ml) at 100 mg/kg body weight and perfused via the left ventricle with cold vascular rinse (0.01 M phosphate buffer with 137 mM NaCl, 3.4 mM KCl, and 6.0 NaHCO3 at 4 °C) followed by room temperature fixative (4% paraformaldehyde in 0.1 M phosphate buffer at pH 7.4) for 10–15 min. Brainstems were dissected and post-fixed (4% paraformaldehyde in 0.1 M phosphate buffer at pH 7.4) at 4 °C for 2 h before cryoprotecting at 4 °C in 0.1 M phosphate buffer with 15% sucrose.
Prior to sectioning, tissue was submerged in cryoprotectant solution (500 ml 0.1 M phosphate buffer at pH 7.2, 300 g sucrose 10 g polyvinylpyrrolidone, 300 ml ethylene glycol, 200 ml double distilled H2O) for 5–10 min and subsequently coated in OCT (Tissue-Tek #4583). Transverse LSO sections (20 μm thick) were obtained on a freezing sliding microtome and mounted on gelatin-coated slides
Tissue sections were blocked with 5% normal horse serum in 0.1 M phosphate buffered saline with 0.1% Triton X-100 for 30–60 min, and subsequently incubated overnight at room temperature with the appropriate commercially available primary antibody (Alvarez et al., 1997; Geiman et al., 2000, 2002; Leao et al., 2004b; Lim et al., 1999; Oleskevich et al., 1999): mouse anti-gephyrin mAb 7a (1:100; Boehringer Mannheim; catalogue no: 1770 236), mouse anti-GAD67 (GABA decarboxylase – 1:200, Chemicon; catalogue no: MAB5406) and guinea pig anti-GlyT2 (glycine transporter – 1:1000; Chemicon; catalogue no: AB1773). After washing, immunoreactive sites were visualised by incubation (2 h) in species appropriate FITC-, Cy3-, or Cy5-conjugated secondary antibodies, washed again, and coverslipped with fluorescence Vectashield mounting medium (Vector Laboratories). Where appropriate, cell bodies were visualised with FITC-conjugated flourescent Nissl stain (1:100; Molecular Probes). The anti-bodies used in this Flourecscent images were collected using a laser-scanning confocal microscope (Olympus Fluoview FV-1000) with a 20× dry or 60× oil objective and digitally magnified 1.5–3.0× at 1024 × 1024 pixel resolution. Fluorescent molecular labels were excited at laser wavelengths 488 nm (FITC), 568 nm (Cy3), and 633 nm (Cy5). Sequential sampling was performed as required to avoid crosstalk. Gepheryn cluster sizes (areas) were calculated using ImageJ (Lim et al., 1999).
2.3. Computational models
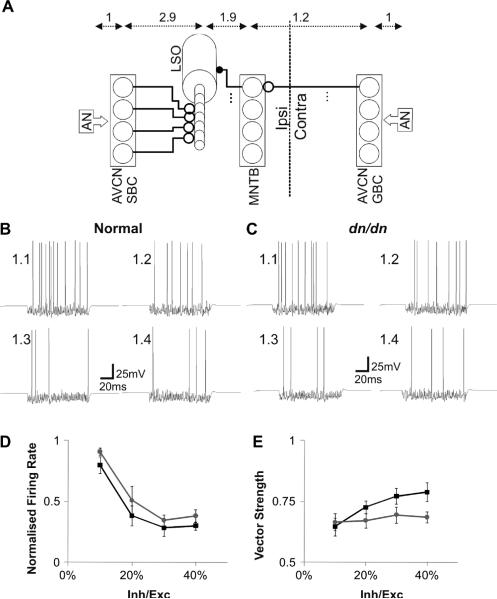
The schematic diagram of our AVCN/MNTB/LSO network is shown in Fig. 9A. Fig. 9A also summarises the sites in the network that are affected by deafness. In our model, auditory nerve fibres were stimulated by electrical pulses that cause a sharp rise in firing probability Pi in the ith auditory nerve fibre for the duration of the stimulus pulse (Tstim). AVCN globular and spherical bushy cells were modelled according to the work of (Rothman et al., 1993). Bushy cells, in both normal and dn/dn mouse models no significant difference was observed experimentally between bushy cells in normal and dn/dn mice (Leao et al., 2005), consisted of one compartment containing a voltage (V)-dependent Na+ conductance, a low and high-threshold K+ conductance, and an unspecific, V-independent leak conductance: , gL and gL (Rothman et al., 1993). Details regarding the calculation of evolution variables and membrane potentials for bushy cells are found in Rothman et al. (1993). Bushy cells received giant synaptic terminals: 2 endbulbs of Held for spherical bushy cells (SBC) and 14 modified endbulbs for globular bushy cells (GBC). Both types of presynaptic terminals were affected by congenital deafness in our model (Oleskevich and Walmsley, 2002). We modelled the spontaneous/asynchronous A(t) and phasic P(t) release in normal and dn/dn mice similarly to Otsu et al. (2004): A(t)=pA(t)R(t) and P(t) = pP(t)R, where pA(t) and pP(t) are the rate of spontaneous/ asynchronous and phasic release per vesicle and R(t) is the size of the readily releasable pool. Estimating pA(t) and pP(t) involves calculating the residual Ca2+ using the following equation:
| (1) |
where [Ca2+]0 is set to zero and TCa is the Ca2+ sequestration time constant, δ is a Dirac delta function and tn is the time of the nth synaptic event. Details in the calculation and modelling of release can be found in Otsu et al. (2004). The rates of asynchronous/spontaneous and phasic release have the following forms:
| (2) |
| (3) |
where KA and KP are the affinities of the sites for spontaneous/asynchronous and phasic release respectively, and NP and NA are corresponding Ca2+ cooperativities. Note that unlike in the original equations, the probability of spontaneous release P0A is calculated together with the asynchronous release. Finally, R(t) can be calculated by:
| (4) |
where TS = 1/(kf + kb) is the rate of recovery of the releasable pool and kf and kb are the rates of docking and undocking, respectively (Otsu et al., 2004). Constant values are shown in Table 1; values were chosen that approximate those observed by Oleskevich and Walmsley (2002) in normal and dn/dn mice. In order to produce EPSPs, each vesicle caused a 1 ms long `pulse' of glutamate in the synaptic cleft (adapted from the work of Graham et al. (2001) at the calyx of Held).
Fig. 9.
Modelled single-firing LSO cells decrease firing to changes in contralateral inhibition similarly in normal and dn/dn mice. A. AVCN/MNTB/LSO network showing ipsi and contralateral circuits. The ipsilateral ear is stimulated with constant amplitude (30% of maximum) and the contralateral ear (inhibitory) is stimulated with various amplitudes (see text). AVCN SBCs project excitatory terminals (open circles) to LSO dendrites. Contralateral AVCN GBCs project excitatory inputs to the ipsilateral MNTB that in turn send inhibitory terminals to the soma of ipsilateral LSO cells. Numbers on top represent the delay between each synapse (in ms). Examples of LSO single-unit response to fixed ipsilateral excitation of the AN (30% of the maximum stimulation amplitude) versus increasing contralateral inhibition (arriving from ipsilateral MNTB cells - 10% to 40% maximum stimulation amplitude of the contralateral AN) from the normal (B) and dn/dn (C) models. D. Summary of normalised firing frequency of SS units in normal (black line/squares) and dn/dn (grey line circles) network models. E. Summary of vector strength of MNTB neurons in relation to contralateral stimulus intensity in normal (black line/squares) and dn/dn (grey line circles).
Table 1.
Constants used for the calculation of asynchronous release.
| Parameter | Normal | dn/dn |
|---|---|---|
| Psteady | 0.0005 | 0 |
| PMax | 0.2 | 0.6 |
| Tclearance (ms) | 10 | 70 |
Single compartment MNTB principal cell models for normal and dn/dn mice are detailed in Leao et al., (2005). In summary, single compartment MNTB cell models contained a Na+ conductance, a low and high-threshold K+ conductance, a hyperpolarisation-activated conductance and an unspecific leak conductance; respectively: and gL. In Leao et al. (2006b), low and high-threshold K+ currents are represented, respectively, by ITEA and IDTx while here, these currents are symbolised by IKh and IKl, respectively. Details of the calculation of evolution variables and constant values for normal and dn/dn mice are as in Leao et al., 2006b. Note there are two typos in Leao et al. (2006b) regarding the values of Vα and Vβ for the calculation of Ih (they should be 25.41 and 10, respectively) and Vc for ITEA (the correct value is 0.17). The large calyx of Held input to MNTB neurons was modelled according to the work of Graham et al. (2001) and there was no difference between the presynaptic terminal and postsynaptic currents between normal and deaf mice (Oleskevich et al., 2004).
The computational model for LSO neurons was based on the work of Zacksenhouse et al. (1998). We included an Ih and a low-threshold K+ current to account for the findings of Barnes-Davies et al. (2004), which describe a gradient of low-threshold K+-channels that are responsible for phenotypic differences along the tonotopic axis of the LSO. In that work, the authors showed that cells located in the lateral limb of the LSO respond to a long depolarising current with single APs (single spiking-SS) while cells in the medial limb respond with multiple APs (multiple-firing - MF) (Barnes-Davies et al., 2004). This difference is caused by a gradient in low-threshold K+-channels (Barnes-Davies et al., 2004). To simulate SS and MF phenotypes, the LSO somatic low-threshold K+ conductance was 20 mS/cm2 for SS and 2 mS/cm2 for MF. The calculations for other ionic currents (Na+, high-threshold K+) are shown in the original article from Zacksenhouse et al. (1998). In order to obtain a stable model, we have changed the computation of Ca2+ currents (ICa) using the equations shown in Amini et al. (1999):
| (5) |
s and r states are obtained by rate constants αs, βs and αr, βr:
| (6) |
| (7) |
| (8) |
| (9) |
| (10) |
where c = 1/2F (F is the Faraday constant: 96000 C/mol), τp is the time constant for the Ca2+ and ψ0 is the equilibrium concentration for the pump. LSO cells had the same properties in normal and in dn/dn mice. These cells received inhibitory inputs directly onto their soma and excitatory synapses onto the dendrites (Brunso-Bechtold et al., 1994; Cant, 1984; Helfert et al., 1992). Presynaptic APs for AVCN, MNTB and LSO were delayed according to the values in Yin (2002) (Fig. 9A). AVCN bushy cells received on their soma 2 large synaptic contacts (SBC) or 14 contacts (GBC). Auditory nerve inputs were simulated according to an electrically excited auditory nerve model (Rattay, 1997; Rattay and Aberham, 1993, 2001a, 2001b) and the effects of ipsilateral excitation/contralateral inhibition to the LSO neurons were assessed by using a 100 Hz bilateral input with ipsilateral Pi equal to 0.3 and contralateral Pi varying from 0.1 to 0.4. All model computation was based on room temperature measurements and was done in Matlab (Mathworks) using custom programs (which can be obtained upon request).
3. Results
3.1. Single spiking neurons are predominant in dn/dn LSO
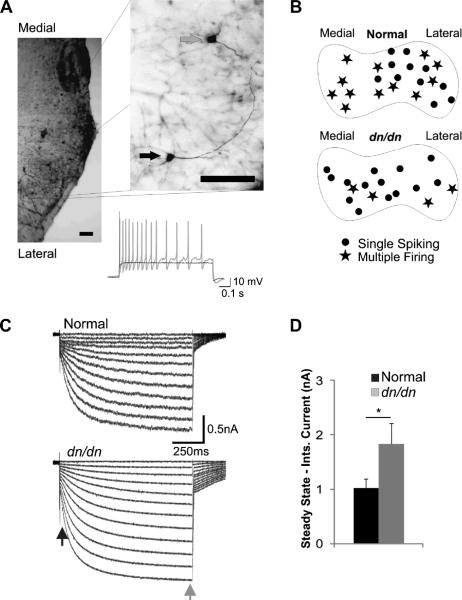
Current clamp recordings were performed in 41 cells from LSO slices of P13–P16 normal and dn/dn mice. Neurons were separated into 2 categories: single spiking (SS), when they respond with single action potentials (APs) to depolarising current steps and multiple-firing (MF), when neurons fire multiple APs in response to depolarising current steps (Fig. 1). In the LSO of normal mice the population of MF and SS neurons was similar (52.2% MF and 47.8% SS, n = 23). However, in dn/dn mice, the majority of neurons were SS (77.8% vs. 22.2% MF, n = 18) with a significantly different SS proportion to that in normal mice (p = 0.04 Z test). The input resistance of MF neurons of normal and dn/dn mice was not significantly different but SS neurons of normal mice had lower input resistances than SS neurons from dn/dn mice (respectively: 58 ± 2.1 MU and 71 ± 2.3 MΩ, p = 0.03 Z test). Whole cell capacitance did not differ significantly between SS or MF cells from normal and dn/dn mice.
Fig. 1.
Single spiking cells are predominant in the LSO of dn/dn mice. A. Examples of membrane potential recordings in response to a 250pA current step from the lateral (black trace) and medial (gray trace) LSO cells shown on the micrograph on the left (cells were filled with biotin; scale bar = 100 μm). B. Diagram representing the estimated recording site of LSO MF and SS cells in normal and dn/dn mice. C. Example of currents elicited by the application of voltage steps ranging from −60 mV to −115 mV. The black and grey arrows indicate where instantaneous (Inst.) and steady-state currents were measured, respectively. D. Summary of steady-state - Inst. currents measured in normal (black bar) and dn/dn (grey bar) LSO cells at −115 mV (* indicates p < 0.05).
3.2. Ih is larger in dn/dn mice LSO
One second long hyperpolarising voltage steps (−60 mV to 115 mV, in 5 mV steps) were used to investigate Ih in LSO neurons from normal and dn/dn mice (P14–P17). Examples of hyperpolarising activated currents are shown in Fig. 1C. Ih was estimated using the difference between instantaneous current (Inst.) and steady-state current. At −115 mV, Inst.-steady state (SS) currents were equal to 1.02 ± 0.17 nA in normal and 1.83 ± 0.38 nA in dn/dn mice, a statistically significant decrease (n = 10, p = 0.04, t test; Fig. 1C and D).
3.3. Glycinergic mIPSC frequency, amplitude and decay are unchanged in dn/dn mice
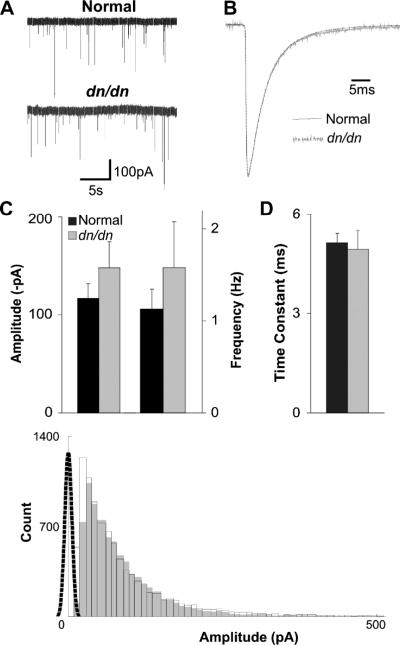
Glycinergic mIPSCs (isolated by the application of D-AP5, CNQX and BIC; in control cells addition of 1 μM STR abolished all glycinergic mIPSCs – data not shown) in the LSO of normal and dn/dn mice (P14–P17) showed no significant differences in either frequency or amplitude (Fig. 2). Average amplitudes (recorded at room temperature) of mIPSCs were −116.65 ± 14.9 pA normal in (n = 13) and −147.89 ± 26.38 pA in dn/dn mice (n = 10) (Fig.2A and C). Mean mIPSC frequency for normal mice was 1.13±0.22 Hz, and 1.58 ± 0.5 Hz for dn/dn mice; these values were not statistically different (p = 0.29 for amplitude and p = 0.39 for frequency, t test; Fig. 2A and C). mIPSC decay time constants were also similar between normal (5.13 ± 0.27 ms; n = 13) and dn/dn (4.93±0.58 ms; n = 10) mice (p = 0.74, t test; Fig. 2B and D). Fig. 2E shows a histogram of mIPSC amplitude distributions in normal and dn/dn mice. Although mean amplitudes between normal and dn/dn mice were not significantly different, a Kolmogorov–Smirnov test indicated that the mIPSC amplitude distributions for normal and dn/dn mice were drawn from different distributions. There was no correlation between mIPSC event half-width and amplitudes (data not shown).
Fig. 2.
Glycinergic mIPSC time constant and amplitude are similar in congenitally deaf and normal mice. A. Examples of glycinergic mIPSCs in LSO principal cells of normal mice (top) and deaf mice (bottom) recorded at room temperature. B. Average minis from a normal (black trace) and dn/dn mouse (grey trace) with normalised amplitudes. C. Amplitudes and frequencies of glycinergic mIPSCs in normal mice (black bars) and deaf mice (grey bars) (no significant difference). D. Decay time constants for glycinergic mIPSCs in normal (black bar) and deaf (grey bar) (no significant difference). E. Histogram (truncated at 500pA for clarity) of glycinergic mIPSC amplitude from normal mice (unfilled black bars) and deaf mice (filled grey bars), with noise distribution (black dotted line).
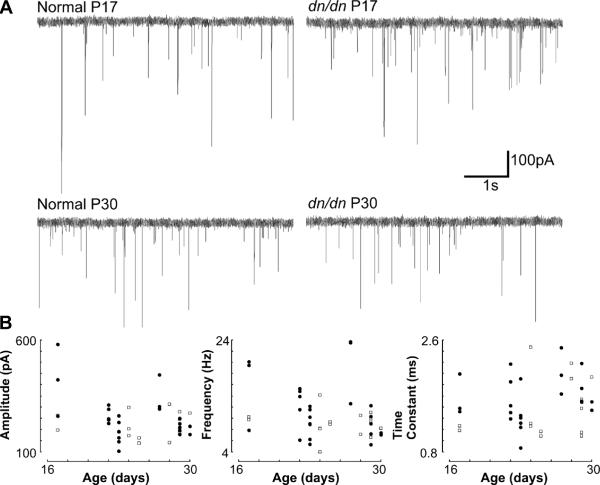
At 35 °C, we found no correlation between age (P17–P30) and mIPSC amplitude, frequency or decay time constant (Fig. 3). Mean mIPSC amplitude in normal and dn/dn mice (P17–P30) at 35 °C was equal to 219.73 ± 15.59 pA and 254.57 ± 20.46 pA, respectively (n = 39, not significant). Mean mIPSC decay time constant was equal to 1.50±0.12 ms in normal and 1.64±0.08 ms in dn/dn mice (n=39, not significant). mIPSC frequency was slightly higher in dn/dn mice (9.11±0.63 Hz in normal vs. 11.65±1.07 Hz in dn/dn mice; n = 39, p = 0.05, t test).
Fig. 3.
mIPSC amplitude and kinetics remain similar from the 2nd week of age. A. Raw voltage clamp traces showing mIPSCs of normal and dn/dn mice (P17 and P30). B. Relationship between animal age and mIPSC amplitude, frequency and decay time constant in normal (open squares) and dn/dn mice (closed circles).
3.4. Glycine is the predominant neurotransmitter in IPSCs of both normal and dn/dn mice
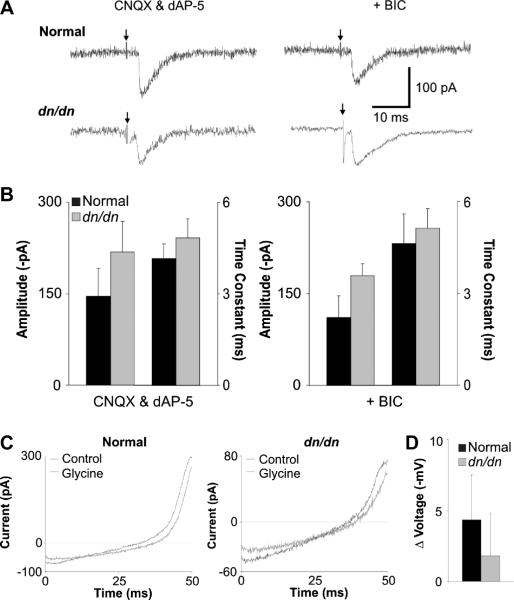
In order to uncover any GABAergic contribution to evoked IPSCs, we recorded both total evoked IPSCs (using CNQX and D-AP5), and isolated glycinergic IPSCs (recorded after the addition of BIC; example traces in Fig. 4A). IPSC amplitudes from normal and dn/dn mice (P14–P17) were not significantly different (respectively: 146.2±45.4 pA and 218.0±50.4 pA, p = 0.33, t test; n=8). After the application of BIC, isolated glycinergic currents were also not significantly different (respectively: 110.8±35.6 pA, p = 0.56 and 179.7±19.4 pA, p = 0.51, t test; Fig. 4B). IPSC decay time constants were also unaffected in dn/dn mice before (normal: 4.16±0.48 ms, dn/dn: 4.84 ± 0.64 ms) and after BIC addition (normal: 4.62±0.96 ms, p = 0.68 and dn/dn:5.13±0.64 ms, p= 0.76).Given there is no significant change between the mean IPSC amplitudes or decay time constants from normal and dn/dn mice, we find that MNTB afferents to the LSO are predominantly glycinergic by P13–P15 in both normal and dn/dn mice.
Fig. 4.
GABAergic inhibition is insignificant in LSO from both normal and dn/dn mice. A. Sample traces of normal (black traces) and dn/dn (grey traces) IPSCs evoked in the presence of CNQX and D-AP5 (left) and after the addition of BIC (right). Arrows indicate stimulus artefact. B. Mean IPSC amplitudes and decay time constants in the presence of CNQX and D-AP5 (left) and after the addition of BIC to the perfusate (right) (no significant difference). C. Sample traces from normal (left) and dn/dn LSO neurons in response to ramp protocols (from −80 mV to + 40 mV) before (black) and after (grey) the pressure-application of glycine. D. The shift in reversal from the ramp protocols caused by glycine application in normal (black) and dn/dn (grey) LSO neurons. In both cases, glycine is depolarising in only one cell tested.
In order to assess the effects of glycine on the membrane voltage of unperturbed neurons, we recorded voltage ramps (−80 to +40 mV) in on-cell configuration with a symmetrical potassium (150 mM) pipette solution. The recordings were then compared to those taken immediately after the pressure-application of 1 μm glycine in order to identify the polarity of the shift in membrane voltage (example traces for normal and dn/dn mice in Fig. 4C). In LSO neurons from normal mice, the responses were hyperpolarising in 6 out of 7 neurons (average −4.3±3.16 mV). In dn/dn mice, a hyperpolarising response to glycine application was seem in 5/6 neurons (average −1.8±3.02 mV), indicating that in these cells the shift from the immature, depolarising state to mature, hyperpolarising glycinergic transmission is developing normally (Fig. 4D).
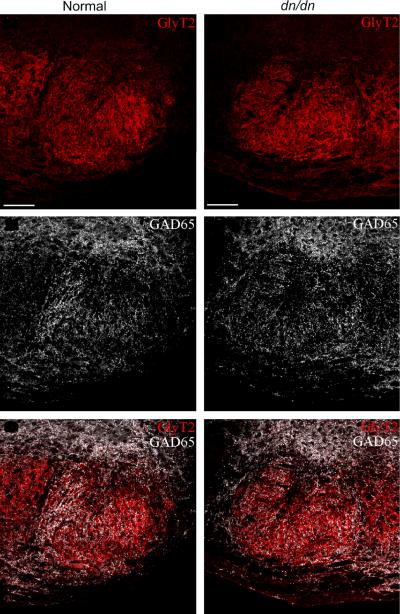
In agreement with the electrophysiological data, immunohistochemistry shows a weak labelling of the GABAergic neuron marker GAD67+ in LSO of both normal and dn/dn mice (Fig. 5).
Fig. 5.
Immunohistochemistry shows weak GAD67 staining in both normal and dn/dn mice.
3.5. Normal and deaf mice of show similar gephyrin cluster sizes
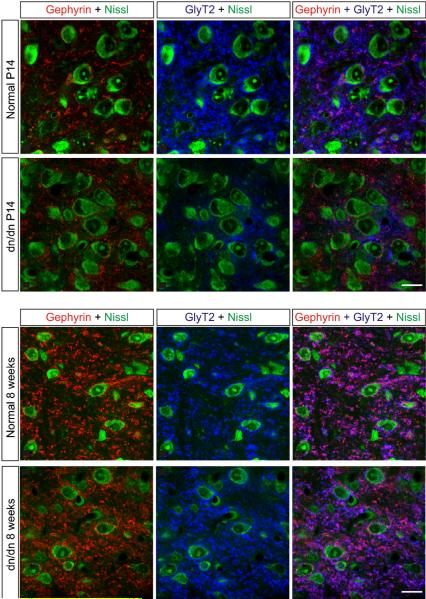
To assess possible morphological differences in inhibitory synaptic sites of normal and dn/dn mice, we performed immunolabelling of the inhibitory receptor clustering protein gephyrin (Leao et al., 2004a). As shown in Fig. 6, gephyrin-immunoreactive clusters were mostly located over the LSO cell somas of P14 normal and dn/dn mice. Nevertheless, at 8 weeks old, both groups expressed gephyrin clusters forming `tubular' structures suggesting dendritic expression. There was no difference in the number of clusters between P14 normal and dn/dn mice. In addition, no differences were found in the number of gephyrin clusters in 8 week old normal and dn/dn mice. Gephyrin cluster sizes were also similar between normal and dn/dn mice of similar ages (Supplementary Fig. 1). At 14 days of age, normal and dn/dn mice showed a mean cluster size of 0.15 ± 0.11 and 0.17 ± 0.12, respectively (n = 95 clusters, not significant). Eight week old normal and dn/dn mice, the average cluster size was equal to 0.23±0.08 and 0.22±0.11, respectively (n = 87 clusters, not significant).
Fig. 6.
Immunohistochemistry shows similar inhibitory synapses on LSO neurons from dn/dn and normal mice of similar ages (P14 or 8 weeks old). However, there is a noticeable increase in gephyrin clusters in both groups when compared P14 to 8 week old animals.
3.6. MNTB and AVCN model firing properties during EPSP trains
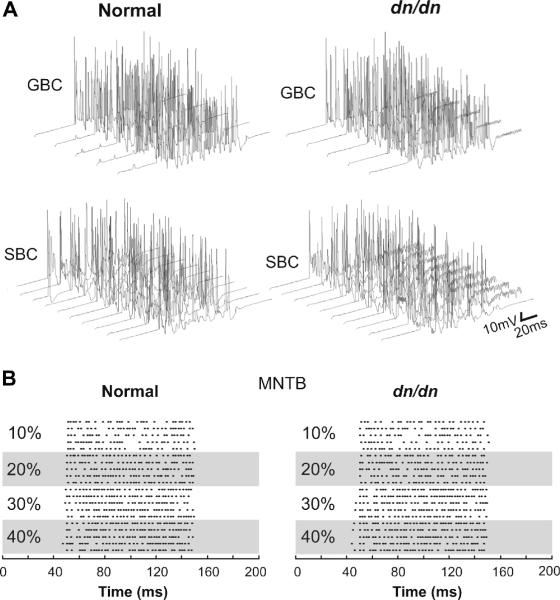
The AVCN bushy cells in normal and dn/dn mice show opposite changes in terms of pre and postsynaptic properties when compared with the MNTB. Postsynaptically, AVCN cells have similar membrane properties in normal and dn/dn mice (Leao et al., 2005). The presynaptic terminal, however, differs between normal and dn/dn mice (Oleskevich and Walmsley, 2002). Examples of the effects of increased depression and asynchronous release in the dn/dn bushy cell model are shown in Fig. 7A. At 100 Hz presynaptic stimulation, for example, both models were capable of faithfully following inputs. In some stimulus presentations, spontaneous APs were observed in the normal bushy cell model, but no AP preceding the EPSC train was observed in the dn/dn model (Figs. 7A and 8). After the EPSC train, the dn/dn AVCN model showed several spikes unrelated (asynchronous) to presynaptic inputs (Fig. 7A, right). MNTB cells, however, showed the expected increase in firing in response to increased contralateral AN stimulation in both normal and dn/dn MNTB model (Fig. 7B). Oleskevich et al., (2004) demonstrated that the calyceal terminals on MNTB cells are not significantly altered in dn/dn mice. We first tested our MNTB model simulating calyceal EPSP trains at 100 Hz, 200 Hz and 400 Hz (Fig. 8). At 100 Hz, model responses from normal and dn/dn principal cells were relatively similar (Fig. 8). The only difference of note was that the post-EPSC potential was around 10 mV more depolarised in the dn/dn mouse model when compared to the normal mouse model. At 200 Hz, post-EPSC potentials were also more negative in the normal mouse model than in dn/dn model.Also, after the EPSC train, dn/dn neurons showed rebound APs unrelated to EPSPs (Fig. 8). Both normal and dn/dn postsynaptic model cells were not capable of following 400 Hz inputs. Rebound APs were also observed after 400 Hz EPSPs in the dn/dn MNTB model (Fig. 8). Model LSO neurons responded by decreasing their firing rate with increasing contralateral inhibition in both normal (Fig. 9B and D) and dn/dn (Fig. 9C and D) mice. However, vector strength (VE) of MNTB inputs to the LSO model cells in relation to the intensity of inhibition (contralateral Pi) showed a greater correlation coefficient in the normal SOC model (r = 0.96, p = 0.02, n = 5) than in the dn/dn model (r = 0.80, p = 0.02, n = 5) (Fig. 9E). Also, the MNTB VE was significantly greater in the normal SOC model when contralateral Pi was equal to 0.4 (0.79±0.04 vs. 0.68±0.02; n = 10, p = 0.02, t test).
Fig. 7.
Modelled AVCN GBC and SBC and MNTB principal cell responses to a 1 kHz, 100 ms-long electrical stimulation of the auditory nerve. A. Top, 5 Contralateral GBC response to AN stimulation at 10% of the maximum stimulation amplitude. Bottom, 10 ipsilateral SBC response to AN stimulation at 30% of the maximal stimulation amplitude. B. Raster plots showing ipsilateral MNTB principal cell AP times in response to contralateral stimulation of the AN at various amplitudes
Fig. 8.
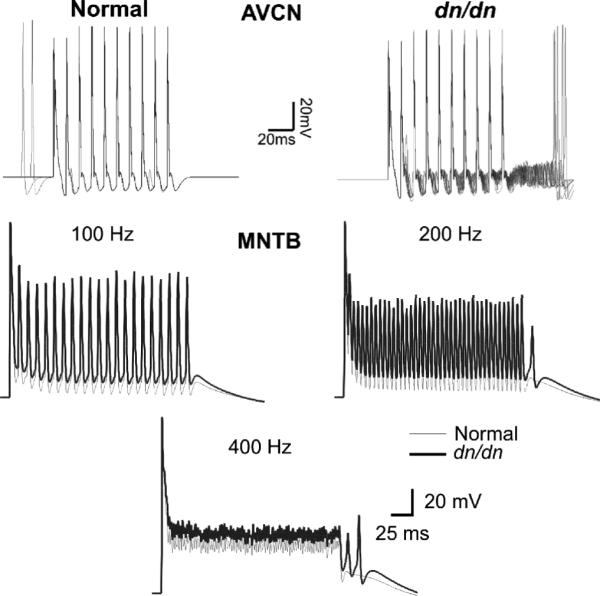
AVCN and MNTB model response to electrical stimulation. Top. Modelled AVCN bushy cells responses (5 normal and 5 dn/dn cells) to a 100 Hz stimulation of endbulbs of Held. Bottom. Modelled normal and dn/dn MNTB principal cell responses to a 100 Hz, 200 Hz and 400 Hz calyceal stimulation.
4. Discussion
Our previous work investigating the lack of auditory nerve activity has found a number of deficits in the development of auditory brainstem nuclei (Leao et al., 2004a, 2006b, 2006c; Oleskevich and Walmsley, 2002). In this study, we performed a detailed analysis of the electrophysiological properties of LSO principal neurons and glycinergic inhibition to the LSO in congenitally deaf (dn/dn) mice. In addition, we compiled the findings of our previous research and the results described here into simple Hodgkin and Huxley type models of the AVCN, MNTB and LSO.
Current clamp recordings have shown that in the LSO of dn/dn mice, there is a predominance of single-spiking neurons in both the lateral and medial half of the nucleus, while in normal mice there is an even proportion of single- and multiple-firing neurons. Barnes-Davies et al. (2004) have shown that, in rats, there is a topographic arrangement of SS and MF neurons (the latter predominantly found in medial LSO regions). In comparison to AVCN and MNTB neurons, LSO neurons have a substantially larger Ih current, probably due to a greater expression of HCN1 subunits (Leao et al., 2006a). We found that Ih is further increased in LSO neurons of dn/dn mice, where it prevents synaptic summation and produces rebound spiking (Leao et al., 2006a). Hence, it is likely that the mechanisms responsible for synaptic integration and rebound spiking are functional in LSO neurons from dn/dn mice, however, these animals lack the tonotopic refinement of firing phenotypes found in normal animals.
Our analysis of spontaneous mIPSCs demonstrated normal mean amplitudes, frequencies and kinetics of glycinergic currents in LSO neurons from dn/dn mice. The glycine receptor undergoes a developmental change during development with respect to its subunit composition and resulting electrophysiological properties. Receptors containing the foetal-type α2 pore-forming subunit show a smaller IPSC with slower kinetics than those containing the mature α1 pore-forming subunits (Awatramani et al., 2005). LSO neurons of dn/dn mice show relatively fast, large mIPSCs, indicating that the subunit switch of glycine receptors to the adult-type α1-containing form has likely occurred by P13–15, despite the lack of auditory nerve activity. These results are in contrast with our previous findings from the MNTB of dn/dn mice, where glycine receptors still show signs of immaturity after the second postnatal week (Leao et al., 2004b). Besides, differently from MNTB neurons that show a sharp increase in IPSC speed from P14 to P28 (Awatramani et al., 2005), mIPSC amplitude in LSO neurons and time constant do not seem to change during the between the second and fourth week of age (in both normal and dn/dn mice). In addition, the sharp distribution of mIPSCs and the lack of correlation between mIPSC amplitude and rise time is also an indicative of a predominantly perisomatic locus for glycinergic contacts.
The predominance of glycine over GABA as the main inhibitory neurotransmitter in the LSO is not altered in dn/dn mice. These results parallel previous findings in the MNTB of dn/dn mice in Leao et al. (Leao et al., 2004b). Inhibition in the mature LSO is mostly glycinergic (Wu and Kelly, 1995), developing in the first two postnatal weeks from an initially dominant GABAergic component in the immature animal (Kotak et al., 1998). The gradual replacement of GABAergic signalling with glycinergic input is important given the precise timing required in the auditory system. GABAergic currents show a fast component with a time constant of 8 ms and a slow component with a time constant of 65 ms that accounts for 27% of the peak current (Smith et al., 2000). In contrast, glycinergic currents by P20 have a fast component of approximately 2 ms that accounts for nearly 100% of the peak current, with a remaining slow component of approximately 20 ms (Awatramani et al., 2005). The significantly faster inhibitory postsynaptic currents (IPSCs) through glycine receptors provide the necessary accuracy in ILD and ITD pathways required after the onset of hearing at about P12–13 (Awatramani et al., 2005; Kamiya et al., 2001). Thus it appears that glycinergic inhibition to the LSO in dn/dn mice has developed normally in the absence of auditory nerve input. Our results are in agreement with Noh et al. (2010) that have shown that glycinergic transmission from the MNTB to the LSO develops normally in the otoferlin knockout mouse, which does not have auditory activity during development and is profoundly deaf (similar to dn/dn mice).
Interestingly, our immunohistochemistry experiments demonstrate that LSO principal cells of dn/dn mice, different from MNTB counterparts (Leao et al., 2004a), displayed a normal distribution and morphology of gephyrin clusters. These results suggest that inhibitory synapses develop normally despite the lack of acoustic-driven activity. As shown in Fig. 6, there is a large increase in the number and size of gephyrin from 2 to 8 weeks of age in both normal and dn/dn mice, indicating that, similarly to MNTB neurons, inhibitory synapses are still immature at P14 (Awatramani et al., 2005). Lim and colleagues have shown previously a correlation between gephyrin cluster size and the amplitude of miniature and evoked IPSCs, indicating that these currents could increase significantly as the animal ages. Nevertheless, in a previous work, we have shown dramatic differences in inhibitory synapses in the MNTB of dn/dn mice around P14 (Leao et al., 2004a) but surprisingly, inhibition arising from the MNTB seems to develop normally in these animals. In addition, we found a large variability in gephyrin cluster sizes that could be related to the (also) large variability in mIPSCs found in both groups.
Cell-attached experiments assaying the effects of glycine application indicate that in most dn/dn and normal LSO neurons, glycine is hyperpolarising by P13–15. Early in development, glycine responses are depolarising as a result of a high internal Cl− concentration, which has been found to decrease during maturation along with the depolarising effects of glycine (Ehrlich et al., 1999). The depolarising–hyperpolarising (D–H) shift of inhibitory neurotransmission is known to be reliant primarily upon the activity of KCC2, which establishes the outward chloride gradient necessary for inhibitory neurotransmission (Rivera et al., 2004). The D–H shift's reliance on the activity of KCC2 has been confirmed in human foetal neocortex (Vanhatalo et al., 2005) and our results suggest KCC2 function develops normally in the LSO of dn/dn mice.
Activity is an important regulator of protein expression and function, as well as synaptic strength and efficacy during the development of neuronal networks (Aguado et al., 2003; Boulanger and Poo, 1999; Hanson and Landmesser, 2004; Moody and Bosma, 2005; Rivera et al., 2004; Shibata et al., 2004; Vanhatalo et al., 2005; Walmsley et al., 2006). As shown in previous studies, congenital deafness leads to a mosaic of changes in different areas of the auditory brainstem. For example, MNTB neurons of dn/dn mice show decreased ILT but increased Ih. These differences dramatically change the firing properties of MNTB neurons and are therefore likely to result in functional impairment of the ILD network in which MNTB cells are involved. In order to elucidate basic aspects of the functionality of the AVCN/MNTB/LSO network in congenital deafness, we have implemented a neural network model that includes most of the changes in MNTB and AVCN bushy cells that have been documented in dn/dn mice. Specifically, in the dn/dn mice, modelled AVCN cells had normal postsynaptic membrane but altered properties in presynaptic endbulbs of Held. Our simulations also reproduced the basic features of LSO cells including the MF and SS phenotypes (Barnes-Davies et al., 2004), and the increased Ih found in dn/dn cells. Both MNTB principal cells and AVCN bushy cells of the dn/dn were able to follow high-frequency inputs. The decreased ILT in MNTB neurons of dn/dn mice caused the model cells to fire extra APs after single calyceal EPSCs. Additionally, the membrane voltage after an AP does not reach the same level of repolarisation in response to EPSC trains as in the normal mouse model. Bushy cells of the AVCN in the dn/dn model showed APs uncorrelated to the AN stimulation (due to synchronous release from endbulbs), and APs also occurred several milliseconds after the stimulus.
In the system presented here, ILT in the dn/dn LSO could prevent spike generation from spurious inputs, such as those caused by activity from bushy cells uncorrelated to AN activity resulting from presynaptic changes in the dn/dn AVCN or the altered ionic currents in the dn/dn MNTB. Therefore, a higher ILT would require coincident inputs to LSO SS cell dendrites to produce APs. Thus, inputs that were highly correlated to the AN stimulation and phase-locked to the stimuli are more likely to recruit a larger number of AVCN neurons in a well-timed fashion. This causes either excitation (when the amplitude to the ipsilateral AN is stronger) or inhibition (when the amplitude to the ipsilateral AN is weaker) to LSO cells to be more correlated to the AN stimulation. Interestingly, experimental data showed that there is a predominance of SS units in dn/dn mice LSO when compared to normal mice. The larger population of SS cells could, thus, contribute to the restoration of sound localisation functions in the electrically stimulated cochlea. In fact, bilateral cochlear implants offer a substantial benefit in sound localisation to late-implanted patients as well early-deafened/early-implanted patients (Nopp et al., 2004). However, this benefit is questionable in early-deafened, late-implanted patients (Nopp et al., 2004). This difference in spatial hearing performance could be attributed to neural degeneration of the sound localisation pathway. Another clinical finding in congenitally deaf patients (after bilateral cochlear implantation) is the greater ability to process ILD cues in comparison to ITD cues (van Hoesel and Tyler, 2003). These clinical findings agree our simulation results that show that SS cells, predominant in dn/dn mice LSO, have a greater sensitivity to ILD processing. However, precise timing, essential to ITD processing, could be disrupted in the auditory pathway of dn/dn mice.
The normal development of the inhibitory inputs to LSO neurons in dn/dn mice is surprising given the malformation of upstream nuclei (Leao et al., 2005, 2004a, 2004b, 2006c; Oleskevich and Walmsley, 2002, 2004; Walmsley et al., 2006). However, the resurgence of spontaneous activity at the level of the CN (Youssoufian et al., 2008) may activate compensatory mechanisms which may support normal development at this level. It is also important to note that this inhibitory input may not be entirely unaffected by profound deafness. Indeed, it is very possible given the breakdown of tonotopy in the MNTB (Leao et al., 2006c) that topography or synaptic convergence of inhibitory input to the LSO may be perturbed. Nonetheless, the apparent electrophysiological normality of inhibitory synaptic input to the LSO in dn/dn mice may have important implications for related forms of human profound congenital deafness (Kurima et al., 2002).
Supplementary Material
Acknowledgements
RNL is supported by a long-term fellowship from the International Human Frontier Science Program Organisation and a grant from the Kjell och Märta Beijers Foundation.
Footnotes
Appendix Supplementary data associated with this article can be found in online version at doi:10.1016/j.heares.2011.01.012.
References
- Aguado F, Carmona MA, Pozas E, Aguilo A, Martinez-Guijarro FJ, Alcantara S, Borrell V, Yuste R, Ibanez CF, Soriano E. BDNF regulates spontaneous correlated activity at early developmental stages by increasing synaptogenesis and expression of the K+/Cl− co-transporter KCC2. Development. 2003;130:1267–1280. doi: 10.1242/dev.00351. [DOI] [PubMed] [Google Scholar]
- Alvarez AJ, Dewey DE, Harrington DA, Fyffe REW. Cell-type specific organization of glycine receptor clusters in the mammalian spinal cord. J. Comp. Neurol. 1997;379:150–170. [PubMed] [Google Scholar]
- Amini B, Clark JW, Jr., Canavier CC. Calcium dynamics underlying pacemaker-like and burst firing oscillations in midbrain dopaminergic neurons: a computational study. J. Neurophysiol. 1999;82:2249–2261. doi: 10.1152/jn.1999.82.5.2249. [DOI] [PubMed] [Google Scholar]
- Awatramani GB, Turecek R, Trussell LO. Staggered development of GABAergic and glycinergic transmission in the MNTB. J. Neurophysiol. 2005;93:819–828. doi: 10.1152/jn.00798.2004. [DOI] [PubMed] [Google Scholar]
- Barnes-Davies M, Barker MC, Osmani F, Forsythe ID. Kv1 currents mediate a gradient of principal neuron excitability across the tonotopic axis in the rat lateral superior olive. Eur. J. Neurosci. 2004;19:325–333. doi: 10.1111/j.0953-816x.2003.03133.x. [DOI] [PubMed] [Google Scholar]
- Bock GR, Frank MP, Steel KP. Preservation of central auditory function in the deafness mouse. Brain Res. 1982;239:608–612. doi: 10.1016/0006-8993(82)90536-4. [DOI] [PubMed] [Google Scholar]
- Boulanger LM, Poo MM. Presynaptic depolarization facilitates neurotrophin-induced synaptic potentiation. Nat. Neurosci. 1999;2:346–351. doi: 10.1038/7258. [DOI] [PubMed] [Google Scholar]
- Brunso-Bechtold JK, Linville MC, Henkel CK. Terminal types on ipsilaterally and contralaterally projecting lateral superior olive cells. Hear Res. 1994;77:99–104. doi: 10.1016/0378-5955(94)90257-7. [DOI] [PubMed] [Google Scholar]
- Cant NB. The fine structure of the lateral superior olivary nucleus of the cat. J. Comp. Neurol. 1984;227:63–77. doi: 10.1002/cne.902270108. [DOI] [PubMed] [Google Scholar]
- Clements JD, Bekkers JM. Detection of spontaneous synaptic events with an optimally scaled template. Biophys. J. 1997;73:220–229. doi: 10.1016/S0006-3495(97)78062-7. [DOI] [PMC free article] [PubMed] [Google Scholar]
- Durham D, Rubel EW, Steel KP. Cochlear ablation in deafness mutant mice: 2-deoxyglucose analysis suggests no spontaneous activity of cochlear origin. Hear Res. 1989;43:39–46. doi: 10.1016/0378-5955(89)90057-9. [DOI] [PubMed] [Google Scholar]
- Ehrlich I, Lohrke S, Friauf E. Shift from depolarizing to hyperpolarizing glycine action in rat auditory neurones is due to age-dependent Cl− regulation. J. Physiol. 1999;520(Pt (1)):121–137. doi: 10.1111/j.1469-7793.1999.00121.x. [DOI] [PMC free article] [PubMed] [Google Scholar]
- Geiman EJ, Knox MC, Alvarez FJ. Postnatal maturation of gephyrin/glycine receptor clusters on developing Renshaw cells. J. Comp. Neurol. 2000;426:130–142. doi: 10.1002/1096-9861(20001009)426:1<130::aid-cne9>3.0.co;2-7. [DOI] [PubMed] [Google Scholar]
- Geiman EJ, Zheng W, Fritschy JM, Alvarez FJ. Glycine and GABA(A) receptor subunits on Renshaw cells: relationship with presynaptic neuro-transmitters and postsynaptic gephyrin clusters. J. Comp. Neurol. 2002;444:275–289. doi: 10.1002/cne.10148. [DOI] [PubMed] [Google Scholar]
- Graham BP, Wong AYC, Forsythe ID. A computational model of synaptic transmission at the calyx of Held. Neurocomputing. 2001;38–40:37–42. [Google Scholar]
- Hanson MG, Landmesser LT. Normal patterns of spontaneous activity are required for correct motor axon guidance and the expression of specific guidance molecules. Neuron. 2004;43:687–701. doi: 10.1016/j.neuron.2004.08.018. [DOI] [PubMed] [Google Scholar]
- Helfert RH, Juiz JM, Bledsoe SC, Jr., Bonneau JM, Wenthold RJ, Altschuler RA. Patterns of glutamate, glycine, and GABA immunolabeling in four synaptic terminal classes in the lateral superior olive of the guinea pig. J. Comp. Neurol. 1992;323:305–325. doi: 10.1002/cne.903230302. [DOI] [PubMed] [Google Scholar]
- Kamiya K, Takahashi K, Kitamura K, Momoi T, Yoshikawa Y. Mitosis and apoptosis in postnatal auditory system of the C3H/He strain. Brain Res. 2001;901:296–302. doi: 10.1016/s0006-8993(01)02300-9. [DOI] [PubMed] [Google Scholar]
- Kotak VC, Korada S, Schwartz IR, Sanes DH. A developmental shift from GABAergic to glycinergic transmission in the central auditory system. J. Neurosci. 1998;18:4646–4655. doi: 10.1523/JNEUROSCI.18-12-04646.1998. [DOI] [PMC free article] [PubMed] [Google Scholar]
- Kotak VC, Fujisawa S, Lee FA, Karthikeyan O, Aoki C, Sanes DH. Hearing loss raises excitability in the auditory cortex. J. Neurosci. 2005;25:3908–3918. doi: 10.1523/JNEUROSCI.5169-04.2005. [DOI] [PMC free article] [PubMed] [Google Scholar]
- Kurima K, Peters LM, Yang Y, Riazuddin S, Ahmed ZM, Naz S, Arnaud D, Drury S, Mo J, Makishima T, Ghosh M, Menon PS, Deshmukh D, Oddoux C, Ostrer H, Khan S, Deininger PL, Hampton LL, Sullivan SL, Battey JF, Jr., Keats BJ, Wilcox ER, Friedman TB, Griffith AJ. Dominant and recessive deafness caused by mutations of a novel gene, TMC1, required for cochlear hair-cell function. Nat. Genet. 2002;30:277–284. doi: 10.1038/ng842. [DOI] [PubMed] [Google Scholar]
- Leao RN, Leao FN, Walmsley B. Non-random nature of spontaneous mIPSCs in mouse auditory brainstem neurons revealed by recurrence quantification analysis. Proc. Biol. Sci. 2005;272(1580):2551–2559. doi: 10.1098/rspb.2005.3258. [DOI] [PMC free article] [PubMed] [Google Scholar]
- Leao KE, Leao RN, Sun H, Fyffe RE, Walmsley B. Hyperpolarization-activated currents are differentially expressed in mice brainstem auditory nuclei. J. Physiol. 2006a;576:849–864. doi: 10.1113/jphysiol.2006.114702. [DOI] [PMC free article] [PubMed] [Google Scholar]
- Leao RN, Berntson A, Forsythe ID, Walmsley B. Reduced low-voltage activated K+ conductances and enhanced central excitability in a congenitally deaf (dn/dn) mouse. J. Physiol. 2004a;559:25–33. doi: 10.1113/jphysiol.2004.067421. [DOI] [PMC free article] [PubMed] [Google Scholar]
- Leao RN, Naves MM, Leao KE, Walmsley B. Altered sodium currents in auditory neurons of congenitally deaf mice. Eur. J. Neurosci. 2006b;24:1137–1146. doi: 10.1111/j.1460-9568.2006.04982.x. [DOI] [PubMed] [Google Scholar]
- Leao RN, Oleskevich S, Sun H, Bautista M, Fyffe RE, Walmsley B. Differences in glycinergic mIPSCs in the auditory brain stem of normal and congenitally deaf neonatal mice. J. Neurophysiol. 2004b;91:1006–1012. doi: 10.1152/jn.00771.2003. [DOI] [PubMed] [Google Scholar]
- Leao RN, Sun H, Svahn K, Berntson A, Youssoufian M, Paolini AG, Fyffe RE, Walmsley B. Topographic organization in the auditory brainstem of juvenile mice is disrupted in congenital deafness. J. Physiol. 2006c;571:563–578. doi: 10.1113/jphysiol.2005.098780. [DOI] [PMC free article] [PubMed] [Google Scholar]
- Lim R, Alvarez FJ, Walmsley B. Quantal size is correlated with receptor cluster area at glycinergic synapses in the rat brainstem. J. Physiol. 1999;516:505–512. doi: 10.1111/j.1469-7793.1999.0505v.x. [DOI] [PMC free article] [PubMed] [Google Scholar]
- Marcotti W, Erven A, Johnson SL, Steel KP, Kros CJ. Tmc1 is necessary for normal functional maturation and survival of inner and outer hair cells in the mouse cochlea. J. Physiol. 2006;574:677–698. doi: 10.1113/jphysiol.2005.095661. [DOI] [PMC free article] [PubMed] [Google Scholar]
- Moody WJ, Bosma MM. Ion channel development, spontaneous activity, and activity-dependent development in nerve and muscle cells. Physiol. Rev. 2005;85:883–941. doi: 10.1152/physrev.00017.2004. [DOI] [PubMed] [Google Scholar]
- Noh J, Seal RP, Garver JA, Edwards RH, Kandler K. Glutamate co-release at GABA/glycinergic synapses is crucial for the refinement of an inhibitory map. Nat. Neurosci. 2010;13:232–238. doi: 10.1038/nn.2478. [DOI] [PMC free article] [PubMed] [Google Scholar]
- Nopp P, Schleich P, D'Haese P. Sound localization in bilateral users of MEDEL COMBI 40/40+ cochlear implants. Ear Hear. 2004;25:205–214. doi: 10.1097/01.aud.0000130793.20444.50. [DOI] [PubMed] [Google Scholar]
- Oleskevich S, Alvarez FJ, Walmsley B. Glycinergic miniature synaptic currents and receptor cluster sizes differ between spinal cord interneurons. J. Neurophysiol. 1999;82:312–319. doi: 10.1152/jn.1999.82.1.312. [DOI] [PubMed] [Google Scholar]
- Oleskevich S, Walmsley B. Synaptic transmission in the auditory brainstem of normal and congenitally deaf mice. J. Physiol. 2002;540:447–455. doi: 10.1113/jphysiol.2001.013821. [DOI] [PMC free article] [PubMed] [Google Scholar]
- Oleskevich S, Youssoufian M, Walmsley B. Presynaptic plasticity at two giant auditory synapses in normal and deaf mice. J. Physiol. 2004;560:709–719. doi: 10.1113/jphysiol.2004.066662. [DOI] [PMC free article] [PubMed] [Google Scholar]
- Otsu Y, Shahrezaei V, Li B, Raymond LA, Delaney KR, Murphy TH. Competition between phasic and asynchronous release for recovered synaptic vesicles at developing hippocampal autaptic synapses. J. Neurosci. 2004;24:420–433. doi: 10.1523/JNEUROSCI.4452-03.2004. [DOI] [PMC free article] [PubMed] [Google Scholar]
- Pujol R, Shnerson Lenoir, Deol MS. Early degeneration of sensory and ganglion cells in the inner ear of mice with uncomplicated genetic deafness (dn): preliminary observations. Hear. Res. 1983;12:57–63. doi: 10.1016/0378-5955(83)90118-1. [DOI] [PubMed] [Google Scholar]
- Rattay F. Simulation of the electrically stimulated auditory nerve. Artif. Organs. 1997;21:213–215. [PubMed] [Google Scholar]
- Rattay F, Aberham M. Modeling axon membranes for functional electrical stimulation. IEEE Trans. Biomed. Eng. 1993;40:1201–1209. doi: 10.1109/10.250575. [DOI] [PubMed] [Google Scholar]
- Rattay F, Leao RN, Felix H. A model of the electrically excited human cochlear neuron. II. Influence of the three-dimensional cochlear structure on neural excitability. Hear. Res. 2001a;153:64–79. doi: 10.1016/s0378-5955(00)00257-4. [DOI] [PubMed] [Google Scholar]
- Rattay F, Lutter P, Felix H. A model of the electrically excited human cochlear neuron. I. Contribution of neural substructures to the generation and propagation of spikes. Hear Res. 2001b;153:43–63. doi: 10.1016/s0378-5955(00)00256-2. [DOI] [PubMed] [Google Scholar]
- Rivera C, Voipio J, Thomas-Crusells J, Li H, Emri Z, Sipila S, Payne JA, Minichiello L, Saarma M, Kaila K. Mechanism of activity-dependent downregulation of the neuron-specific K-Cl cotransporter KCC2. J. Neurosci. 2004;24:4683–4691. doi: 10.1523/JNEUROSCI.5265-03.2004. [DOI] [PMC free article] [PubMed] [Google Scholar]
- Rothman JS, Young ED, Manis PB. Convergence of auditory nerve fibers onto bushy cells in the ventral cochlear nucleus: implications of a computational model. J. Neurophysiol. 1993;70:2562–2583. doi: 10.1152/jn.1993.70.6.2562. [DOI] [PubMed] [Google Scholar]
- Ryals BM, Rubel EW, Lippe W. Issues in neural plasticity as related to cochlear implants in children. Am. J. Otol. 1991;12(Suppl, 22–7):43–47. [PubMed] [Google Scholar]
- Shibata S, Kakazu Y, Okabe A, Fukuda A, Nabekura J. Experience-dependent changes in intracellular Cl− regulation in developing auditory neurons. Neurosci. Res. 2004;48:211–220. doi: 10.1016/j.neures.2003.10.011. [DOI] [PubMed] [Google Scholar]
- Smith AJ, Owens S, Forsythe ID. Characterisation of inhibitory and excitatory postsynaptic currents of the rat medial superior olive. J. Physiol. 2000;529(Pt (3)):681–698. doi: 10.1111/j.1469-7793.2000.00681.x. [DOI] [PMC free article] [PubMed] [Google Scholar]
- Steel KP, Bock GR. The nature of inherited deafness in deafness mice. Nature. 1980;288:159–161. doi: 10.1038/288159a0. [DOI] [PubMed] [Google Scholar]
- van Hoesel RJ, Tyler RS. Speech perception, localization, and lateralization with bilateral cochlear implants. J. Acoust. Soc. Am. 2003;113:1617–1630. doi: 10.1121/1.1539520. [DOI] [PubMed] [Google Scholar]
- Vanhatalo S, Palva JM, Andersson S, Rivera C, Voipio J, Kaila K. Slow endogenous activity transients and developmental expression of K+-Cl− cotransporter 2 in the immature human cortex. Eur. J. Neurosci. 2005;22:2799–2804. doi: 10.1111/j.1460-9568.2005.04459.x. [DOI] [PubMed] [Google Scholar]
- Verheugen JA, Fricker D, Miles R. Noninvasive measurements of the membrane potential and GABAergic action in hippocampal interneurons. J. Neurosci. 1999;19:2546–2555. doi: 10.1523/JNEUROSCI.19-07-02546.1999. [DOI] [PMC free article] [PubMed] [Google Scholar]
- Walmsley B, Berntson A, Leao RN, Fyffe RE. Activity-dependent regulation of synaptic strength and neuronal excitability in central auditory pathways. J. Physiol. 2006;572:313–321. doi: 10.1113/jphysiol.2006.104851. [DOI] [PMC free article] [PubMed] [Google Scholar]
- Wu SH, Kelly JB. Inhibition in the superior olivary complex: pharmacological evidence from mouse brain slice. J. Neurophysiol. 1995;73:256–269. doi: 10.1152/jn.1995.73.1.256. [DOI] [PubMed] [Google Scholar]
- Yang HM, Lin CY, Chen YJ, Wu JL. The auditory performance in children using cochlear implants: effects of mental function. Int J. Pediatr. Otorhinolaryngol. 2004;68:1185–1188. doi: 10.1016/j.ijporl.2004.04.011. [DOI] [PubMed] [Google Scholar]
- Yin TC. Neural mechanisms of encoding binaural localization cues in the auditory brainstem. In: Oertel D, Fay RR, Popper AN, editors. Integrative functions in the mammalian auditory pathway. 1 ed. Vol. 15. Springer; 2002. p. 431. [Google Scholar]
- Youssoufian M, Couchman K, Shivdasani MN, Paolini AG, Walmsley B. Maturation of auditory brainstem projections and calyces in the congenitally deaf (dn/dn) mouse. J. Comp. Neurol. 2008;506:442–451. doi: 10.1002/cne.21566. [DOI] [PubMed] [Google Scholar]
- Zacksenhouse M, Johnson DH, Williams J, Tsuchitani C. Single-neuron modeling of LSO unit responses. J. Neurophysiol. 1998;79:3098–3110. doi: 10.1152/jn.1998.79.6.3098. [DOI] [PubMed] [Google Scholar]
Associated Data
This section collects any data citations, data availability statements, or supplementary materials included in this article.


