

Abstract
The identification of important amino acid substitutions associated with low survival in hematopoietic cell transplantation (HCT) is hampered by the large number of observed substitutions compared to the small number of patients available for analysis. Random forest analysis is designed to address these limitations. We studied 2,107 HCT recipients with good or intermediate risk hematologic malignancies to identify HLA class I amino acid substitutions associated with reduced survival at day 100 post-transplant. Random forest analysis and traditional univariate and multivariate analyses were used. Random forest analysis identified amino acid substitutions in 33 positions that were associated with reduced 100 day survival, including HLA-A 9, 43, 62, 63, 76, 77, 95, 97, 114, 116, 152, 156, 166, and 167; HLA-B 97, 109, 116, and 156; and HLA-C 6, 9, 11, 14, 21, 66, 77, 80, 95, 97, 99, 116, 156, 163, and 173. Thirteen had been previously reported by other investigators using classical biostatistical approaches. Using the same dataset, traditional multivariate logistic regression identified only 5 amino acid substitutions associated with lower day 100 survival. Random forest analysis is a novel statistical methodology for analysis of HLA-mismatching and outcome studies, capable of identifying important amino acid substitutions missed by other methods.
Keywords: random forest analysis, HLA matching, amino acid substitutions, unrelated donor, hematopoietic cell transplantation
Introduction
Unrelated donor hematopoietic cell transplantation (HCT) is an established treatment option for patients with hematological malignancies who lack a human leukocyte antigen (HLA) identical sibling. Approximately 70% of unrelated donor transplants in 2009 facilitated by the U.S. National Marrow Donor Program (NMDP) used donors who were HLA-matched with the recipient; the other 30% had at least one HLA-mismatch. HLA mismatches are a major barrier to successful long-term outcome in HCT; even a single antigen or allele mismatch has a significant effect on graft survival and particularly on incidence and severity of graft-versus-host disease (GvHD) [1-5]. Although the molecular basis of allorecognition in GvHD and cellular graft rejection is not completely understood [6,7], isolated reports have shown that a single amino acid substitution between mismatched HLA alleles at a critical location can play an important role in acute GvHD [8] and graft rejection [9]. However, long-term survival after HCT is likely influenced not by a single mismatch but by multiple interacting mismatches as well as by patient and donor clinical characteristics and biological factors.
Mismatched antigens and alleles differ in the number, type and location of mismatched amino acids on the structure of the HLA molecule. Some substitutions may alter the peptide binding capability of the HLA molecule, while others may be irrelevant. It is likely that substitutions on the HLA molecules with altered peptide binding capacity that affect T-cell allorecognition underlie the varying clinical severity of GvHD and transplant outcomes associated with HLA-mismatched transplantation. Studies focused on identification of amino acid substitutions associated with adverse outcomes are scarce [10,11] and in conflict with functional studies [12,13]. Furthermore, these studies used traditional statistical techniques which have a limited ability to simultaneously analyze the effect of a large number of unordered categorical risk factors, side-chain variability at each amino acid position, and their potential interactions.
The purpose of this study was to identify HLA amino acid substitutions that are associated with lower survival at day 100 post-transplant (D100S) using a novel statistical methodology referred to as random forest analysis [14,15]. Random forest analysis is a computationally intensive method that uses a recursive partitioning algorithm to build individual prediction trees from randomly sampled subsets of data. It automatically accounts for interactions among a large number of potential predictors of HCT outcome [16]. Although random forest analysis has not been used to analyze HLA data in unrelated transplantation before, this type of analysis has been shown to be extremely powerful and robust in the analysis of datasets with a “large p and small n”, datasets where the number of predictor variables (p) is large, but the number of cases (n) is relatively small. In comparative analysis of discrimination methods for gene array expression data, it has consistently been shown to be superior or at least equivalent to other methods [17-19].
Methods
Patients
The study was based on a data set of 3,855 patient-donor pairs facilitated by the NMDP between 1988 and 2003. All surviving recipients included in this data set were retrospectively contacted and provided informed consent for participation in the NMDP research program. Approximately 4% of surviving patients would not provide consent for research. To adjust for the potential bias introduced by exclusion of non-consenting surviving patients, a sampling process randomly excluded appropriately the same percentage of deceased patients using a biased coin randomization with exclusion probabilities based on characteristics associated with not providing consent for use of the data in survivors [2]. The final study population consisted of 2,107 patients with good or intermediate risk hematologic malignancies who underwent allogeneic transplantation from HLA-matched or single HLA class I allele or antigen mismatched unrelated donors. Good risk was defined as acute myeloid leukemia (AML) and acute lymphoblastic leukemia (ALL) in first complete remission, chronic myeloid leukemia (CML) in first chronic phase, and myelodysplastic syndrome (MDS) subtype refractory anemia. Intermediate risk was defined as AML and ALL in second or subsequent complete remission or in first relapse, and CML in accelerated phase or second chronic phase. Patients with high risk disease were excluded from the analysis in order to better examine the relationship between amino acid substitutions and survival.
High-resolution HLA typing was performed for HLA-A, B, C, DRB1, DQA1, DQB1, DPA1, and DPB1 on all donor-recipient pairs as previously described [2]. However, in this study only HLA-A, B, C, and DRB1 were considered in the definition of HLA-matching based on the results of the Lee et al study [2].
To avoid confounding effects of HLA mismatches in the graft-versus-host and host-versus-graft directions, donors and recipients that were homozygous at an HLA class I locus (n=91) were excluded from analysis. Donor-recipient pairs with more than one mismatch in HLA-A, B, C and DRB1 or those mismatched at HLA-DRB1 were also excluded. There were 1,507 donor-recipient pairs who were matched at HLA-A, B, C, and DRB1 (referred to as the matched group) and 600 donor-recipient pairs with only one allele or antigen mismatch at HLA-A, B or C (referred to as the mismatched group). The frequency distribution of the 600 mismatched donor-recipient pairs at HLA-A, B, and C is 179 (29.8%), 88 (14.7%), and 333 (55.5%), respectively.
Data sources
The Center for International Blood and Marrow Transplant Research (CIBMTR) is a research affiliation of the International Bone Marrow Transplant Registry (IBMTR), Autologous Blood and Marrow Transplant Registry (ABMTR) and the NMDP established in 2004 that comprises a voluntary working group of more than 450 transplantation centers worldwide that contribute detailed data on consecutive allogeneic and autologous hematopoietic HCT to a Statistical Center at the Medical College of Wisconsin in Milwaukee and the NMDP Coordinating Center in Minneapolis. Participating centers are required to report all transplants consecutively; compliance is monitored by on-site audits. Patients are followed longitudinally, with yearly follow-up. Computerized checks for discrepancies, physicians' review of submitted data and on-site audits of participating centers ensure data quality. Observational studies conducted by the CIBMTR are performed in compliance with the Privacy Rule (HIPAA) as a Public Health Authority, and in compliance with all applicable federal regulations pertaining to the protection of human research participants as determined by continuous review of the Institutional Review Boards of the NMDP and the Medical College of Wisconsin since 1985.
Amino acid substitution assignment
Amino acid substitutions were assigned by comparing the amino acid sequences of the mismatched alleles carried by the donor and the recipient using the International Immunogenetics Project, IMGT/HLA database, http://www.ebi.ac.uk/imgt/hla, accessed on July 2007. Polymorphic amino acid positions were identified by position number and type. The observed mismatches between patient and donor were recorded by position number and the two different amino acids. The majority (∼80%) of the HLA alleles in the IMGT HLA database are defined based on partial sequence where a portion of the exonic nucleotides are not described. For this study we restricted the analysis to exons 2-3 for class I alleles and exon 2 for class II alleles where the majority of the alleles are fully characterized. To address the few instances where the reference sequence definition is incomplete within these exons we used a simple imputation method to fill-in the sequence with that of the most similar fully characterized allele. The similarity measure used was hamming distance or the minimum number of nucleotide differences.
Statistical analyses
Random Forest analysis
Random forest analysis was used to identify amino acid substitutions associated with the primary endpoint of survival to day 100, accounting for clinical and transplant characteristics and other simultaneous amino acid substitutions present. Because random forest analysis has not been used before in HCT studies, we provide a brief description of the method and its functional properties.
Random forest is a tree-based method for classification developed by Leo Breiman [14] that uses an ensemble of classification or decision trees. Using a recursive partitioning algorithm each classification tree is built based on a bootstrap sample of the training data. Some records will be included more than once in the sample, and others will not appear at all. Generally, about two thirds of the records will be included in each bootstrap sample of the training dataset, and one third will be left out. The left out records are used to provide an ongoing dynamic assessment of model performance, similar to repeated cross-validation. In addition, a random subset of the available predictor variables is used to determine the best partition of the data at each node of each individual tree building process. This doubly random process produces a collection of substantially different trees. Together, the resulting decision trees form the forest that represents the final ensemble tree model where each decision tree votes for the result and the majority wins.
In contrast to traditional multivariate modeling, the random forest analysis can account for inter-relationships among all potential predictors including highly multilevel unordered categorical covariates in building a tree-based predictive model. Unlike traditional univariate and multivariate logistic regression analysis, random forest analysis has the capability to analyze large training datasets with hundreds or even thousands of input variables. The two-part randomness (random subset of patients, random subset of variables) employed by the random forest method has been shown to deliver considerable robustness to noise, outliers, and over-fitting, when compared to a single tree classifier. Random forest analysis was carried out using the random forest software, version 1.0 (Salford Systems, San Diego, CA).
Four patient-donor clinical characteristics (age, disease type, disease status, donor-recipient gender match) identified as associated with day 100 survival in preliminary analyses and 127 amino acid substitution position variables at HLA-A, B, or C constituted the set of eligible predictors in the random forest analysis. We built a random forest model based on a collection of 500 classification trees with each individual tree built from a bootstrap sample of the original 2,107 donor-patient pairs. At each tree node (except the terminal nodes) of growing a tree a set of 15 predictors randomly selected from the total 131 predictors was used to determine the best split of the node. Results for each potential variable are expressed as a 0-100 ranking of variable importance, with higher scores indicating greater predictive ability. In contrast to traditional univariate and multivariate modeling, confidence intervals and p values are not available.
Traditional Univariate and Multivariate analysis
Traditional univariate and multivariate analyses were performed in order to compare the results obtained by the random forest analysis with those obtained from a more common statistical approach using the same data set. For the univariate approach, each mismatched type by position subgroup was compared to the HLA-matched group using a binary indicator variable in multiple logistic regression model with adjustment for patient risk factors. Because of multiple testing, indicator variables with a more stringent p value of 0.005 or less were considered as statistically significant, indicating that the death rate by day 100 of the specific mismatched type by position subgroup is different from that of the matched group.
For the traditional multivariate logistic regression model, the potential differential effects of substitution type were ignored and the model tested the effect of any amino acid substitution within each position (mismatch versus match regardless of type). An initial screening was conducted by testing the effect of each amino acid substitution position separately at 5% significance level in a logistic regression model with adjustment for the significant patient risk factors (age, disease type, disease stage, and donor-recipient gender match). Then, based on the amino acid substitution position variables that were significant in the initial screening a final model was built using a forward stepwise regression procedure with a 5% significance level as the variable entry or deletion criterion. This final model allowed for an identification of interactive effect among multiple amino acid substitution positions but could not evaluate types of substitutions or their interactions because the model cannot accommodate the large number of indicator variables necessary to code all possible substitution types and their interactions among combinations of substitution positions.
Results
Patient characteristics
Patient characteristics are summarized in Table 1 for the HLA-mismatched and matched groups respectively. There were significant differences between the groups with respect to age, disease type, disease stage, conditioning regimen, and GvHD prophylaxis at the 5% significance level. However, after Bonferroni adjustment for multiple comparisons to reduce the possibility of false positive results only age and disease stage remained significant at the 5% level. The day 100 survival was 79% for the HLA-matched group and 69% for the HLA-mismatched group, p<0.001.
Table 1. Patient characteristics by HLA matching status.
| 1 HLA Class I Mismatch DRB1Matched (n=6001) |
A, B, C, DRB1 Matched (n=1,507) |
p-Values | |
|---|---|---|---|
| Age at Transplant | |||
| Mean (SD) | 29.7 (15.2) | 32.6 (14.2) | <0.001 |
| Sex Donor/Recipient2 | 0.36 | ||
| Male/Male | 207 (34.5) | 572 (38.0) | |
| Female/Male | 119 (19.8) | 276 (18.3) | |
| Female/Female | 129 (21.5) | 288 (19.1) | |
| Male/Female | 145 (24.2) | 371 (24.6) | |
| Disease2 | 0.03 | ||
| ALL | 155 (25.8) | 352 (23.4) | |
| AML | 172 (28.7) | 370 (24.6) | |
| CML | 256 (42.7) | 717 (47.6) | |
| MDS | 17 (2.8) | 68 (4.5) | |
| Stage of Disease at Transplant2 | 0.001 | ||
| Early | 282 (47.0) | 834 (55.3) | |
| Intermediate | 318 (53.0) | 673 (44.7) | |
| Conditioning Regimen2 | 0.03 | ||
| Myeloablative | 591 (98.5) | 1499 (99.5) | |
| Non-myeloablative | 9 (1.5) | 8 (0.5) | |
| GvHD Prophylaxis2 | 0.01 | ||
| Tacrolimus ± Other | 121 (20.2) | 298 (19.8) | |
| Cyclosporine A+ | |||
| Methotrexate ± Other | 324 (54.0) | 890 (59.1) | |
| Cyclosporine A ± Other3 | 13 (2.2) | 57 (3.8) | |
| Methotrexate ± Other4 | 5 (0.8) | 7 (0.5) | |
| T-Cell Depletion | 137 (22.8) | 254 (16.9) | |
| Other | 0 (0.0) | 1 (0.1) | |
| Stem Cell Source2 | 0.91 | ||
| Bone Marrow | 559 (93.2) | 1402 (93.0) | |
| PBSC5 | 41 (6.8) | 105 (7.0) | |
| Year of Transplant2 | 0.25 | ||
| 1988 – 1992 | 65 (10.8) | 212 (14.1) | |
| 1993 – 1996 | 174 (29.0) | 410 (27.2) | |
| 1997 – 2000 | 241 (40.2) | 597 (39.6) | |
| 2001 – 2004 | 120 (20.0) | 288 (19.1) |
Donor/Recipients with one mismatch at HLA-A: n=179 (29.8%), with one mismatch at HLA-B: n=88 (14.7%), with one mismatch at HLA-C: n=333 (55.5%);
n (%);
no methotrexate;
no cyclosporine A;
peripheral blood stem cells
Distribution of amino acid substitutions positions and types
From the 600 donor-recipient pairs that had one HLA-A, B, or C amino acid mismatch and were DRB1 matched, 371 had antigen mismatches and 229 had allele mismatches as defined by the NMDP [2]. HLA-A, B, and C sequences each had up to a total length of 181 amino acids. Amino acid substitutions were identified in 50 positions in HLA-A, 44 positions in HLA-B, and 33 positions in HLA-C, for a total of 127 mismatched amino acid positions. Most mismatched positions have multiple mismatch types, hence a total of 389 amino acid substitutions were identified for the 127 positions (an average of 3.1 types per amino acid substitution position), Table 2.
Table 2. Distribution of amino acid substitution positions and types.
| HLA-A | HLA-B | HLA-C | TOTAL | |
|---|---|---|---|---|
| Number of amino acid positions affected by substitutions | 50 | 44 | 33 | 127 |
| Number of amino acid substitution types1 | 170 | 104 | 115 | 389 |
Most amino acid substitution positions have multiple substitution types
Amino-acid substitutions identified by the random forest analysis
Four patient variables (age, disease stage, disease type, gender match) and 33 amino-acid substitutions out of 127 amino acid substitutions were assigned an importance score of 2.9 or higher (in a scale of 0 to 100) by random forest analysis and identified as predictors of death at day 100 post-transplant, Table 3. A cut-off value of 2.9 for the importance score on a scale of 0 to 100, was established to include the most important overlapping amino acid substitutions across the different HLA class I loci. The criteria used for selection of the most important positions was to include all 13 previously identified amino-acid substitutions as well as any new position (n=20) with an importance score higher than a previously identified position. Amino acid substitutions using this definition were: HLA-A 9, 43, 62, 63, 76, 77, 95, 97, 114, 116, 152, 156, 166, and 167; HLA-B 97, 109, 116 and 156; and HLA-C 6, 9, 11, 14, 21, 66, 77, 80, 95, 97, 99, 116, 156, 163, and 173, Figure 1. Table 3 shows a ranking of these amino acid substitutions by the strength of the importance score received on random forest analysis, and also summarizes previous reports in the literature.
Table 3. Amino-acid substitutions and other predictors of day 100 survival obtained by random forest analysis listed in order of importance.
| Variable | HLA Molecule Alpha Domain | Importance Score | Other References Reporting Amino Acid Substitutions Associated to HCT Outcomes |
|---|---|---|---|
| Age | — | 100 | |
| Disease stage | — | 50 | |
| HLA-C position 156 | 2 | 36 |
Kawase, 200925 Kawase, 200711 |
| HLA-C position 116 | 2 | 35 |
Kawase, 2007 Ferrara, 200110 |
| HLA-A position 152 | 2 | 31 | Ferrara, 2001 |
| HLA-C position 99 | 2 | 24 |
Kawase, 2009 Kawase, 2007 |
| HLA-A position 9 | 1 | 21 |
Kawase, 2009 Kawase, 2007 |
| HLA-C position 9 | 1 | 20 | Kawase, 2007 |
| HLA-B position 116 | 2 | 20 | Ferrara, 2001 |
| Disease type | - | 20 | |
| Gender match | - | 19 | |
| HLA-A position 156 | 2 | 17 | Ferrara, 2001 |
| HLA-C position 97 | 2 | 13 | |
| HLA-A position 114 | 2 | 13 | Ferrara, 2001 |
| HLA-A position 62 | 1 | 13 | |
| HLA-C position 163 | 2 | 12 | |
| HLA-A position 95 | 2 | 9 | |
| HLA-C position 11 | 1 | 9 | |
| HLA-A position 97 | 2 | 7 | |
| H LA-B position 97 | 2 | 6 | |
| HLA-C position 80 | 1 | 6 | Kawase, 2007 |
| HLA-A position 76 | 1 | 6 | |
| HLA-A position 63 | 1 | 5 | |
| HLA-C position 77 | 1 | 5 | Kawase, 2007 |
| HLA-A position 77 | 1 | 5 | |
| HLA-C position 21 | 1 | 4 | |
| HLA-C position 95 | 2 | 4 | |
| HLA-A position 116 | 2 | 4 |
Kawase, 2007 Ferrara, 2001 |
| HLA-C position 14 | 1 | 4 | |
| HLA-A position 167 | 2 | 4 | |
| HLA-A position 43 | 1 | 4 | |
| HLA-C position 6 | 1 | 4 | |
| HLA-B positon 109 | 2 | 3 | |
| HLA-C position 173 | 2 | 3 | |
| HLA-C position 66 | 1 | 3 | |
| HLA-A position 166 | 2 | 3 | |
| HLA-B position 156 | 2 | 3 |
Ferrara, 2001 Burrows, 199424 Keever, 19948 Fleischhauer, 19909 |
The positions with higher importance scores are more critically related to death by day 100 post-HCT and should receive higher priority to be matched.
Figure 1. Representative HLA molecules with non-permissive amino acid substitutions identified using random forest analysis.
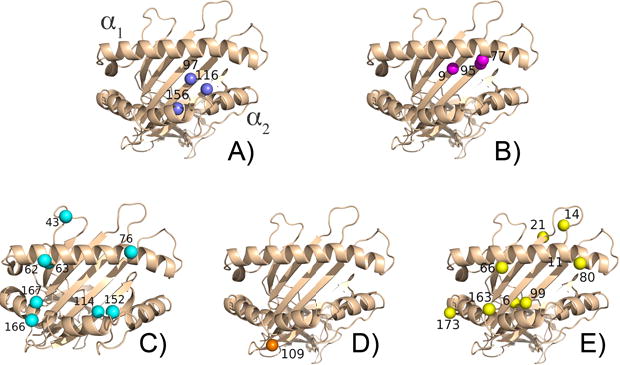
The residues are colored by mismatch groupings. (A) HLA-A, B, and C positions 97, 116, and 156. (B) HLA-A and C positions 9, 77, and 95. (C) HLA-A 43, 62, 63, 76, 114, 152, 166, and 167. (D) HLA-B position 109. (E) HLA-C positions 6, 11, 14, 21, 66, 80, 99, 163, and 173. The mismatches are found on the alpha 1 and alpha 2 domains, with the majority occurring in the peptide binding groove.
Most frequent HLA class I mismatches accounting for amino acid substitutions exhibiting the highest importance scores
The most frequent HLA class I mismatches for each of the 33 amino acid substitutions identified by random forest with high importance scores and their frequencies are listed in Table 4. Table 5 shows the most common HLA class I mismatches for each locus that correspond to the amino acid substitutions with high importance scores. The most common HLA mismatches in relation with these amino acids for each class I locus are HLA-A*02:01/02:05, HLA-B*35:01/35:03, and HLA-C*01:02/02:02, Table 5. The percentages were calculated based on all mismatches at a particular locus as the denominator. Only HLA mismatches with a frequency of 10 or higher were included. However, if no HLA mismatches with a frequency of 10 or higher were available, the highest available frequency was included in the table.
Table 4. Most frequent HLA class I mismatches accounting for amino acid substitutions exhibiting the highest importance scores.
| Amino Acid Substitution | Importance Score | HLA Mismatch | Frequency | Percent | Cumulative Percent |
|---|---|---|---|---|---|
| C156 | 36.21 | 01:02/02:02 | 25 | 7.51 | 7.51 |
| 04:01/16:01 | 19 | 5.71 | 13.21 | ||
| 05:01/07:04 | 16 | 4.80 | 18.02 | ||
| 14:02/15:02 | 16 | 4.80 | 22.82 | ||
| 03:03/04:01 | 14 | 4.20 | 27.03 | ||
| 07:01/12:03 | 11 | 3.30 | 30.33 | ||
| 06:02/07:01 | 10 | 3.00 | 33.33 | ||
| C116 | 34.75 | 01:02/02:02 | 25 | 7.51 | 7.51 |
| 04:01/16:01 | 19 | 5.71 | 13.21 | ||
| 14:02/15:02 | 16 | 4.80 | 18.02 | ||
| 03:03/04:01 | 14 | 4.20 | 22.22 | ||
| A152 | 31.19 | 03:01/03:02 | 12 | 6.70 | 6.70 |
| C99 | 23.59 | 01:02/02:02 | 25 | 7.51 | 7.51 |
| 04:01/16:01 | 19 | 5.71 | 13.21 | ||
| 14:02/15:02 | 16 | 4.80 | 18.02 | ||
| 03:03/04:01 | 14 | 4.20 | 22.22 | ||
| A9 | 21.29 | 02:01/02:05 | 14 | 7.82 | 7.82 |
| 02:01/02:06 | 12 | 6.70 | 14.53 | ||
| C9 | 20.39 | 01:02/02:02 | 25 | 7.51 | 7.51 |
| 04:01/16:01 | 19 | 5.71 | 13.21 | ||
| 05:01/07:04 | 16 | 4.80 | 18.02 | ||
| 14:02/15:02 | 16 | 4.80 | 22.82 | ||
| 03:03/04:01 | 14 | 4.20 | 27.03 | ||
| 07:01/12:03 | 11 | 3.30 | 30.33 | ||
| B116 | 20.38 | 35:01/35:03 | 17 | 19.32 | 19.32 |
| A156 | 17.44 | 02:01/02:05 | 14 | 7.82 | 7.82 |
| 03:01/03:02 | 12 | 6.70 | 14.53 | ||
| C97 | 13.49 | 01:02/02:02 | 25 | 7.51 | 7.51 |
| 04:01/16:01 | 19 | 5.71 | 13.21 | ||
| 14:02/15:02 | 16 | 4.80 | 18.02 | ||
| 07:01/12:03 | 11 | 3.30 | 21.32 | ||
| 06:02/07:01 | 10 | 3.00 | 24.32 | ||
| A114 | 13.07 | 02:01/68:01 | 7 | 3.91 | 3.91 |
| A62 | 13.00 | 02:01/68:01 | 7 | 3.91 | 3.91 |
| C163 | 12.18 | 01:02/02:02 | 25 | 7.51 | 7.51 |
| 03:03/04:01 | 14 | 4.20 | 11.71 | ||
| A95 | 9.20 | 02:01/02:05 | 14 | 7.82 | 7.82 |
| C11 | 8.99 | 01:02/02:02 | 25 | 7.51 | 7.51 |
| 04:01/16:01 | 19 | 5.71 | 13.21 | ||
| 14:02/15:02 | 16 | 4.80 | 18.02 | ||
| 03:03/04:01 | 14 | 4.20 | 22.22 | ||
| A97 | 6.90 | 02:01/68:01 | 7 | 3.91 | 3.91 |
| B97 | 6.24 | 39:01/39:06 | 4 | 17.39 | 17.39 |
| C80 | 6.07 | 01:02/02:02 | 25 | 7.51 | 7.51 |
| 04:01/16:01 | 19 | 5.71 | 13.21 | ||
| 05:01/07:04 | 16 | 4.80 | 18.02 | ||
| 14:02/15:02 | 16 | 4.80 | 22.82 | ||
| 03:03/04:01 | 14 | 4.20 | 27.03 | ||
| 06:02/07:01 | 10 | 3.00 | 30.33 | ||
| A76 | 5.88 | 01:01/11:01 | 7 | 3.91 | 3.91 |
| A63 | 5.09 | 02:01/68:01 | 7 | 3.91 | 3.91 |
| C77 | 4.85 | 01:02/02:02 | 25 | 13.16 | 13.16 |
| 04:01/16:01 | 19 | 10.00 | 23.16 | ||
| 05:01/07:04 | 16 | 8.42 | 31.58 | ||
| 14:02/15:02 | 16 | 8.42 | 40.00 | ||
| 03:03/04:01 | 14 | 7.37 | 47.37 | ||
| 06:02/07:01 | 10 | 5.26 | 52.63 | ||
| A77 | 4.66 | 01:01/11:01 | 7 | 3.91 | 3.91 |
| C21 | 4.33 | 01:02/02:02 | 25 | 7.51 | 7.51 |
| 14:02/15:02 | 16 | 4.80 | 12.31 | ||
| 03:03/04:01 | 14 | 4.20 | 16.52 | ||
| C95 | 4.06 | 05:01/07:04 | 16 | 4.80 | 4.80 |
| 14:02/15:02 | 16 | 4.80 | 9.61 | ||
| 03:03/04:01 | 14 | 4.20 | 13.81 | ||
| A116 | 3.99 | 02:01/68:01 | 7 | 3.91 | 3.91 |
| C14 | 3.89 | 04:01/16:01 | 19 | 31.15 | 31.15 |
| 03:03/04:01 | 14 | 22.95 | 22.95 | ||
| A167 | 3.78 | 01:01/11:01 | 7 | 3.91 | 3.91 |
| 24:02/24:03 | 7 | 3.91 | 7.82 | ||
| A43 | 3.70 | 02:01/02:05 | 14 | 7.82 | 7.82 |
| C6 | 3.58 | 01:02/02:02 | 25 | 48.08 | 48.08 |
| B109 | 3.47 | 35:01/35:02 | 3 | 37.50 | 37.50 |
| 35:02/35:03 | 3 | 37.50 | 75.00 | ||
| C173 | 3.42 | 03:03/04:01 | 14 | 20.90 | 20.90 |
| C66 | 3.40 | 14:02/15:02 | 16 | 18.18 | 18.18 |
| 07:01/12:03 | 11 | 12.50 | 30.68 | ||
| 06:02/07:01 | 10 | 11.36 | 42.05 | ||
| A166 | 3.05 | 01:01/11:01 | 7 | 3.91 | 3.91 |
| 24:02/24:03 | 7 | 3.91 | 7.82 | ||
| B156 | 2.87 | 35:01/35:08 | 7 | 7.95 | 7.95 |
Table 5. Most common HLA class I mismatches for each locus in relation with the amino acid substitutions with the highest importance scores.
| HLA Locus | HLA Mismatch | Cumulative Frequency | Cumulative Percent |
|---|---|---|---|
| HLA-A | 02:01/02:05 | 14 | 7.82 |
| 02:01/02:06 | 26 | 14.53 | |
| 03:01/03:02 | 38 | 21.23 | |
| 01:01/11:01 | 45 | 25.14 | |
| 02:01/68:01 | 52 | 29.05 | |
| 24:02/24:03 | 59 | 32.96 | |
| HLA-B | 35:01/35:03 | 17 | 19.32 |
| 35:01/35:08 | 24 | 27.27 | |
| HLA-C | 01:02/02:02 | 25 | 7.51 |
| 04:01/16:01 | 44 | 13.21 | |
| 05:01/07:04 | 60 | 18.02 | |
| 14:02/15:02 | 76 | 22.82 | |
| 03:03/04:01 | 90 | 27.03 | |
| 07:01/12:03 | 101 | 30.33 | |
| 06:02/07:01 | 111 | 33.33 | |
| 01:02/03:03 | 119 | 35.74 | |
| 01:02/15:02 | 127 | 38.14 | |
| 03:04/07:02 | 135 | 40.54 | |
| 02:02/15:02 | 142 | 42.64 |
Traditional univariate analysis of amino acid substitutions adjusting for clinical variables
Table 6 lists all 13 amino acid substitution subgroups with greater than 10 patients and with significantly greater death rates by day 100 (p<0.005 in two-sided test) as compared with the HLA-matched group (1,507 donor-recipient pairs) in univariate analysis adjusting for clinical variables. For the HLA-A mismatched group, only 1 amino-acid substitution position and type, 156-L:W (recipient: donor), was identified. No amino-acid substitutions associated with worse outcome were identified for the HLA-B mismatched group. This may be due in part to the fact that there are only 88 (14.7%) HLA-mismatched donor-recipient pairs with HLA-B mismatches. Twelve amino-acid substitutions were identified in the HLA-C mismatched group. A total of 7 different amino-acid substitutions are on the alpha 1 domain, in 7 different positions and 5 amino-acid substitutions are located on the alpha 2 domain, in 4 different positions.
Table 6. Effect of HLA-A, B or C mismatched amino acid substitution type by position on day 100 survival adjusted for patient characteristics using multiple logistic regression.
| HLA Locus | Alpha Domain | PPosition | AAmino Acid TType (R/D1) | n | Death by Day 100 (%Death) | p Value2 | Odds Ratio (95% CI) |
|---|---|---|---|---|---|---|---|
| A | 2 | 156 | LW | 12 | 58 | 0.001 | 6.01 (1.80-20.07) |
| C | 1 | 9 | FY | 27 | 48 | 0.002 | 3.34 (1.51-7.37) |
| C | 1 | 11 | SA | 69 | 43 | < 0.001 | 2.98 (1.80-4.95) |
| C | 1 | 14 | WR | 37 | 40 | 0.002 | 2.88 (1.45-5.73) |
| C | 1 | 21 | RH | 68 | 38 | 0.001 | 2.33 (1.39-3.91) |
| C | 1 | 49 | EA | 37 | 40 | 0.002 | 2.88 (1.45-5.73) |
| C | 1 | 77 | SN | 86 | 37 | 0.001 | 2.16 (1.36-3.44) |
| C | 1 | 80 | NK | 86 | 37 | 0.001 | 2.16 (1.36-3.44) |
| C | 2 | 97 | WR | 69 | 41 | < 0.001 | 2.56 (1.54-4.26) |
| C | 2 | 99 | CY | 27 | 48 | 0.002 | 3.34 (1.51-7.37) |
| C | 2 | 116 | FS | 36 | 42 | 0.004 | 2.67 (1.34-5.33) |
| C | 2 | 116 | YS | 24 | 46 | 0.004 | 3.14 (1.37-7.20) |
| C | 2 | 156 | RW | 22 | 55 | < 0.001 | 4.26 (1.79-10.11) |
Results are compared to death rate at 100 days post-transplant (21% death) in A, B, C, and DRB1 matched donor-recipient pairs (n=1,507).
R/D= Recipient/donor
Based on score test.
Traditional multivariate analysis of amino-acid substitution positions adjusting for clinical variables
We first tested if a single amino acid substitution position (regardless of substitution type) was associated with death by day 100 after adjustment for important patient risk factors. Using a 5% significance level we identified the following substitution positions: HLA-A 9, 17, HLA-B 109 and 116, HLA-C 6, 9, 11, 14, 16, 21, 24, 49, 77, 80, 97, 99, 114, 116, 156, 163. With a more stringent 0.5% significance level only the following 10 HLA-C positions: 9, 11, 21, 77, 80, 97, 99, 116, 156, and 163 were identified. Of these 10 HLA-C positions, 9 positions (except 163) were already identified by univariate analysis that tested the effect of substitution type at each substitution position, Table 6. It can be seen that multivariate analysis identified 4 additional substitution positions at the 0.5% significance level. This indicates that in addition to identifying more informative substitution type effect, testing the differential effect of substitution type at each substitution position is also a more powerful approach to identify substitution positions. Holding patient risk factors in the model we used a forward stepwise procedure with a 5% significance level for entry into and removal from the model to select the most important amino acid substitution positions from the initially identified positions. We found that HLA-A positions 17, 73, 166, HLA-B position 116, and HLA-C position 116 were the only amino acid substitution positions simultaneously associated with outcome, Table 7.
Table 7. Amino acid substitutions as predictors of death by day 100 identified by multivariate logistic regression analysis.
| Number | Odds Ratio | 95% CI | p Value | |
|---|---|---|---|---|
| A17 | ||||
| Matched | 2095 | 1.00 | ||
| Mismatched | 12 | 3.796 | 1.148-12.548 | 0.0288 |
| A73 | ||||
| Matched | 2088 | 1.00 | ||
| Mismatched | 19 | 2.617 | 1.013-6.760 | 0.0470 |
| A166 | ||||
| Matched | 2074 | 1.00 | ||
| Mismatched | 33 | 2.201 | 1.044-4.653 | 0.0381 |
| B116 | ||||
| Matched | 2067 | 1.00 | ||
| Mismatched | 40 | 2.545 | 1.308-4.949 | 0.0059 |
| C116 | ||||
| Matched | 1918 | 1.00 | ||
| Mismatched | 189 | 2.066 | 1.495-2.853 | <.0001 |
| Age | <.0001 | |||
| >50 | 199 | 1.00 | ||
| 40-49 | 529 | 0.947 | 0.658-1.363 | 0.7703 |
| 30-39 | 497 | 0.668 | 0.458-0.976 | 0.0368 |
| 20-29 | 390 | 0.553 | 0.356-0.798 | 0.0022 |
| 10-19 | 277 | 0.553 | 0.359-0.853 | 0.0073 |
| 0-9 | 215 | 0.232 | 0.136-0.397 | <.0001 |
| Disease | 0.0404 | |||
| AML | 542 | 1.00 | ||
| ALL | 507 | 1.279 | 0.947-1.728 | 0.1079 |
| CML | 973 | 0.842 | 0.642-1.105 | 0.2160 |
| MDS | 85 | 1.199 | 0.681-2.112 | 0.5287 |
| Disease Status | <.0001 | |||
| Early | 1116 | 1.00 | ||
| Intermediate | 991 | 1.619 | 1.281-2.047 | <.0001 |
| Sex Match | ||||
| Donor/Recipient | 0.0492 | |||
| Male/Male | 779 | 1.00 | ||
| Female/male | 516 | 1.209 | 0.926-1.578 | 0.1627 |
| Male/Female | 395 | 0.907 | 0.669-1.229 | 0.5298 |
| Female/Female | 417 | 1.364 | 1.030-1.808 | 0.0305 |
HLA-DQ and DP matching status was also analyzed. DQ matching status was not associated with survival rate at day 100 (p=0.33) but DP matching status was (p=0.005). These results indicate that there is no linkage effect of the class I mismatches with DQA1 or DQB1 disparities. There was no survival difference between patient-donor pairs that had one HLA class I antigen or allele mismatch (p=0.66).
Discussion
Several large studies using standard multivariable modeling have established the importance of molecular matching at HLA-A, B, C, and DRB1 for the outcome of HCT [1-5]. It is estimated that on average, every additional mismatch is associated with a 10% decrement in survival after adult unrelated donor transplantation for good risk patients [2]. But it is equally clear that many patients, particularly minorities lack matched unrelated donors [20] and suitable mismatched donors need to be identified to offer transplants to these patients. The effect of HLA mismatching on GvHD, relapse, and transplant related mortality (TRM) is mediated by amino acid substitutions, several of which can be found in most mismatched alleles. In this study we have identified 33 amino acid substitutions' locations that are associated with survival at day 100 post-transplant. Some of these locations, 97, 116 and 156, were present in all three HLA class I loci. Substitution locations 9, 77, and 95 were present on HLA-A and HLA-C mismatched antigens or alleles. Some locations were only identified on mismatched antigens or alleles of a single locus; HLA-A 43, 62, 63, 76, 114, 152, 166, 167; HLA-B 109; and HLA-C, 6, 11, 14, 21, 66, 80, 99, 163, and 173. The majority of the important amino acid substitutions identified in this study as associated with survival to day 100 are located on the alpha 1 or the alpha 2 domains of the peptide binding site, encoded by exons 2 and 3 respectively and are predicted to directly affect T-cell allorecognition [21-23]. The most common HLA mismatches associated with these amino acids are HLA-A*02:01/02:05, 02:01/02:06, 03:01/03:02, 01:01/11:01, 02:01/68:01, and 24:02/24:03; HLA-B*35:01/35:03 and 35:01/35:08; and HLA-C*01:02/02:02, 04:01/16:01, 05:01/07:04, 14:02/15:02, 03:03/04:01, 07:01/12:03, 06:02/07:01, 01:02/03:03, 01:02/15:02, 03:04/07:02, and 02:02/15:02. The identification of amino acid substitutions that are associated with a higher than average risk of failure in HCT, the so called non-permissive amino-acid substitutions, represents a first step towards the ultimate goal of identifying acceptable mismatches that could be used in the clinical setting for selection of suitable mismatched unrelated donors for patients lacking HLA-identical donors. However, additional studies using different datasets as well as functional studies are necessary to confirm these findings prior to clinical implementation of these results.
Initial insights of the importance of specific amino-acid substitutions were based on identification of individual patients and isolation of cytotoxic T-cell clones directed against HLA subtypes absent in the donor [8,9,24]. Ferrara and collaborators [10] using a large dataset reported in 2001 that substitutions at position 116 of class I molecules increase risk for acute GvHD and TRM. However, they did not attempt to distinguish the effects of substitutions in HLA-A, HLA-B or HLA-C [10]. Recently, Kawase and collaborators [11] have reported non-permissive HLA mismatches associated with acute GvHD in HCT patients from the Japan Marrow Donor Program (JMDP). In contrast to our study, Kawase's study population was comprised of recipients with heterogeneous diagnoses and disease stages, and donor-recipient pairs with mismatches at multiple HLA loci [11]. They conducted a traditional multivariate analysis to evaluate the effect of HLA one-locus allele mismatch on acute GvHD while adjusting for clinical factors (disease, treatment and patient-related predictors) as well as mismatch status in other loci [11]. They found 4 non-permissive mismatches in HLA-A, 1 in HLA-B, 7 in HLA-C, 1 in DRB1, 1 mismatch associated with DRB1-DQB1, and 2 in HLA-DPB1 [11]. A similar model was used to analyze the impact of each amino acid substitution type on each position separately. However, they did not adjust for multiple amino acid substitutions that commonly occur within a single HLA-mismatch [11]. They found 2 non-permissive amino-acid substitutions at HLA-A, positions 9 and 116 and 6 non-permissive amino-acid substitutions at HLA-C positions 9, 77, 80, 99, 116, and 156 [11]. More recently, the same group has published an analysis of HLA-mismatches that predict for relapse and overlap minimally with the mismatches associated with acute GvHD [25]. Functional studies have also been reported [12,13], however their results are in conflict with Ferrara [10] and Kawase's [11] reports and only include a small number of cases.
Our analysis differed from Kawase's [11] in several ways. First, we used a different endpoint namely death by day 100 and restricted our analysis to patients with good or intermediate risk leukemia. By focusing the analysis to a more restricted and hence more homogeneous study population, we hypothesized that we would reduce variability due to disease variables and increase the power to detect variables that predict for GvHD. Second, we used a new statistical method, random forest analysis, which has not been previously applied in HCT but which has several advantages over more conventional analysis methods as demonstrated by our results. Using random forest analysis, we confirmed all non-permissive amino-acid substitutions identified by Kawase et al [11] as well as the few amino-acid substitutions reported by other investigators [8-10,24]. Although RF analysis does not validate the interpretation of substitutions as permissive versus non-permissive and does not provide a p-value, the fact that we were able to identify these previously reported non-permissive amino-acid substitutions by random forest and not by traditional multivariate analysis in our dataset, supports the observation in other fields that random forests provides greater data analytic power. Furthermore, in addition to the 8 amino acid substitutions identified by Kawase et al [11], we identified another 25 that had similar or higher importance scores in the random forest analysis. Future studies in different patient populations are required to confirm the importance of these amino-acid substitutions in HCT. However, for the patient who needs a HCT today from an HLA-mismatched donor, the evolving literature suggests that using a donor who is mismatched with the recipient at positions 116 or 156 at either of the HLA class I loci, at position 9 at HLA-A or HLA-C, and at position 99 at HLA-C may increase the risk for early death and other adverse outcomes.
A number of limitations of this study should also be mentioned. Although there were some notable commonalities, the three separate analytic techniques we employed using the same data set identified different sets of clinical variables and amino acid substitutions associated with survival at day 100, highlighting the need for independent validation in multiple datasets and using multiple approaches. Also, we chose survival at day 100 as our primary endpoint since it is objective and likely most closely associated with acute GvHD. However, further studies should be done to investigate amino acid substitutions that have their maximal association with other outcomes and to determine permissive amino acid substitutions. Our analysis identified associations between amino acid substitutions and survival at day 100, but we cannot confirm biologic importance. Only well designed functional studies will show if the specific amino acid substitutions identified affect T-cell allorecognition or function or if they are markers for other critical factors causing increased mortality. Other biological factors that affect HLA amino acid mismatches and T-cell allorecognition in HCT such as shape of the T-cell receptor repertoire have not been investigated in this study. Finally, although most of these amino acid locations have been identified in other studies, we acknowledge that some of these amino acid substitution locations may only be a marker of a specific allele mismatch instead of a truly important location that has an effect on survival.
In conclusion, using random forest to analyze the largest currently available dataset of HCTs, we were able to confirm 13 previously identified class I amino acid substitutions as well as 20 additional novel class I amino acid substitutions that are predictors of survival at day 100. Random forest analysis presents a robust statistical methodology for analysis of HLA-mismatching and outcome studies, capable of identifying important amino acid substitutions missed by other methods. Based on these results, random forest analysis may prove an equally valuable tool to evaluate other transplant outcomes of interest.
Acknowledgments
The authors thank Theodore Karrison, PhD for statistical support. This study was supported by the University of Chicago Cancer Research Center, Chicago, Illinois (Fund-6-33573 [SRM]).
The CIBMTR is supported by Public Health Service Grant/Cooperative Agreement U24-CA76518 from the National Cancer Institute (NCI), the National Heart, Lung and Blood Institute (NHLBI) and the National Institute of Allergy and Infectious Diseases (NIAID); a Grant/Cooperative Agreement 5U01HL069294 from NHLBI and NCI; a contract HHSH234200637015C with Health Resources and Services Administration (HRSA/DHHS); two Grants N00014-06-1-0704 and N00014-08-1-0058 from the Office of Naval Research; and grants from AABB; Aetna; American Society for Blood and Marrow Transplantation; Amgen, Inc.; Anonymous donation to the Medical College of Wisconsin; Astellas Pharma US, Inc.; Baxter International, Inc.; Bayer HealthCare Pharmaceuticals; Be the Match Foundation; Biogen IDEC; BioMarin Pharmaceutical, Inc.; Biovitrum AB; BloodCenter of Wisconsin; Blue Cross and Blue Shield Association; Bone Marrow Foundation; Canadian Blood and Marrow Transplant Group; CaridianBCT; Celgene Corporation; CellGenix, GmbH; Centers for Disease Control and Prevention; Children's Leukemia Research Association; ClinImmune Labs; CTI Clinical Trial and Consulting Services; Cubist Pharmaceuticals; Cylex Inc.; CytoTherm; DOR BioPharma, Inc.; Dynal Biotech, an Invitrogen Company; Eisai, Inc.; Enzon Pharmaceuticals, Inc.; European Group for Blood and Marrow Transplantation; Gamida Cell, Ltd.; GE Healthcare; Genentech, Inc.; Genzyme Corporation; Histogenetics, Inc.; HKS Medical Information Systems; Hospira, Inc.; Infectious Diseases Society of America; Kiadis Pharma; Kirin Brewery Co., Ltd.; The Leukemia & Lymphoma Society; Merck & Company; The Medical College of Wisconsin; MGI Pharma, Inc.; Michigan Community Blood Centers; Millennium Pharmaceuticals, Inc.; Miller Pharmacal Group; Milliman USA, Inc.; Miltenyi Biotec, Inc.; National Marrow Donor Program; Nature Publishing Group; New York Blood Center; Novartis Oncology; Oncology Nursing Society; Osiris Therapeutics, Inc.; Otsuka America Pharmaceutical, Inc.; Pall Life Sciences; PDL BioPharma, Inc; Pfizer Inc; Pharmion Corporation; Saladax Biomedical, Inc.; Schering Corporation; Society for Healthcare Epidemiology of America; StemCyte, Inc.; StemSoft Software, Inc.; Sysmex America, Inc.; Teva Pharmaceutical Industries;; THERAKOS, Inc.; Thermogenesis Corporation; Vidacare Corporation; Vion Pharmaceuticals, Inc.; ViraCor Laboratories; ViroPharma, Inc.; and Wellpoint, Inc. The views expressed in this article do not reflect the official policy or position of the National Institute of Health, the Department of the Navy, the Department of Defense, or any other agency of the U.S. Government.
Footnotes
Authors' contributions: SRM conceptualized the study, interpreted the results and wrote the manuscript; SRM and SL designed the study; SL performed the univariate, multivariate, and random forest analyses; MM prepared amino acid database for analysis; MH prepared data for statistical analysis; SS and SJL contributed ideas and made significant contributions to the writing of the manuscript; JK performed multivariate analysis; TAB prepared the figure; KVB provided overall advice and guidance. All authors reviewed the manuscript.
Disclosure of conflict of interest: The authors declare no competing financial interests.
References
- 1.Flomenberg N, Baxter-Lowe LA, Confer D, Fernandez-Vina M, Filipovich A, Horowitz M, et al. Impact of HLA class I and class II high-resolution matching on outcomes of unrelated donor bone marrow transplantation: HLA-C mismatching is associated with a strong adverse effect on transplantation outcome. Blood. 2004;104:1923–1930. doi: 10.1182/blood-2004-03-0803. [DOI] [PubMed] [Google Scholar]
- 2.Lee SJ, Klein J, Haagenson M, Baxter-Lowe LA, Confer DL, Eapen M, et al. High-resolution donor-recipient HLA matching contributes to the success of unrelated donor marrow transplantation. Blood. 2007;110:4576–4583. doi: 10.1182/blood-2007-06-097386. [DOI] [PubMed] [Google Scholar]
- 3.Shaw BE. The clinical implications of HLA mismatches in unrelated donor haematopoietic cell transplantation. Int J Immunogenet. 2008;35:367–374. doi: 10.1111/j.1744-313X.2008.00793.x. [DOI] [PubMed] [Google Scholar]
- 4.Hauzenberger D, Schaffer M, Ringdén O, Hassan Z, Omazic B, Mattsson J, et al. Outcome of haematopoietic stem cell transplantation in patients transplanted with matched unrelated donors vs. allele-mismatched donors: a single centre study. Tissue Antigens. 2008;72:549–558. doi: 10.1111/j.1399-0039.2008.01148.x. [DOI] [PubMed] [Google Scholar]
- 5.Petersdorf EW. Optimal HLA matching in hematopoietic cell transplantation. Curr Opin Immunol. 2008;20:588–593. doi: 10.1016/j.coi.2008.06.014. [DOI] [PMC free article] [PubMed] [Google Scholar]
- 6.Whitelegg A, Barber LD. The structural basis of T-cell allorecognition. Tissue Antigens. 2004;63:101–108. doi: 10.1111/j.1399-0039.2004.00188.x. [DOI] [PubMed] [Google Scholar]
- 7.Archbold JK, Ely LK, Kjer-Nielsen L, Burrows SR, Rossjohn J, McCluskey J, et al. T cell allorecognition and MHC restriction-A case of Jekyll and Hyde. Molecular Immunol. 2008;45:583–598. doi: 10.1016/j.molimm.2006.05.018. [DOI] [PubMed] [Google Scholar]
- 8.Keever CA, Leong N, Cunningham I. HLA-B44-directed cytotoxic T cells associated with acute graft-versus-host disease following unrelated bone marrow transplantation. Bone Marrow Transplant. 1994;14:137–145. [PubMed] [Google Scholar]
- 9.Fleischhauer K, Kernan NA, O'Reilly RJ, Dupont B, Yang SY. Bone marrow-allograft rejection by T lymphocytes recognizing a single amino acid difference in HLA-B44. N Engl J Med. 1990;323:1818–1822. doi: 10.1056/NEJM199012273232607. [DOI] [PubMed] [Google Scholar]
- 10.Ferrara GB, Bacigalupo A, Lamparelli T, Lanino E, Delfino L, Morabito A, et al. Bone marrow transplantation from unrelated donors: the impact of mismatches with substitutions at position 116 of the human leukocyte antigen class I heavy chain. Blood. 2001;98:3150–3155. doi: 10.1182/blood.v98.10.3150. [DOI] [PubMed] [Google Scholar]
- 11.Kawase T, Morishima Y, Matsuo K, Kashiwase K, Inoko H, Saji H, et al. High-risk HLA allele mismatch combinations responsible for severe acute graft-versus-host disease and implication for its molecular mechanism. Blood. 2007;110:2235–2241. doi: 10.1182/blood-2007-02-072405. [DOI] [PubMed] [Google Scholar]
- 12.Heemskerk MB, Roelen DL, Dankers MK, van Rood JJ, Claas FH, Doxiadis II, et al. Allogeneic MHC class I molecules with numerous sequence differences do not elicit CTL response. Human Immunol. 2005;66:969–976. doi: 10.1016/j.humimm.2005.06.007. [DOI] [PubMed] [Google Scholar]
- 13.Heemskerk MB, Cornelissen JJ, Roelen DL, van Rood JJ, Claas FH, Doxiadis II, Oudshoorn M. Highly diverged MHC class I mismatches are acceptable for haematopoietic stem cell transplantation. Bone Marrow Transplant. 2007;40:193–200. doi: 10.1038/sj.bmt.1705721. [DOI] [PubMed] [Google Scholar]
- 14.Breiman L. Random Forests. Machine Learning J. 2001;45:5–32. [Google Scholar]
- 15.Breiman L. Statistical modeling: The two cultures. Statist Sci. 2001;16:199–231. [Google Scholar]
- 16.Lunetta KL, Hayward LB, Segal J, Van Eerdewegh P. Screening large-scale association study data: exploiting interactions using random forests. BMC Genet. 2004;5:32. doi: 10.1186/1471-2156-5-32. [DOI] [PMC free article] [PubMed] [Google Scholar]
- 17.Díaz-Uriarte R, de Andrés SA. Gene selection and classification of microarray data using random forest. BMC Bioinformatics. 2006;7:3. doi: 10.1186/1471-2105-7-3. [DOI] [PMC free article] [PubMed] [Google Scholar]
- 18.Dudoit S, Fridlyand J, Speed TP. Comparison of discrimination methods for the classification of tumors using gene expression data. J Am Stat Assoc. 2002;97:77–87. [Google Scholar]
- 19.Lee JW, Lee JB, Park M, Song SH. An extensive evaluation of recent classification tools applied to microarray data. Comput Stat Data Anal. 2005;48:869–885. [Google Scholar]
- 20.Dew A, Collins D, Artz A, Rich E, Stock W, Swanson K, et al. Paucity of HLA-identical unrelated donors for African-Americans with hematologic malignancies: the need for new donor options. Biol Blood Marrow Transplant. 2008;14:938–941. doi: 10.1016/j.bbmt.2008.06.005. [DOI] [PMC free article] [PubMed] [Google Scholar]
- 21.Bjorkman PJ, Saper MA, Samraoui B, Bennett WS, Strominger JL, Wiley DC. Structure of the human class I histocompatibility antigen, HLA-A2. Nature. 1987;329:506–512. doi: 10.1038/329506a0. [DOI] [PubMed] [Google Scholar]
- 22.Bjorkman PJ, Saper MA, Samraoui B, Bennett WS, Strominger JL, Wiley DC. The foreign antigen binding site and T cell recognition regions of class I histocompatibility antigens. Nature. 1987;329:512–518. doi: 10.1038/329512a0. [DOI] [PubMed] [Google Scholar]
- 23.Bjorkman PJ, Strominger JL, Wiley DC. Crystallization and X-ray diffraction studies on the histocompatibility antigens HLA-A2 and HLA-A28 from human cell membranes. J Mol Biol. 1985;186:205–210. doi: 10.1016/0022-2836(85)90271-2. [DOI] [PubMed] [Google Scholar]
- 24.Burrows SR, Khanna R, Burrows JM, Moss DJ. An alloresponse in humans is dominated by cytotoxic T lymphocytes (CTL) cross-reactive with a single Epstein-Barr virus CTL epitope: implications for graft-versus-host disease. J Exp Med. 1994;179:1155–1161. doi: 10.1084/jem.179.4.1155. [DOI] [PMC free article] [PubMed] [Google Scholar]
- 25.Kawase T, Matsuo K, Kashiwase K, Inoko H, Saji H, Ogawa S, et al. HLA mismatch combinations associated with decreased risk of relapse: Implications for molecular mechanism. Blood. 2009;113:2851–2858. doi: 10.1182/blood-2008-08-171934. [DOI] [PubMed] [Google Scholar]