

Abstract
Purpose
We assessed test–retest variability of cerebral blood flow (CBF), cerebral blood volume (CBV), cerebral metabolic rate of oxygen (CMRO2), and oxygen extraction fraction (OEF) measurements derived from dynamic 15O positron emission tomography (PET) scans.
Procedures
In seven healthy volunteers, complete test–retest 15O PET studies were obtained; test–retest variability and left-to-right ratios of CBF, CBV, OEF, and CMRO2 in arterial flow territories were calculated.
Results
Whole-brain test–retest coefficients of variation for CBF, CBV, CMRO2, and OEF were 8.8%, 13.8%, 5.3%, and 9.3%, respectively. Test–retest variability of CBV left-to-right ratios was <7.4% across all territories. Corresponding values for CBF, CMRO2, and OEF were better, i.e., <4.5%, <4.0%, and <1.4%, respectively.
Conclusions
The test–retest variability of CMRO2 measurements derived from dynamic 15O PET scans is comparable to within-session test–retest variability derived from steady-state 15O PET scans. Excellent regional test–retest variability was observed for CBF, CMRO2, and OEF. Variability of absolute CBF and OEF measurements is probably affected by physiological day-to-day variability of CBF.
Key words: Parametric, CBF, CMRO2, OEF, PET
Introduction
Oxygen-15 positron emission tomography (15O PET) can be used to measure cerebral blood flow (CBF), cerebral blood volume (CBV), cerebral metabolic rate of oxygen (CMRO2), and oxygen extraction fraction (OEF) [1–8]. Several methods have been proposed for determining CBF, CBV, CMRO2, and OEF using 15O PET. Administration of radiotracers using a steady-state technique, which is recognized for its capacity to provide OEF values with very high accuracy [9], is one of those methods [7, 10–12]. This method is based on the continuous administration of 15O-labeled tracers (usually by inhalation) until constant activity concentrations are reached in the tissue and blood (dynamic equilibrium). Quantitative measures of CBF, CMRO2, and OEF can then be obtained from the observed activity concentrations using very simple equations [13]. Disadvantages of the steady-state technique are the need for stable arterial concentrations [10, 14], the relatively high radiation dose, and the need to assume a value for the volume of distribution of water. In addition, not all cyclotrons have the capacity to produce 15O-labeled tracers continuously.
An alternative method to calculate CBF, CMRO2, and OEF is the use of dynamic scanning protocols together with bolus injections and/or brief inhalations of the 15O-labeled tracers [11]. Generation of parametric CBF data using a basis function approach has been discussed previously [15, 16]. In order to generate parametric CMRO2 and OEF images with a dynamic scanning protocol, several methods have been described [17–20]. Day-to-day variability of CBF, CMRO2, and OEF measurements using dynamic 15O PET scans has not been addressed previously. Such an assessment is essential for interpreting results of longitudinal studies. In addition to absolute values, left-to-right ratios of CBF, CMRO2, and especially OEF can be important for identifying patients with impaired cerebral perfusion caused by occlusive cerebral artery disease, who might be treated with extracranial to intracranial bypass surgery [21, 22]. Again, day-to-day variability of these ratios using dynamic 15O PET scans has not been determined.
The purpose of the present study was to generate reference data of CBF, CMRO2, and OEF using dynamic 15O PET scans and to evaluate associated day-to-day test–retest variability.
Materials and Methods
Subjects
Test–retest PET studies were performed in ten healthy volunteers (six men, four women) with a mean age of 69 years (range, 57 to 80 years) who were scanned on two separate occasions (with an interval of 3–54 days). In addition, all patients underwent magnetic resonance imaging (MRI), which was needed for PET image analysis shortly before the first PET study. The study was approved by the medical ethics committee of the University Medical Center Utrecht and all volunteers provided informed consent.
Scan Protocol
PET scans were acquired using an ECAT EXACT HR+ scanner (CTI/Siemens, Knoxville, TN, USA) which has been characterized elsewhere [23]. Subjects were scanned under baseline conditions, i.e., lights in the room were dimmed and music was turned off. Patients were asked to close their eyes. Heads were positioned in an immobilization device to minimize patient motion during the study and in between scans. Each study consisted of [15O]H2O, [15O]O2, and [15O]CO emission scans. Prior to the emission scans, a 10-min transmission scan was acquired for attenuation and scatter correction purposes. For the subsequent CBF study, a bolus (~5 s) of 1,100 MBq [15O]H2O was administered intravenously, simultaneously starting a 3D dynamic emission scan (25 frames over a period of 600 s). The [15O]O2 study was performed 5 min after the end of the CBF study to allow for decay of residual 15O activity to background levels. A 3D dynamic emission scan (20 frames over a period of 600 s) was then started simultaneously with the net inhalation of approximately 300 MBq [15O]O2 gas during a period of ~30 s. During administration of the [15O]O2 gas, the subjects continued breathing normally to avoid changes in cerebral hemodynamics, but they were instructed to inhale through the nasal administration cannula (oxygen catheter DK3460; diameter, 4.7 mm; Unomedical, Birkerød, Denmark) and exhale through the mouth. Note that, in this study, scan durations of 600 s were used for both the water and oxygen studies. Initially, it was attempted to use these longer scans to derive both perfusion and oxygen extraction fraction from a single [15O]O2 study. However, it was found that this was not feasible, and data were therefore analyzed by reusing perfusion and volume of distribution from the water scan (see “Image Analysis”). Although, by reusing parameters from the water scan, shorter scan durations may have been applied, it would not have shortened the overall study duration as some time interval between scans is needed to allow for radioactive decay. For the CBV study, a bolus of approximately 200 MBq [15O]CO gas was administrated in a manner identical to the [15O]O2 procedure. One minute after the end of inhalation, a 3D dynamic emission scan (three frames over a period of 360 s) was started. All scans were reconstructed using FORE + 2D FBP reconstruction with a Hanning filter at Nyquist frequency, including all usual corrections for quantification. A matrix size of 256 × 256 and a zoom of 2.1 were applied, resulting in a voxel size of 1.2 × 1.2 × 2.4 mm3 and a final image resolution of ~7 mm full width at half maximum. For all dynamic scans, the arterial input function was measured using an online continuous blood-sampling device; details on this device are given in [24]. In short, the device consists of a bismuth germanate (BGO)-based detector, shielded by a 3-cm lead, a withdrawal pump, and a computer for reading out the detector and controlling the pump. During blood withdrawal, a 1-mm-inner-diameter tubing that is connected to an arterial cannula is positioned in a slit that runs through the BGO detector. On the other end, the tubing is connected to a 3-mm-inner-diameter tubing that runs through the pump, and finally blood is collected in a 3-cm lead shielded waste bag. Using scripts, both detector readout sampling and pump speed (i.e., withdrawal rates) can set and automatically change during the studies. When necessary, pump speed can be overruled manually. During the first 4 min of each study, blood is withdrawn at a rate of 450 ml/h, and readout of the detector is performed continuously using 1-s readout samples. After 4 min onwards, pump speed is set to 150 ml/h to minimize the amount of blood withdrawn, and the detector readout sampling time is set to 10 s. Manual samples were taken at discrete times for calibration purposes and for assessment of plasma-to-whole blood ratios: three samples at 5.5, 8, and 10 min during the [15O]H2O scan, six samples at 1, 2, 3, 4.5, 7, and 9 min during the [15O]O2 scan, and three samples at 1, 3, and 5 min during the [15O]CO scan. Activity concentrations in the blood and plasma were determined for all samples. For the samples taken during the oxygen scan, the plasma-to-whole blood ratios were determined in order to separate the whole blood input function into water and oxygen input functions needed for kinetic analysis. For the latter purpose, a multi-exponential function was fitted through the six plasma-to-whole blood ratios.
Image Analysis
Parametric images were calculated using previously developed models. Parametric CBF and the volume of distribution of water (V T) images were generated using a basis function implementation of the blood flow model, including corrections for dispersion, delay, and arterial blood volume as described previously [16]. Next, parametric CMRO2 and OEF images were generated using a slightly modified implementation of the method published by Hattori et al. [20] with the following differences: (1) as scans were acquired over 600 s, all frames during this interval were included in fitting the data; (2) the parametric V T data derived from the CBF scans were reused voxelwise rather than using the (same) fixed value for all voxels [16, 25]; and (3) the blood volume fraction was included as fit parameter rather than reusing it from the CO study as it has been shown that this procedure provides more accurate fits near large blood vessels [25]. More details about the implementation of the basis function method are given in the Appendix. Parametric CBV data were derived from the CO scan as described by Martin et al. [26] and Hattori et al. [20].
Next, anatomical T1-weighted MRI images were coregistered with the PET images. These scans were reviewed visually to exclude anatomical abnormalities. Subsequently, an MRI template with volumes of interest (VOIs) of the 3D flow territories of middle cerebral artery (MCA), anterior cerebral artery (ACA), and posterior cerebral artery (PCA) (Fig. 1) [27] was warped onto the coregistered MRI scan of each subject. Warping was performed using the Automated Image Registration (AIR) software developed by Woods et al. [28]. Nonrigid 12-parameter perspective warping was applied to fit the template onto the subject's MRI scan. Afterwards, the warped, 3D VOIs were inspected and manually corrected when needed. Statistical parametric mapping (SPM02, Wellcome Department of Cognitive Neurology, London, UK, application written in Matlab 5.2; MathWorks, Inc., Natick, MD, USA) was used for gray–white matter segmentation of the coregistered MRI scan. These gray and white matter segmentations were then used in combination with the warped VOI template to calculate mean CBF, CBV, CMRO2, and OEF in the different flow territories, separating data/VOI into gray and white matter subregions. The generation of CBF, CBV, CMRO2, and OEF data and VOI analyses were performed using in-house developed software (IDL, 6.2, ITT, Boulder CO, USA).
Fig. 1.
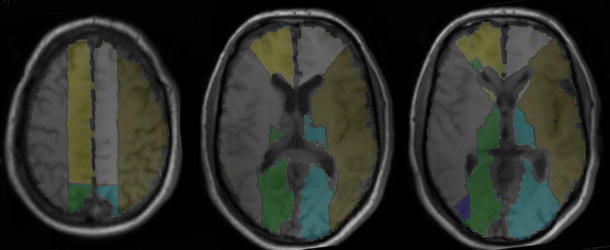
Typical warped whole-brain flow territory volumes of interest (maps). Territory of ACA, gray on left hemisphere. Territory of MCA, brown on left hemisphere. Territory of PCA, blue on left hemisphere.
Statistical Analysis
Individual CBF, CBV, CMRO2, and OEF test–retest data will be displayed for all subjects. To assess intersubject variability of gray matter CBF, CBV, CMRO2, and OEF measurements, standard deviation and coefficient of variation  were calculated across subjects for the defined flow territories. Day-to-day reproducibility of gray matter CBF, CBV, CMRO2, and OEF measurements was calculated in a similar fashion. As stated above, left-to-right ratios of hemodynamic parameters, in particular OEF for the MCA territory [21], may be important for selecting patients with compromised cerebral hemodynamics. Therefore, left-to-right ratios of CBF, CBV, CMRO2, and OEF were also calculated as well as their intersubject variability.
Results
Complete test and retest parametric CBF, CBV, CMRO2, and OEF images could be generated reliably in seven of the ten subjects. In two subjects, the input curve of one of the scans (i.e., either test or retest scan) showed irregularities due to radiation spillover, possibly due to poor positioning of the tubing within the detector and poor inhalation of 15O2. In one subject, due to technical reasons and human mistakes, erroneous well-counter readings were obtained for the manual samples. The time duration between the two scans was 54 days in one subject, 28 days in another subject, and 3 to 8 days in the other five subjects. Figure 2 shows an example of the parametric images of a healthy subject in comparison with a patient with recurrent transient ischemic attacks (TIAs) associated with a left internal carotid artery occlusion. The CBF, CMRO2, and OEF results for the seven successful test–retest studies are shown in Fig. 3 and, together with CBV data, summarized in Table 1. Left-to-right ratios of test and retest CBF, CMRO2, and OEF measurements are shown in Fig. 4 and, together with CBV data, summarized in Table 2. The range of the left-to-right OEF ratio in the MCA gray matter territory was 0.98–1.03 (n = 14).
Fig. 2.

Typical CBF, OEF, and CMRO2 parametric maps for a healthy volunteer in comparison with a patient who had recurrent TIAs associated with a left internal carotid artery occlusion. The PET study of the patient shows in the ipsilateral hemisphere a decreased CBF and increased OEF compared with the contralateral hemisphere.
Fig. 3.
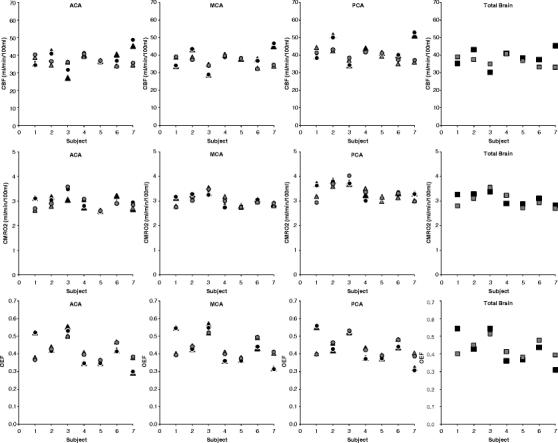
Relationship between test and retest measurements of gray matter CBF, CMRO2, and OEF in seven healthy volunteers. Black circle test right hemisphere; black triangle test left hemisphere, black square test both hemispheres. Gray circle retest right hemisphere, gray triangle retest left hemisphere, gray square retest both hemispheres. ACA anterior cerebral artery, MCA middle cerebral artery, PCA posterior cerebral artery. Total brain included all flow territories.
Table 1.
Intersubject variability and day-to-day reproducibility of dynamic gray matter PET measurements
| Intersubject variabilitya | Day-to-day variability | ||||
|---|---|---|---|---|---|
| Mean ± SDb | SD | CV (%) | SD | CV (%) | |
| CBF (ml/min/100 ml) | |||||
| MCA | |||||
| Left | 37.4 ± 3.3 | 5.5 | 14.6 | 3.3 | 8.9 |
| Right | 37.3 ± 3.3 | 5.8 | 15.2 | 3.4 | 9.1 |
| PCA | |||||
| Left | 41.2 ± 3.8 | 6.3 | 14.6 | 4.1 | 9.7 |
| Right | 41.3 ± 3.6 | 6.6 | 15.5 | 3.3 | 7.8 |
| ACA | |||||
| Left | 37.1 ± 2.8 | 5.9 | 15.4 | 3.9 | 10.6 |
| Right | 37.9 ± 3.0 | 5.6 | 14.4 | 3.2 | 8.3 |
| Total brain | 37.6 ± 2.9 | 5.1 | 13.1 | 3.3 | 8.8 |
| CBV (mL/100 mL) | |||||
| MCA | |||||
| Left | 2.96 ± 0.5 | 0.4 | 13.6 | 0.4 | 13.8 |
| Right | 2.99 ± 0.5 | 0.4 | 12.0 | 0.4 | 14.1 |
| PCA | |||||
| Left | 3.35 ± 0.5 | 0.5 | 15.1 | 0.5 | 15.9 |
| Right | 3.47 ± 0.6 | 0.6 | 15.8 | 0.5 | 16.1 |
| ACA | |||||
| Left | 2.79 ± 0.4 | 0.2 | 7.9 | 0.4 | 15.9 |
| Right | 2.90 ± 0.5 | 0.6 | 18.2 | 0.4 | 14.9 |
| Total brain | 4.06 ± 0.6 | 0.5 | 12.1 | 0.5 | 13.8 |
| CMRO2 (ml/min/100 ml) | |||||
| MCA | |||||
| Left | 3.04 ± 0.2 | 0.2 | 6.9 | 0.1 | 4.1 |
| Right | 3.01 ± 0.2 | 0.2 | 7.2 | 0.1 | 4.5 |
| PCA | |||||
| Left | 3.39 ± 0.3 | 0.3 | 7.7 | 0.2 | 5.3 |
| Right | 3.38 ± 0.3 | 0.3 | 9.0 | 0.2 | 5.4 |
| ACA | |||||
| Left | 2.92 ± 0.2 | 0.3 | 8.8 | 0.2 | 6.9 |
| Right | 2.96 ± 0.3 | 0.3 | 9.2 | 0.1 | 3.8 |
| Total brain | 3.05 ± 0.2 | 0.2 | 7.1 | 0.2 | 5.3 |
| OEF (%) | |||||
| MCA | |||||
| Left | 43.4 ± 6.5 | 9.5 | 22.0 | 4.0 | 9.8 |
| Right | 43.1 ± 6.5 | 9.2 | 21.6 | 4.1 | 9.5 |
| PCA | |||||
| Left | 43.6 ± 5.6 | 8.4 | 19.6 | 4.1 | 9.5 |
| Right | 43.4 ± 6.3 | 9.0 | 21.0 | 3.9 | 9.3 |
| ACA | |||||
| Left | 41.8 ± 6.6 | 9.6 | 23.1 | 4.3 | 10.5 |
| Right | 41.3 ± 6.0 | 8.8 | 21.5 | 4.1 | 9.9 |
| Total brain | 43.0 ± 6.3 | 9.1 | 21.4 | 4.0 | 9.3 |
SD test–retest standard deviation, CV coefficient of variation, MCA middle cerebral artery, PCA, posterior cerebral artery, ACA anterior cerebral artery
aBaseline data
bMean test and retest data. Mean values given for comparison
Fig. 4.
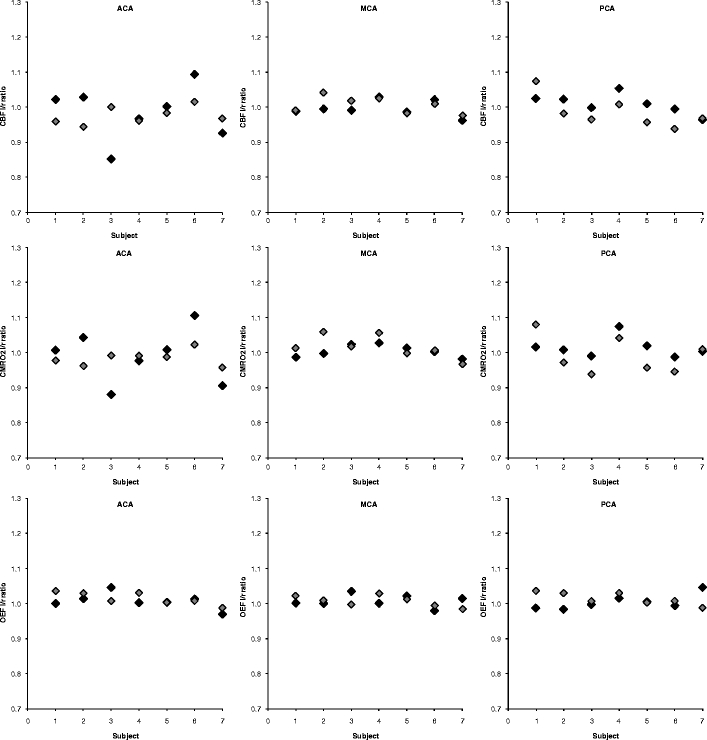
Relationship between test and retest left–right ratio measurements of CBF, CMRO2, and OEF in seven healthy volunteers. Black indicates test data, gray indicates retest data. ACA anterior cerebral artery, MCA middle cerebral artery, PCA posterior cerebral artery.
Table 2.
Intersubject variability and day-to-day reproducibility of left–right ratios of dynamic gray matter PET measurements
| Intersubject variabilitya | Day-to-day reproducibility | ||||
|---|---|---|---|---|---|
| Mean ± SDb | SD | CV (%) | SD | CV (%) | |
| CBF (ml/min/100 ml) | |||||
| L/R ratio | |||||
| MCA | 1.00 ± 0.02 | 0.02 | 2.2 | 0.01 | 1.1 |
| PCA | 1.00 ± 0.03 | 0.03 | 2.8 | 0.03 | 2.9 |
| ACA | 0.98 ± 0.04 | 0.08 | 7.9 | 0.04 | 4.5 |
| CBV (ml/100 ml) | |||||
| L/R ratio | |||||
| MCA | 0.99 ± 0.01 | 0.03 | 3.4 | 0.03 | 2.6 |
| PCA | 0.97 ± 0.08 | 0.09 | 9.4 | 0.03 | 3.5 |
| ACA | 0.97 ± 0.12 | 0.13 | 12.7 | 0.07 | 7.4 |
| CMRO2 (ml/min/100 ml) | |||||
| L/R ratio | |||||
| MCA | 1.01 ± 0.02 | 0.02 | 1.8 | 0.02 | 1.6 |
| PCA | 1.00 ± 0.04 | 0.03 | 2.9 | 0.03 | 3.0 |
| ACA | 0.99 ± 0.04 | 0.08 | 7.8 | 0.04 | 4.0 |
| OEF | |||||
| L/R ratio | |||||
| MCA | 1.01 ± 0.01 | 0.02 | 1.7 | 0.01 | 1.5 |
| PCA | 1.01 ± 0.02 | 0.02 | 2.1 | 0.01 | 0.8 |
| ACA | 1.01 ± 0.02 | 0.02 | 2.2 | 0.01 | 1.4 |
SD test–retest standard deviation, CV coefficient of variation, MCA middle cerebral artery, PCA posterior cerebral artery, ACA anterior cerebral artery
aBaseline data
bMean test and retest data. Mean left–right ratios given for comparison
Discussion
This study provides reference data for CBF, CBV, CMRO2, and OEF values derived from dynamic 15O PET scans. Obtained mean values of CBF, CBV, CMRO2, and OEF are comparable to those reported previously [9, 29, 30]. Compared with the within-session reproducibility of steady-state measurement of CBF and OEF [30], we found a similar day-to-day test–retest variability of CBF and a higher day-to-day test–retest variability of OEF measurements. Day-to-day variability of CBF measurements in the present study was comparable to that reported previously for healthy volunteers [2, 31, 32]. In addition to measurement errors that affect day-to-day variability of CBF, CBV, CMRO2, and OEF measurements [33], the day-to-day test–retest variability of CBF measurements in the present study is most likely also affected by physiological day-to-day variability. With the present study design, however, it is not possible to distinguish between measurement errors and physiological day-to-day variance. Although the exact contribution of physiological and measurement errors could be studied further using a within-session test–retest reproducibility study, the present design provides a clinically relevant assessment of the variability in CBF, CBV, CMRO2, and OEF measurements for follow-up studies (e.g., when monitoring the effects of treatment). Interestingly, the variability of CMRO2 measurements was low and comparable to within-session reproducibility of CMRO2 derived from steady-state studies [30]. The relatively high day-to-day variability in CBF and low day-to-day variability in CMRO2 also implies a high variability in OEF. This finding is in line with previous observations where artificial changes in CBF were compensated by opposite changes in OEF [34] to maintain constant CMRO2 needed to preserve cell functions of brain neurons [35]. The observed very good test–retest variability of CMRO2 validates the use of a dynamic scanning procedure for 15O PET studies.
Other 15O PET techniques have been described in literature, such as autoradiographic methods and dual autoradiographic methods [18, 36] and steady-state measurements [7, 10–12]. A possible advantage of the method used in our study is that it is not required to assume a fixed value for the volume of distribution (or partition coefficient) of water and that the blood volume fraction is used as fit parameter. In theory, this may provide more accurate results but at the cost of using two additional fit parameters in the calculations. The latter could potentially result in worse reproducibilities. The test–retest variability and CBF, CMRO2, and OEF values observed in our studies, however, are very comparable to those found elsewhere using different scanning techniques as discussed above. Moreover, the very low variability seen in CMRO2 suggests that the higher day-to-day variabilities observed for CBF and OEF are likely determined by physiological variation rather than technical issues or the applied 15O PET technique. It is therefore assumed that the observed test–retest variabilities are independent of the applied 15O PET technique or, at least, that the dynamic scanning technique performs equally as well as others. Clearly, critical issues in the dynamic scanning technique are related to the collection of the arterial input function as illustrated by the three study failures. Also, shorter scan durations than 10-min acquisitions may have been applied, yet it would not have shortened the overall study duration as some time interval between scans is needed to allow for radioactive decay. Moreover, time is needed for quality control of the collected input function data and for repeat production of the 15O-labeled tracers when needed.
When studying left-to-right ratios of CBF, CMRO2, and OEF (Table 2), excellent test–retest variabilities were observed, i.e., in the order of a few percent (CV). This good test–retest variability was less prominent for the CBV left-to-right ratio, probably due to higher noise levels in the [15O]CO scan and asymmetry in the presence of larger blood vessels in the 3D VOI. In the kinetic analysis of CBF, CMRO2, and OEF data, the vascular component within a VOI was used as fit parameter rather than reusing CBV derived from the [15O]CO study. Therefore, differences or inaccuracies in vascular fraction seen in the [15O]CO scans did not affect regional test–retest variability of CBF, CMRO2, and OEF measurements. Apart from studying absolute changes in CBF, CMRO2, and OEF in case of monitoring response to treatment or following pathophysiological processes over time, dynamic 15O PET studies may be used clinically as a sensitive means of detecting ipsilateral versus contralateral asymmetries in CBF, CMRO2, and OEF. The present values of left-to-right ratios were comparable with previous measurements [37]. Taken together, the present study provides additional reference data for absolute and relative (i.e., left-to-right ratios) CBF, CMRO2, and OEF measurements using dynamic 15O PET scans. When asymmetry in CBF or OEF is expected such as in patients with unilateral ICA occlusion who are at high risk of stroke [21], left-to-right ratios may be useful because of their excellent test–retest variability (Table 2). It should be emphasized that in our study results were obtained at a baseline condition. In physiologically stressed conditions, test–retest variabilities may be different than those observed in the present study. It is likely that the technical component of the observed test–retest variability may be similar to those seen under baseline conditions, i.e., effects of image noise and input function collection and processing on CBF, OEF, and CMRO2 test–retest variabilities may be similar. Yet day-to-day test–retest variability may be more strongly affected by the quality of obtaining reproducible stressed conditions. From the present data, it is not possible to determine the test–retest variability under physiologically stressed or pathological conditions, and this warrants further investigations, yet information on test–retest variability under baseline conditions provide valuable information of the normal range of CBF, OEF, and CMRO2, and this information is needed in order to reliably identify subjects or brain regions with abnormally high or low values.
In the present study, warped 3D VOIs were used to measure CBF, CMRO2, and OEF in entire MCA, PCA, and ACA flow territories. This approach has both advantages and disadvantages. It prevents possible selection errors that can occur when only a few smaller regions of interest are used for analysis. Moreover, as carotid occlusions are likely to affect CBF, CMRO2, and OEF in entire flow territories, use of 3D VOI will provide data with better statistics and higher sensitivity. However, use of larger 3D VOI may underestimate and even miss small focal changes in CBF, CMRO2, and OEF because of the relatively large volumes of the flow territories. It should be noted, however, that in the present study first parametric maps were generated. Clearly, these parametric images could also be used to analyze the data with smaller VOI or at the voxel level. In addition, they are presently used for visual inspection/evaluation.
The dynamic acquisition protocol is relatively vulnerable to technical errors. As mentioned above, three out of 20 PET studies could not be analyzed primarily because of errors in the acquired input function data. Correct administration of the tracers and collection of the input functions seem to be the most critical issues in obtaining reliable results. Because of the short half-life of 15O, however, acquisition errors could easily be corrected provided that they are detected immediately after or during the scanning procedure. In those cases, a scan could be repeated, adding only 15 min to the overall study duration. Therefore, for routine clinical use, it is required to have an online data quality assurance procedure in place. At present, we have implemented an online quality control system based on the number of counts (activity) seen in the manual samples to verify sufficient and correct administration of the tracers. Furthermore, online review of the input functions allows verification of correct collection of the continuous online blood input curves.
Conclusion
Day-to-day test–retest variability of CMRO2 measurements using dynamic 15O PET scans is comparable to within-session test–retest variability using steady-state [15O] PET scans. Day-to-day test–retest variability of CBF and OEF measurements probably is determined primarily by day-to-day physiological variability in CBF and corresponding adaptation of OEF. Test–retest variability in left-to-right ratios of CBF, CMRO2, and OEF is excellent (CV < 4.5%) and may even be used to detect impaired brain perfusion and/or oxygen consumption in individual patients.
Acknowledgements
C.J.M. Klijn was supported by a clinical fellowship from the Netherlands Organization for Health Research and Development (grant number 907-00-103) and by a grant from the Netherlands Heart Foundation (grant number 2003B263). R. Boellaard is supported by the Netherlands Organization for Scientific Research (NWO, VIDI Grant 016.066.309).
Conflicts of interest
The authors declare that they have no conflicts of interest.
Open Access
This article is distributed under the terms of the Creative Commons Attribution Noncommercial License which permits any noncommercial use, distribution, and reproduction in any medium, provided the original author(s) and source are credited.
Appendix: Generation of OEF and CMRO2 Parametric Images Using Basis Function Methods
Parametric CBF and volume of distribution of water (V T) images were generated using a basis function implementation of the blood flow model, including corrections for dispersion, delay, and arterial blood volume as described previously (Eqs. 1–4). The model is given by a single tissue compartment model with (arterial) blood volume fraction (V a) correction:
 |
1 |
 |
2 |
C T represents the activity concentration in tissue and C ROI/VOX the activity concentration in a region of interest or, in this case, in a voxel. F is the flow or perfusion, V T is the volume of distribution, and C a is the arterial input function (in this case of arterial whole-blood activity concentration over time).
In order to reduce computation time, the convolution term in these equations can be precomputed for a range of  values and then Eq. 1 can be rewritten as a linear equation:
 |
3 |
and Eq. 2 is then rewritten as (Eq. 4):
 |
4 |
Finally, for each voxel time–activity curve, the combination of BFi(t) (and thus k i), F, and V a which provides the minimal weighted least squares discrepancy between measured data and Eq. 4 is used to calculate V a, F, and V T.
Next, parametric CMRO2 and OEF images were generated using a slightly modified implementation of the method published by Hattori et al. [20] with the following differences: (1) all frames over the interval of 0–600 s postinjection were included, (2) the parametric V T data derived from the CBF scans were reused voxelwise rather than using the (same) fixed value for all voxels [16, 25], and (3) arterial blood volume was used as fit parameter rather than reusing it from the CO study as it has been shown that this procedure provides more accurate fits near large blood vessels [25]. The basis function method for analyzing the oxygen studies is thus given by (Eq. 5):
 |
5 |
C
ROI/VOX is the PET tissue time–activity curve, corrected for contribution of activity from venous blood using method of Holden et al. [17]. V
ais the arterial blood volume fraction OR spillover correction term (needed in parametric application of the model).  is the arterial input function of water.
  is the arterial input function of oxygen. F is the flow or perfusion, E is the oxygen extraction fraction (OEF), and
  . The total arterial input function C
a is split into
. The total arterial input function C
a is split into  and
and  , based on the activity concentration ratios between whole blood
  and plasma
  sample data, thus assuming that oxygen is bound in red blood cell, i.e., [15O]O2 is not present in plasma.
In our implementation, F and V T and thus the k values are reused voxelwise from the parametric data derived from the 15O water study. Consequently, the convolution terms are precomputed/known for each voxel, and only a linear equation remains. By weighted linear least squares fitting of the voxel TAC with Eq. 5, the OEF (=E) and thus also the product of OEF and F are obtained. CMRO2 is then derived simply by multiplying the OEF by the F image with the oxygen content in blood (derived from the manual blood samples).
Footnotes
Significance: The present study provides reference data for absolute and relative (i.e., left-to-right ratios) CBF, CBV, CMRO2, and OEF values derived from dynamic 15O PET scans. In addition, the observed very good test–retest variability of CBF, CMRO2, and OEF validates the use of a dynamic scanning procedure for 15O PET studies.
References
- 1.Jones T, Chesler DA, Ter-Pogossian MM. The continuous inhalation of oxygen-15 for assessing regional oxygen extraction in the brain of man. Br J Radiol. 1976;49:339–343. doi: 10.1259/0007-1285-49-580-339. [DOI] [PubMed] [Google Scholar]
- 2.Frackowiak RS, Lenzi GL, Jones T, Heather JD. Quantitative measurement of regional cerebral blood flow and oxygen metabolism in man using 15O and positron emission tomography: theory, procedure, and normal values. J Comput Assist Tomogr. 1980;4:727–736. doi: 10.1097/00004728-198012000-00001. [DOI] [PubMed] [Google Scholar]
- 3.Lammertsma AA, Jones T. Correction for the presence of intravascular oxygen-15 in the steady-state technique for measuring regional oxygen extraction ratio in the brain: 1. Description of the method. J Cereb Blood Flow Metab. 1983;3:416–424. doi: 10.1038/jcbfm.1983.67. [DOI] [PubMed] [Google Scholar]
- 4.Herscovitch P, Markham J, Raichle ME. Brain blood flow measured with intravenous H2(15)O. I. Theory and error analysis. J Nucl Med. 1983;24:782–789. [PubMed] [Google Scholar]
- 5.Alpert NM, Eriksson L, Chang JY, et al. Strategy for the measurement of regional cerebral blood flow using short-lived tracers and emission tomography. J Cereb Blood Flow Metab. 1984;4:28–34. doi: 10.1038/jcbfm.1984.4. [DOI] [PubMed] [Google Scholar]
- 6.Mintun MA, Raichle ME, Martin WR, Herscovitch P. Brain oxygen utilization measured with O-15 radiotracers and positron emission tomography. J Nucl Med. 1984;25:177–187. [PubMed] [Google Scholar]
- 7.Jones SC, Greenberg JH, Dann R, et al. Cerebral blood flow with the continuous infusion of oxygen-15-labeled water. J Cereb Blood Flow Metab. 1985;5:566–575. doi: 10.1038/jcbfm.1985.85. [DOI] [PubMed] [Google Scholar]
- 8.Huang SC, Feng DG, Phelps ME. Model dependency and estimation reliability in measurement of cerebral oxygen utilization rate with oxygen-15 and dynamic positron emission tomography. J Cereb Blood Flow Metab. 1986;6:105–119. doi: 10.1038/jcbfm.1986.13. [DOI] [PubMed] [Google Scholar]
- 9.Leenders KL, Perani D, Lammertsma AA, et al. Cerebral blood flow, blood volume and oxygen utilization. Normal values and effect of age. Brain. 1990;113:27–47. doi: 10.1093/brain/113.1.27. [DOI] [PubMed] [Google Scholar]
- 10.Senda M, Buxton RB, Alpert NM, et al. The 15O steady-state method: correction for variation in arterial concentration. J Cereb Blood Flow Metab. 1988;8:681–690. doi: 10.1038/jcbfm.1988.115. [DOI] [PubMed] [Google Scholar]
- 11.Lammertsma AA, Frackowiak RS, Hoffman JM, et al. The C15O2 build-up technique to measure regional cerebral blood flow and volume of distribution of water. J Cereb Blood Flow Metab. 1989;9:461–470. doi: 10.1038/jcbfm.1989.69. [DOI] [PubMed] [Google Scholar]
- 12.Okazawa H, Yamauchi H, Sugimoto K, et al. Quantitative comparison of the bolus and steady-state methods for measurement of cerebral perfusion and oxygen metabolism: positron emission tomography study using 15O-gas and water. J Cereb Blood Flow Metab. 2001;21:793–803. doi: 10.1097/00004647-200107000-00004. [DOI] [PubMed] [Google Scholar]
- 13.Lammertsma AA. Positron emission tomography of the brain: measurement of regional cerebral function in man. Clin Neurol Neurosurg. 1984;86:1–11. doi: 10.1016/0303-8467(84)90270-1. [DOI] [PubMed] [Google Scholar]
- 14.Lammertsma AA, Correia JA, Jones T. Stability of arterial concentrations during continuous inhalation of C15O2 and 15O2 and the effects on computed values of CBF and CMRO2. J Cereb Blood Flow Metab. 1988;8:411–417. doi: 10.1038/jcbfm.1988.77. [DOI] [PubMed] [Google Scholar]
- 15.Lammertsma AA, Cunningham VJ, Deiber MP, et al. Combination of dynamic and integral methods for generating reproducible functional CBF images. J Cereb Blood Flow Metab. 1990;10:675–686. doi: 10.1038/jcbfm.1990.121. [DOI] [PubMed] [Google Scholar]
- 16.Boellaard R, Knaapen P, Rijbroek A, Luurtsema GJ, Lammertsma AA. Evaluation of basis function and linear least squares methods for generating parametric blood flow images using 15O-water and positron emission tomography. Mol Imaging Biol. 2005;7:273–285. doi: 10.1007/s11307-005-0007-2. [DOI] [PubMed] [Google Scholar]
- 17.Holden JE, Eriksson L, Roland PE, Stone-Elander S, Widen L, Kesselberg M. Direct comparison of single-scan autoradiographic with multiple-scan least-squares fitting approaches to PET CMRO2 estimation. J Cereb Blood Flow Metab. 1988;8:671–680. doi: 10.1038/jcbfm.1988.114. [DOI] [PubMed] [Google Scholar]
- 18.Ohta S, Meyer E, Thompson CJ, Gjedde A. Oxygen consumption of the living human brain measured after a single inhalation of positron emitting oxygen. J Cereb Blood Flow Metab. 1992;12:179–192. doi: 10.1038/jcbfm.1992.28. [DOI] [PubMed] [Google Scholar]
- 19.Ho D, Feng D. Rapid algorithms for the construction of cerebral blood flow and oxygen utilization images with oxygen-15 and dynamic positron emission tomography. Comput Methods Programs Biomed. 1999;58:99–117. doi: 10.1016/S0169-2607(98)00069-8. [DOI] [PubMed] [Google Scholar]
- 20.Hattori N, Bergsneider M, Wu HM, et al. Accuracy of a method using short inhalation of (15)O-O(2) for measuring cerebral oxygen extraction fraction with PET in healthy humans. J Nucl Med. 2004;45:765–770. [PubMed] [Google Scholar]
- 21.Grubb RL, Jr, Derdeyn CP, Fritsch SM, et al. Importance of hemodynamic factors in the prognosis of symptomatic carotid occlusion. JAMA. 1998;280:1055–1060. doi: 10.1001/jama.280.12.1055. [DOI] [PubMed] [Google Scholar]
- 22.Yamauchi H, Fukuyama H, Nagahama Y, et al. Significance of increased oxygen extraction fraction in five-year prognosis of major cerebral arterial occlusive diseases. J Nucl Med. 1999;40:1992–1998. [PubMed] [Google Scholar]
- 23.Brix G, Zaers J, Adam LE, et al. Performance evaluation of a whole-body PET scanner using the NEMA protocol. National Electrical Manufacturers Association. J Nucl Med. 1997;38:1614–1623. [PubMed] [Google Scholar]
- 24.Boellaard R, van Lingen A, van Balen SC, Hoving BG, Lammertsma AA. Characteristics of a new fully programmable blood sampling device for monitoring blood radioactivity during PET. Eur J Nucl Med. 2001;28:81–89. doi: 10.1007/s002590000405. [DOI] [PubMed] [Google Scholar]
- 25.Boellaard R, Bremmer JP, van Berckel BN, et al. Impact of kinetic model design on the analysis of dynamic [15O]O2. J Cereb Blood Flow Metab. 2007;27:S1. doi: 10.1038/sj.jcbfm.9600334. [DOI] [Google Scholar]
- 26.Martin WR, Powers WJ, Raichle ME. Cerebral blood volume measured with inhaled C15O and positron emission tomography. J Cereb Blood Flow Metab. 1987;7:421–426. doi: 10.1038/jcbfm.1987.85. [DOI] [PubMed] [Google Scholar]
- 27.Tatu L, Moulin T, Bogousslavsky J, Duvernoy H. Arterial territories of the human brain: cerebral hemispheres. Neurology. 1998;50:1699–1708. doi: 10.1212/wnl.50.6.1699. [DOI] [PubMed] [Google Scholar]
- 28.Woods RP, Grafton ST, Holmes CJ, Cherry SR, Mazziotta JC. Automated image registration: I. General methods and intrasubject, intramodality validation. J Comput Assist Tomogr. 1998;22:139–152. doi: 10.1097/00004728-199801000-00027. [DOI] [PubMed] [Google Scholar]
- 29.Ito H, Kanno I, Fukuda H. Human cerebral circulation: positron emission tomography studies. Ann Nucl Med. 2005;19:65–74. doi: 10.1007/BF03027383. [DOI] [PubMed] [Google Scholar]
- 30.Coles JP, Fryer TD, Bradley PG, et al. Intersubject variability and reproducibility of 15O PET studies. J Cereb Blood Flow Metab. 2006;26:48–57. doi: 10.1038/sj.jcbfm.9600179. [DOI] [PubMed] [Google Scholar]
- 31.Yen YF, Field AS, Martin EM, et al. Test–retest reproducibility of quantitative CBF measurements using FAIR perfusion MRI and acetazolamide challenge. Magn Reson Med. 2002;47:921–928. doi: 10.1002/mrm.10140. [DOI] [PubMed] [Google Scholar]
- 32.Field AS, Laurienti PJ, Yen YF, Burdette JH, Moody DM. Dietary caffeine consumption and withdrawal: confounding variables in quantitative cerebral perfusion studies? Radiology. 2003;227:129–135. doi: 10.1148/radiol.2271012173. [DOI] [PubMed] [Google Scholar]
- 33.Koeppe RA, Hutchins GD, Rothley JM, Hichwa RD. Examination of assumptions for local cerebral blood flow studies in PET. J Nucl Med. 1987;28:1695–1703. [PubMed] [Google Scholar]
- 34.Rhodes CG, Lenzi GL, Frackowiak RS, Jones T, Pozzilli C. Measurement of CBF and CMRO2 using the continuous inhalation of C15O2 and 15O. Experimental validation using CO2 reactivity in the anaesthetised dog. J Neurol Sci. 1981;50:381–389. doi: 10.1016/0022-510X(81)90150-7. [DOI] [PubMed] [Google Scholar]
- 35.Raichle ME, Gusnard DA. Appraising the brain's energy budget. Proc Natl Acad Sci USA. 2002;99:10237–10239. doi: 10.1073/pnas.172399499. [DOI] [PMC free article] [PubMed] [Google Scholar]
- 36.Kudomi N, Hayashi T, Teramoto N, et al. Rapid quantitative measurement of CMRO(2) and CBF by dual administration of (15)O-labeled oxygen and water during a single PET scan-a validation study and error analysis in anesthetized monkeys. J Cereb Blood Flow Metab. 2005;25:1209–1224. doi: 10.1038/sj.jcbfm.9600118. [DOI] [PubMed] [Google Scholar]
- 37.Powers WJ, Martin WR, Herscovitch P, Raichle ME, Grubb RL., Jr Extracranial–intracranial bypass surgery: hemodynamic and metabolic effects. Neurology. 1984;34:1168–1174. doi: 10.1212/wnl.34.9.1168. [DOI] [PubMed] [Google Scholar]