Abstract
Recent studies have demonstrated that the expectation of reward delivery has an inverse relationship with operant behavioral variation (e.g., Stahlman, Roberts, & Blaisdell, 2010). Research thus far has largely focused on one aspect of reinforcement – the likelihood of food delivery. In two experiments with pigeons, we examined the effect of two other aspects of reinforcement: the magnitude of the reward and the temporal delay between the operant response and outcome delivery. In the first experiment, we found that a large reward magnitude resulted in reduced spatiotemporal variation in pigeons’ pecking behavior. In the second experiment, we found that a 4-s delay between response-dependent trial termination and reward delivery increased variation in behavior. These results indicate that multiple dimensions of the reinforcer modulate operant response variation.
At the most basic level, animals’ behavior is comprised of a minimum of two critical adaptive processes – variation and selection. While there is a great deal of research investigating the latter process, there is a relative paucity of data bearing on the former.
Much of the literature addresses behavioral variability as an explicitly reinforced dimension of behavior (i.e., as in operant conditioning; e.g., Cherot, Jones, & Neuringer, 1996; Denney & Neuringer, 1998; Page & Neuringer, 1985; Pryor, Haag, & O’Reilly, 1969). That is to say, the explicit reinforcement of variability in behavior increases variability in the same way that reinforcement of a rat’s bar-pressing behavior increases the subsequent likelihood of bar-pressing (see Neuringer, 2002, for an excellent review). The strength of the evidence for modulation of instrumental variability by explicit reinforcement of variance in behavior is undeniable.
Other research has established that variation in behavior typically increases during extinction procedures (e.g., Antonitis, 1951; Eckerman & Lanson, 1969), suggesting a number of factors that potentially modulate variability (e.g., reward expectancy, density of reinforcement, etc.). This source of variation contrasts to that of reinforced variability (e.g., Page & Neuringer, 1985) in that it is the explicit non-reinforcement of a particular behavior that drives these increases in variability. Though the effect of extinction on the form of behavior has been well known for many years, it was not until very recently that there was systematic investigation of the underlying mechanism of the relationship.
Neuringer (2004) writes, “Although some previous studies have indicated that infrequent reinforcement tends to increase variability, the effects are small and inconsistent… Thus, it is more important what one reinforces than how frequently” (p. 896). While this position certainly was defensible at the time, evidence has recently accumulated to suggest that the frequency of the reinforcer indeed has a critical and predictive relationship to the modulation of behavioral variability1. Recent work has indicated that the expected probability of appetitive reinforcement has an inverse relationship with variation of operant behavior in both behavior-dependent (Gharib, Derby, & Roberts, 2001; Gharib, Gade, & Roberts, 2004; Stahlman & Blaisdell, 2011; Stahlman, Roberts, & Blaisdell, 2010) and Pavlovian (Stahlman, Young, & Blaisdell, 2010) experimental conditions. Gharib et al. (2001) proposed a rule regarding this relationship: “[the] variation of the form of responses increases when the expected density of reward decreases” (p. 177). Gharib et al. (2004) postulated that this relationship allows organisms to optimize their appetitive behavior (e.g., foraging activity). It is obvious that animals would benefit from a mechanism that enabled them to exploit likely outcomes, while exploring alternative options when reward expectation is low. But do other factors besides reward probability influence reward expectation?
There are a number of associative features that are known to have systematic effects on the conditioned response. For example, animals are sensitive to the size or strength of the reward in conditioning preparations – typically, the greater the reward in a classical conditioning paradigm, the stronger the conditioned response will be after acquisition (e.g., Holland, 1979; Morris & Bouton, 2006). A number of learning models interpret the strength of the conditioned behavior to be indicative of the strength of the expectation of the unconditioned stimulus (US) signaled by the conditioned stimulus (CS) (e.g., Daly & Daly, 1982; Rescorla & Wagner, 1972). These models indicate that training with a larger US will instantiate more-rapid learning and a greater conditioned response at asymptotic levels of behavior. Additionally, manipulations of reward magnitude have been shown to affect the perception of hedonic properties of reward (e.g., contrast effects; Crespi, 1942; Mellgren & Dyck, 1974; Papini, Ludvigson, Huneycutt, & Boughner, 2001), choice and discrimination acquisition (Capaldi, Alptekin, & Birmingham, 1997; Davenport, 1970; Rose, Schmidt, Grabemann, & Güntürkün, 2009), and resistance to extinction (Capaldi & Capaldi, 1970; Davidson, Capaldi, & Peterson, 1982; Leonard, 1969; Morris & Capaldi, 1979; Papini & Thomas, 1997).
The temporal relationship between a predictive event and a reward also modulates behavioral strength. The insertion of a time delay between the termination of the CS and the delivery of the appetitive US (i.e., trace conditioning) typically weakens the strength of the conditioned response (CR), relative to delay-conditioning procedures that do not feature this temporal gap (Marlin, 1981; Lucas, Deich, & Wasserman, 1981, Pavlov, 1927). In instrumental conditioning, conditioned behavior is strongest if the reinforcer immediately follows the behavior (Ainslie, 1974; Capaldi, 1978; Campbell & Church, 1969). Hume (1964/1739) suggested that temporal contiguity is critical in the establishment of associations between events; the insertion of a gap in time between a predictive event and an outcome results in a reduced ability to assign a causative relationship between the two.2
Prior research investigating the effect of signal value on behavioral variation has focused on manipulations of the probability of reward at trial termination (Gharib et al., 2004; Stahlman et al., 2010a; Stahlman et al., 2010b; Stahlman & Blaisdell, 2011). Gharib et al. suggested that these manipulations of probability affect animals’ expectations of reward. As expectation of reward increases, the variation of behavior decreases (and vice versa). Conceivably, other manipulations of reward properties, such as magnitude and delay to reward, may also modulate expectation in the same manner as reward probability (see Ainslie, 1975; Carlton, 1962; Mazur, 1993, 1997; Rachlin, 1974). If these additional factors contribute to the calculation of expectation, manipulating these variables should predictably modulate behavioral variation.
We conducted two experiments to examine the effects of reward magnitude, delay, and probability on spatiotemporal operant variation in a screen-pecking procedure in pigeons modified on that of Stahlman et al. (2010a). In the first experiment, we examined the effect of manipulating reward magnitude and reward probability; in the second experiment, we examined the effect of manipulating reward delay and reward probability. We anticipated that operant variation would increase with small rewards and delayed reward, respectively. We also expected to replicate the effect of lower probabilities of reward engendering higher degrees of operant variation.
Experiment 1
We examined whether differential reward size had a systematic effect on the production of behavioral variation in operant screen-pecking in pigeons. We instrumentally trained pigeons to peck to a set of five discriminative stimuli (only one present on each trial) – each discriminative stimulus was associated with a specific probability and magnitude of reward. We conducted a 2×2 within-subjects factorial design with reward probability (12.5% vs. 4.4%; cf. Stahlman, Roberts, & Blaisdell, 2010a) and reward magnitude (25.2 s vs. 2.8 s of hopper access) as experimental factors. A fifth discriminative stimulus was reinforced at 100% probability for 2.8 s to serve as an anchor for floor levels of behavioral variation, and to replicate the condition in our prior research that engendered the lowest amount of variation. We predicted that pigeons would exhibit greater spatial and temporal variation in operant screen pecking to discriminative stimuli associated with lower expectation of reward as determined by low-probability and low-magnitude situations.
Method
Subjects
One male White Carneaux and five male racing homer pigeons (Columba livia; Double T Farm, Iowa) served as subjects. Each bird had previously been trained to peck at the touchscreen using a combined Pavlovian/instrumental training regimen, and had received training on the preliminary study (mentioned above) examining the effect of reward probability and magnitude on variation in behavior. Pigeons were maintained at 80-85% of their free-feeding weight. They were individually housed with a 12-hr light-dark cycle and had free access to water and grit. The experiment was conducted during the light portion of the cycle.
Apparatus
Testing was done in a flat-black Plexiglas chamber (38 cm × 36 cm × 38 cm). Stimuli were generated on a color monitor (NEC MultiSync LCD1550M) visible through a 23.2 × 30.5 cm viewing window in the middle of the front panel of the chamber. Stimuli consisted of red, blue, yellow, green, and magenta circular discs, 5.5 cm in diameter. At the center of each disc was a small, black dot (2 mm in diameter). The bottom edge of the viewing window was 13 cm above the chamber floor. Pecks to the monitor were detected by an infrared touchscreen (Carroll Touch, Elotouch Systems, Fremont, CA) mounted on the front panel. A 28-V house light located in the ceiling of the chamber was on at all times. A food hopper (Coulbourn Instruments, Allentown, PA) was located in the center of the front panel, its access hole flush with the chamber floor. Each raise of the hopper allowed for 2.8 s of grain availability as reinforcement. Experimental events were controlled and recorded with a Pentium III computer (Dell, Austin, TX). A video card controlled the monitor in SVGA graphics mode (800 × 600 pixels). The resolution of the touchscreen was 710 horizontal by 644 vertical units.
Procedure
A trial consisted of the presentation of one of the five colored discs in the center of the computer touchscreen. Each colored disc was randomly selected and was equally likely (20% chance) to occur on any trial. Each response to the disc had 20% likelihood for the immediate termination of the trial (random ratio [RR]-5 schedule); off-disc responses had no effect. The disc onset at the beginning of the trial and was removed from the screen at the termination of the trial, prior to the delivery of reinforcement or the start of the ITI. Trials were terminated only upon the bird reaching the response criterion for that trial, and were followed with a 30 s ITI.
For each bird, individual colored discs were associated with a specific probability of reward delivery and reward magnitude at the termination of a trial. The relevant experimental design consisted of two levels of each of these variables – 12.5% vs. 4.4% (i.e., High vs. Low) for reward probability, and 9 vs. 1 hopper raises (resulting in 25.2 s and 2.8 s of reinforcement [i.e., Large and Small], respectively) for reward magnitude. The four possible combinations of these parameters were each randomly assigned across subjects to one of each of the five color possibilities. The final trial type consisted of a single grain reinforcement period with 100% probability; this trial type was assigned to the last remaining color type available. The inclusion of this trial type resulted in an overall reward probability density similar to that delivered in prior experiments (Stahlman et al., 2010a). Each session lasted 60 min. There were 163 experimental sessions, with a mean of approximately 50 trials per session.
Measures
The touchscreen recorded discrete (i.e., non-continuous) spatial locations of pecks; to make the data continuous, we added a small random value to the x and y values of each response. This method, called “jittering,” is commonly utilized to break ties in discrete measures (see Stahlman et al., 2010a, 2010b). The maximal value of this random value brought the calculated location of the response to a maximum of half the distance to the nearest adjacent pixel along the relevant axis (i.e., x- or y- axis).
We had empirical reason to believe that we would find differential effects of reinforcement on variation along the two primary spatial axes; specifically, response variation along the x-axis in this preparation has been found to be more sensitive to reward probability than variation along the y-dimension (Stahlman et al., 2010a). Therefore, we calculated the standard deviations of response location during trials within session on each of both the x- and y-axes of the touchscreen; this served as our measure of spatial variation (cf. Stahlman et al., 2010a). Responses to the touchscreen during the ITI (i.e., when the screen was completely blank) were not recorded.
Because interresponse times (IRTs) were positively skewed, we performed a log10 transform to normalize the data prior to analysis (cf. Stahlman et al., 2010b; for a discussion on the importance of transformations, see also Roberts, 2008; Tukey, 1977). We then calculated the standard deviation of log IRT within session as our measure of temporal variation.
We were primarily interested in the post-acquisition effects of reward probability on behavior. Early in training, the pigeons would not have learned the differential payoffs across stimuli, and therefore the inclusion of early sessions would have been uninformative. We measured the raw total of responses that each bird made in each session at the beginning of the experiment; once each bird had had a session with at least 200 responses, we began the pre-data period of 10 sessions. Our analysis was comprised of the pooling of all sessions conducted after the pre-data period. As a result, we report data collected from the last 143 sessions.
Results and Discussion
We were interested in conducting 2×2 factorial analyses of variance along the relevant dimensions of reward to ascertain main effects and the interaction between factors. Prior research (Stahlman et al., 2010a) had indicated that the variability of pigeons’ operant behavior did not systematically differ between reward probabilities of 100% and 12.5% with a small reward, indicating that we could potentially remove the 100%/2.8s trials from consideration when conducting our analyses in this study. A repeated-measures one-way ANOVA restricting analysis to only the 100%/2.8s, 12.5%/2.8s, and 4.4%/2.8s trial types (i.e., varying only in probability of reward) produced significant effects in x-location variation (F(2,10) = 10.64, p < 0.01), y-location variation (F(2,10) = 4.38, p < 0.05), and temporal variation, F(2,10) = 9.88, p < 0.01. Planned comparisons found that the 4.4% trials elicited significantly more variation in x-location, y-location, and log IRT than the 100% trials, all ps < 0.05; the 4.4% trials elicited greater variation in x-location and log IRT than 12.5% trials, all ps < 0.01. Importantly, and as expected, there were no differences in variation in any response measure in a comparison of 100% and 12.5% trials, ps > 0.10. These results replicate prior findings from our lab (Stahlman et al., 2010a) that demonstrate that the variability of pigeons’ operant behavior is unaffected by reward probabilities at or above 12.5% when reward is small (i.e., 2.8s of grain access). Therefore, for all analyses listed below, we omitted the 100%/2.8s trial data and conducted 2×2 factorial analyses of variance along the two experimental dimensions of reward (i.e., probability and magnitude).
Spatial Variation
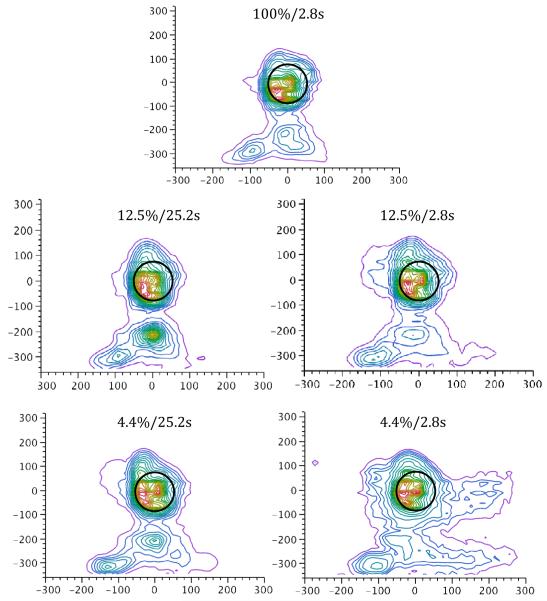
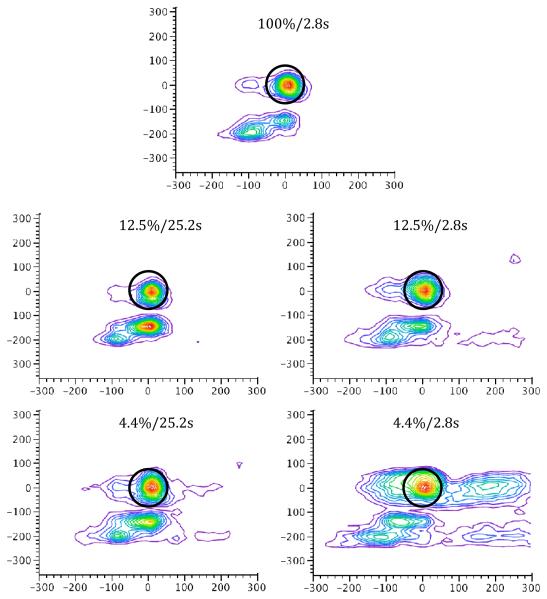
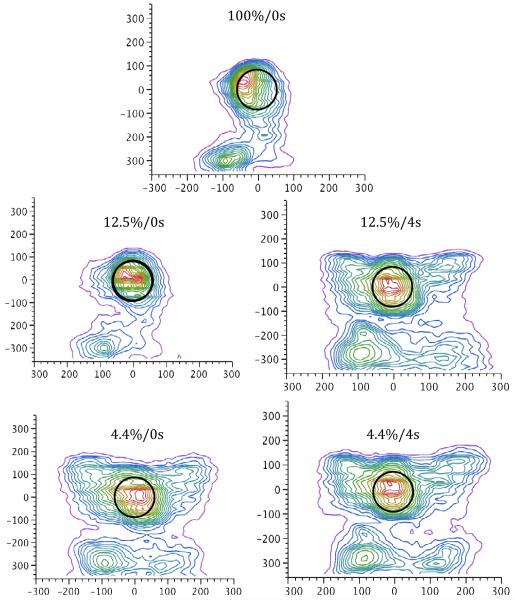
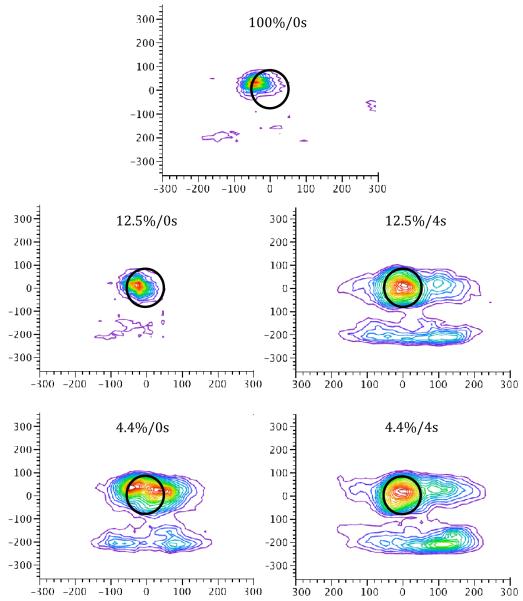
Figures 1 and 2 illustrate the topographical distribution of responses across the touchscreen for the mean over subjects and for a selected individual, respectively, during each of the five experimental trial types. As anticipated, the spread of responses across the touchscreen is largely localized around each of the stimulus targets – however, responses are distributed more widely across the screen on 4.4%/2.8s trials. The mean location of responses on both the x- and y- axes did not systematically differ with reinforcement condition (ps > 0.19); that is to say, responses were centered at the same spatial location, regardless of the trial type. Response variation along the y-axis did not systematically differ with trial type3 (p > 0.05). However, a repeated-measures ANOVA found a significant effect of reward probability on x-axis variation (F(1,5) = 9.44, p < 0.05, η2 = 0.034), and a significant Probability x Magnitude interaction (F(1,5) = 7.31, p < 0.05, η2 = 0.007). There was a marginal effect of magnitude, F(1,5) = 5.95, p = 0.06, η2 = 0.028. A Tukey HSD post-hoc test indicated that x-axis variation was greater in the 4.4%/2.8s condition (mean = 57.2) than the other conditions, which did not differ from one another (grand mean = 41.2).
Figure 1.
Nonparametric density plots illustrating the mean spatial location of pecks on the touchscreen for each trial type, collapsed across subject. The peck density plot models a smooth surface that describes how dense the data points are at each point in that surface and functions like a topographical map. The plot adds a set of contour lines showing the density in 5% intervals in which the densest areas are encompassed first. The black circle indicates the location and size of the stimulus disc, which is centered at (0,0). Units on both x- and y-axes are in pixels. The JMP (Version 8, SAS Institute Inc., Cary, NC) bivariate nonparametric density function was used to generate these plots.
Figure 2.
Nonparametric density plots illustrating the spatial location of pecks on the touchscreen on each trial type for a representative individual subject in Experiment 1.
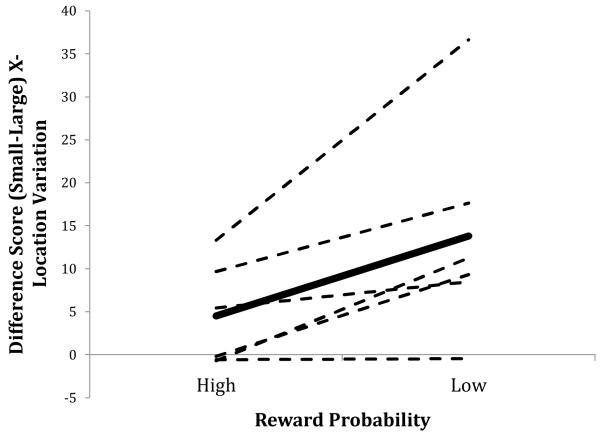
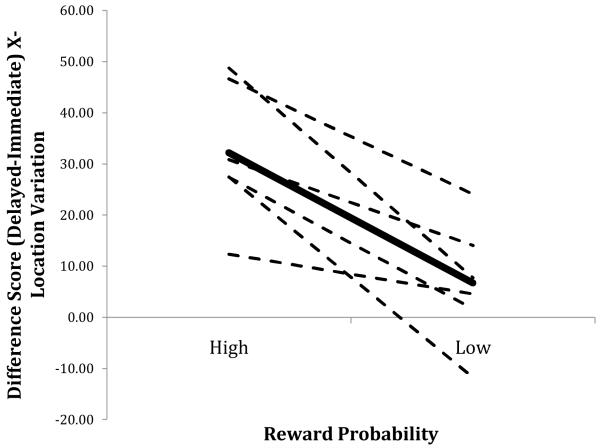
For each bird, we calculated difference scores within each of the two levels of reward probability by subtracting the x-variation value on Large magnitude (i.e., 25.2 s of reinforcement) trials from the value obtained on Small magnitude (i.e., 2.8 s) trials. A positive value of this measure, for example, indicates relatively greater variation on Small trials; significantly different values of this measure across the two levels of reward probability (i.e., 12.5% and 4.4%) indicate an interaction between reward probability and magnitude. Figure 3 depicts this interaction between reward probability and magnitude on spatial variation.
Figure 3.
Mean difference score of the mean standard deviation of x-axis response location as a function of reward probability (High = 12.5%, Low = 4.4%; Large = 25.2 s reward, Small = 2.8 s reward). Values were obtained by subtracting each bird’s mean variation on Large trials from their variation on Small trials for each level of reward probability. The dashed lines indicate individual birds; the solid line indicates the mean across birds.
Temporal Variation
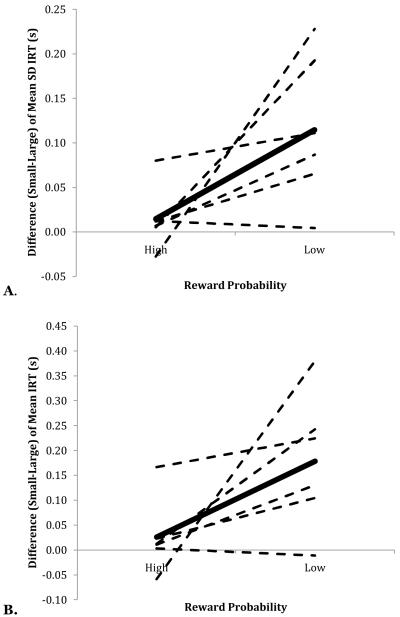
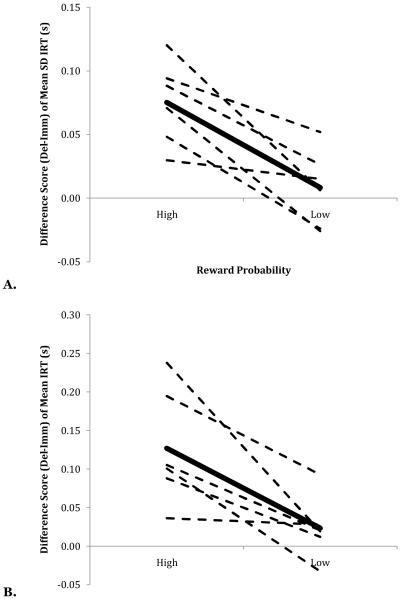
A repeated-measures ANOVA on standard deviations of log IRT scores found a main effect of probability, F(1,5) = 10.51, p < 0.05, η2 = 0.056, a main effect of magnitude, F(1,5) = 16.54, p < 0.01, η2 = 0.053, and a significant Probability x Magnitude interaction, F(1,5) = 6.79, p < 0.05, η2 = 0.031. A Tukey post-hoc test indicated that the 4.4%/2.8s condition produced greater variation in behavior (mean = 0.45) than the other three conditions, which did not differ from one another (grand mean = 0.33). Figure 4A depicts the interaction between reward probability and magnitude in the production of temporal variation of operant behavior.
Figure 4.
A. Mean difference score of the mean standard deviation of log IRT as a function of reward probability. B. Mean difference score of the mean log IRT as a function of reward probability. (High prob = 12.5%, Low prob = 4.4%; Large = 25.2 s reward, Small = 2.8 s reward). Values were obtained by subtracting each bird’s mean score on Large trials from their score on Small trials for each level of reward probability. The dashed lines indicate individual birds; the solid line indicates the average across birds.
Response Rates
A repeated-measures ANOVA of the mean log IRT as a function of probability and magnitude of reinforcement revealed a main effect of probability, F(1,5) = 12.77, p < .05, η2 = 0.051; a main effect of reward magnitude, F(1,5) = 8.56, p < .05, η2 = 0.050; and a Probability x Magnitude interaction, F(1,5) = 9.82, p < .05, η2 = 0.028 (Fig. 4B). A Tukey HSD post-hoc test revealed that the log IRT in the 4.4%/2.8s condition (mean = −0.054) was significantly greater than the other conditions (mean = −0.229).
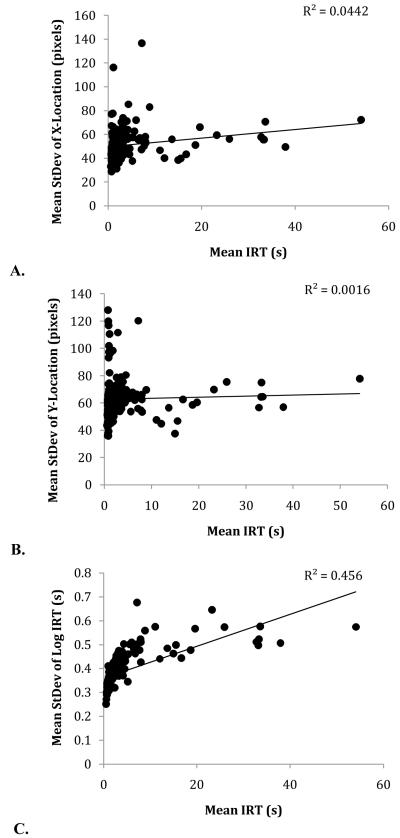
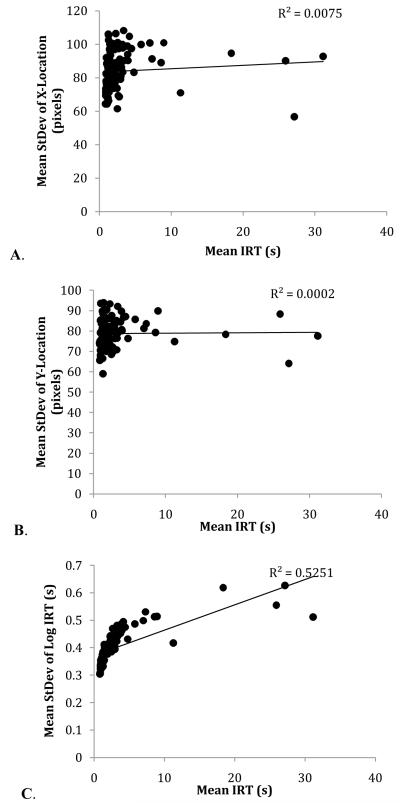
It was possible that this difference in response rates may account for differences in operant variation over trial types; to examine this possibility, we conducted linear mixed-effects analyses of the slope of the relation between mean IRT and x-variation, y-variation, and log IRT variation (cf. Stahlman et al., 2010b). There was no relationship between peck rate and x-variation, F(1,5) = 3.64, p=0.12; there was no relationship between peck rate and y-variation, F(1,5) = 3.06, p=0.16; but there was a significant relationship between peck rate and log IRT variation, F(1,5) = 7.05, p < 0.05 (Fig. 5). This replicates effects previously reported in Stahlman et al.; operant variation in the temporal domain is potentially explicable directly in terms of response rates, while spatial operant variation is not.
Figure 5.
Scatterplots of the mean x-variation (A), y-variation (B), and log IRT variation (C) as a function of mean IRT in Experiment 1. Each point corresponds to an individual session mean over six birds.
In summation, we replicated the results of Stahlman et al. (2010a), who found operant variation in the temporal domain to be negatively related to reinforcement probability. Additionally, we found that reward size had a negative relationship with spatial and temporal operant variation. Importantly, these two factors interacted with each other, such that increased reward magnitude results in reduced variation in behavior at a low probability of reinforcement.
This experiment demonstrates that reward size impacts operant variation in the same manner as reward probability (e.g., Stahlman et al., 2010a). Operant variation decreases with increasing reward size, as well as with increasing reward probability. Importantly, we have also demonstrated that the production of variation is modulated by the interaction of the two aspects of reinforcement. This finding supports a logical extension of the Gharib et al. (2001) rule relating operant variation to reward expectation. Importantly, it supports the idea that multiple stimulus factors can influence variation by modulating reward expectation.
Experiment 2
Animals are sensitive to the interval between an action (or cue) and the delivery of a reward. In general, the strength of the instrumental response tends to deteriorate with longer delays to reward (Capaldi, 1978; Campbell & Church, 1969). There is some empirical evidence to suggest that a temporal delay to reinforcer delivery in an operant task may increase the variability of pigeons’ terminal behavior. In a key-pecking task in pigeons, Schaal, Shahan, Kovera, and Reilly (1998, Exp. 3) observed that variability in the latency to consume grain reward was greater when there was a 3-s interval between an operant response (i.e., the key peck) and the delivery of grain than when grain was delivered immediately after the response. Other studies have demonstrated that pigeons reinforced for performing a stereotyped sequence of pecks become more variable within the sequence when a delay is inserted between the terminal response and reinforcement (e.g., Odum, Ward, Barnes, & Burke, 2006).
We examined whether delay to reward signaled by different discriminative stimuli would have a similar, systematic effect on operant variation on a single stimulus target. We conducted a 2 × 2 within-subjects factorial design with two levels of reward probability (High [12.5%] and Low [4.4%]) and two levels of temporal delay of reward (Immediate [0 s] and Delayed [4 s]). We expected to replicate findings that indicated that higher levels of variation are instantiated with lower probability of reward (e.g., Stahlman et al., 2010a). Additionally, we predicted that placing a delay between the instrumental pecking response that ended a trial and the delivery of reward would result in higher variation in pigeons’ pecking behavior. Finally, we predicted that reward probability and delay to reward would interact, such that the insertion of a temporal delay prior to reward would mitigate the effect of high reward likelihood.
Method
Subjects
Three male White Carneaux and three male racing homer pigeons (Columba livia; Double T Farm, Iowa) served as subjects. The birds had varied prior experimental histories with blocking, choice, counterconditioning, and/or operant key-pecking procedures. Subjects were carefully selected to ensure that their prior experience did not have an impact on the current experiment. Pigeons were maintained in the same conditions as in Experiment 1.
Apparatus
The experimental apparatus was the same as in Experiment 1, except for the color of the stimuli that the pigeons experienced. Experimental stimuli consisted of pink, maroon, aqua, dark blue, and gray discs. These colors were chosen because of their dissimilarity to stimuli with which the pigeons had prior experience. All other contextual factors were the same as in Experiment 1.
Procedure
Trials were conducted in much the same manner as in Experiment 1, with differences noted below.
For each bird, individual colored discs were associated with a specific probability of reward and temporal delay to reinforcement at the termination of a trial. The relevant experimental design consisted of two levels of each of these variables – 12.5% vs. 4.4% (i.e., Large vs. Small) for reward probability, and 0 s vs. 4 s (i.e., Immediate vs. Delayed) between the trial termination and reward delivery. The four possible combinations of these parameters were each randomly assigned to one of each of the five color possibilities. The fifth disc was the same as in Experiment 1 (i.e., 100%/0 s). There were 120 60-min experimental sessions.
Prior to the inception of the final experimental procedure, the pigeons received a systematic training regimen. For the first five sessions, reaching response criterion on each of the five trial types was immediately reinforced with grain delivery. During the next two sessions, the probability of reinforcement on each of the four main experimental trials (i.e., excluding the 100% probability trial) was reduced to 50%. Following these sessions, the reward probabilities were reduced to the final experimental levels, and the temporal delay for the Delayed condition was instituted for all remaining sessions. On Delayed trials, the disc was removed from the screen when the pigeon’s peck reached the criterion to end the trial. There was then a four-second period with a blank screen between termination of the disc and delivery of reinforcement.
Measures
We calculated the same measures as in Experiment 1. Our analysis was comprised of all sessions conducted after the pre-data period. As a result, we report results from the last 101 sessions.
Results and Discussion
As in Experiment 1, we were interested in conducting 2 × 2 analyses of variance across the levels of the two relevant factors (i.e., reward probability and temporal delay). We conducted repeated-measures one-way ANOVAs on spatial and temporal operant variation, restricting the analysis to only the 100%/0s, 12.5%/0s, and 4.4%/0s trial types (i.e., with only reward probability as the relevant difference between trial types). We obtained significant effects of reward probability on x-location variation (F(2,10) = 16.2, p < 0.001) and IRT variation (F(2,10) = 34.6, p < 0.001); there was no significant effect of probability on y-location variation, p = 0.31. Planned comparisons found that the 4.4% trials elicited significantly more variation in x-location and log IRT than 100% trials, ps < 0.05; the 4.4% trials elicited greater variation in x-location and log IRT than 12.5% trials, ps < 0.01. There were no differences in variation in any response measure in a comparison of 100% and 12.5% trials, ps > 0.94. Once again, this replicates prior work (Stahlman et al., 2010a) that demonstrates that a reduction from 100% to 12.5% reward probability (with a small, fixed reward) is insufficient to produce differences in pecking variability in pigeons. Therefore, for all analyses below, we omitted the 100%/0s condition and conducted 2×2 factorial analyses across the factors of reward probability and temporal delay to reinforcement.
Spatial Variation
Figures 6 and 7 illustrate the topographical distribution of responses across the touchscreen for the mean over subjects and for a selected individual, respectively, during each of the five trial types. Responses for the 12.5%/0s trial type are noticeably more concentrated about the disc than each of the other three conditions. As in Experiment 1, the mean location of responding on the x-axis did not differ across reinforcement condition (p > 0.20). There was a main effect of delay on the mean spatial location of responding along the y-axis, F(1,5)=10.38, p < 0.05, but no effect of reward probability nor interaction, ps > 0.23; the spatial location of the peck response was lower on the touchscreen on delay trials (mean = 41.0 pixels below the center of the stimulus target) than on immediate trials (mean = 26.9).
Figure 6.
Peck density plots for each of the four trial combinations in Experiment 2 illustrating the mean spatial location across subjects. The black circle indicates the location and size of the stimulus disc, which is centered at (0,0). Units on both x- and y-axes are in pixels.
Figure 7.
Nonparametric density plots illustrating the spatial location of pecks on the touchscreen on each trial type for a representative subject in Experiment 2.
We found a significant main effect of reward probability (F(1,5) = 6.81, p < 0.05, η2 = 0.086), reward delay (F(1,5) = 19.1, p < 0.01, η2 = 0.096), and a significant Probability x Delay interaction, F(1,5) = 23.6, p < 0.01, η2 = 0.038. A Tukey HSD post-hoc test indicated that the 12.5%/0s condition (mean = 46.0) produced a smaller amount of variation as compared to the other three conditions, which did not differ from one another (mean = 80.1). Figure 8 depicts the interaction of the experimental factors.
Figure 8.
Mean difference score of the mean standard deviation of x-axis response location as a function of reward probability. (High prob = 12.5%, Low prob = 4.4%; Imm = 0-s delay, Del = 4-s delay). Values were obtained by subtracting each bird’s mean variation on Immediate trials from their variation on Delayed trials for each level of reward probability. The dashed lines indicate individual birds; the solid line indicates the mean across birds.
Temporal Variation
A repeated-measures ANOVA found significant main effects of reward probability (F(1,5) = 12.96, p < 0.05, η2 = 0.047) and reward delay (F(1,5) = 15.83, p < 0.05, η2 = 0.031) on temporal operant variation, as well as a significant Probability x Delay interaction, F(1,5) = 20.8, p < 0.01, η2 = 0.020. A Tukey HSD post-hoc test indicated that the 12.5%/0s condition (mean = 0.30) produced significantly reduced operant variation compared to the other three conditions, which did not differ from one another (mean = 0.39; see Figure 9A).
Figure 9.
A. Mean difference score of the mean standard deviation of log IRT as a function of reward probability. B. Difference of the mean log IRT as a function of reward probability. (High prob = 12.5%, Low prob = 4.4%; Imm = 0-s delay, Del = 4-s delay). Values were obtained by subtracting each bird’s mean score on Immediate trials from their score on Delayed trials for each level of reward probability. The dashed lines indicate individual birds; the solid line indicates the average across birds.
Response Rates
The effect of delay to reinforcement on log interresponse time was significant, F(1,5)=8.61, p<0.05, η2 = 0.048, with 0-s delay trials producing greater rates of response than 4-s delay trials. We also obtained a significant interaction between the probability and delay of reinforcement, F(1,5)=20.20, p < 0.01, η2 = 0.023. A Tukey HSD test revealed that the response rate on 12.5%/0s trials (mean= −0.22) was significantly lower than the rates during the other three stimuli (mean = −0.09), all of which did not differ from one another (p < 0.05; see Figure 9B).
As in Experiment 1, we conducted linear mixed-effect analyses of the slope of the relation between the mean IRT and x-, y-, and IRT variation in behavior. As in Experiment 1, we found that response rates have a significantly predictive relationship with temporal variation (F(1,5) = 21.2, p < 0.01), but not with x-variation (F(1,5) = 3.11, p=0.15) nor y-variation, F(1,5) = 1.25, p = 0.33 (Figure 10). This indicates that although our temporal variability measures may be explicable in terms of differential response rates, spatial variability is not.
Figure 10.
Scatterplots of the mean x-variation (A), y-variation (B), and log IRT variation (C) as a function of mean IRT in Experiment 2. Each point corresponds to an individual session mean over six birds.
This experiment demonstrates that the spatiotemporal variation of operant behavior is modulated by temporal delay to reinforcement. The insertion of a 4-s delay between the termination of a trial and delivery of reward increased the spread of behavior in both the temporal and spatial domains. Critically, we obtained the key interaction between probability and delay to reinforcement – we found that delay to reinforcement only increased operant variation on high-probability trials. On low-probability trials, inserting a delay to reinforcement did not increase variation beyond levels measured on trials with immediate reinforcement—presumably because operant variation was already at ceiling levels in the low-probability, immediate reward condition (see Stahlman et al., 2010a).
The results of this experiment are especially interesting considering that the key novel manipulation (i.e., temporal delay) was not one that ultimately affected the overall reward density that the birds experienced. Of course, there have been many studies that have demonstrated that delay to reinforcement does affect response strength (e.g., Grice, 1948; Lucas et al., 1981); however, most studies have not explicitly examined the topic of operant variation. Other manipulations that have investigated operant variation and expectation have focused on differential probability of reinforcement (Gharib et al., 2001; Gharib et al., 2004; Stahlman et al., 2010a).
General Discussion
Over two experiments, we illustrated that operant variation in both spatial and temporal domains is modulated by reward probability, magnitude, and delay to reinforcement. Our findings replicate previous work that explored the modulation of variation by reward probability. Prior work has illustrated that the strength of behavior (e.g., response rate, response probability) is directly related to the interplay between these dimensions of the reinforcing stimulus (Green, Fisher, Perlow, & Sherman, 1981; Davidson, Capaldi, & Myers, 1980; Leon & Gallistel, 1998; Minamimoto, La Camera, & Richmond, 2009; Perkins, 1970; Shapiro, Siller, & Kacelnik, 2008). To our knowledge, this is the first systematic study explicitly investigating the interaction of reward probability with reward magnitude and temporal delay specifically on the production of operant variation.
On the Causal Relationship of Strength and Variation
The same factors that influence operant response strength (e.g., the magnitude or probability of reward) also influence the variation of that response. Recognizing this correlation does not imply a causal structure to the relationship. In prior work (Stahlman et al., 2010b), reviewers have suggested that a simple reduction in response strength could explain the increase in behavioral variation. We believe that this logic, albeit reasonable, is incomplete. After all, it is conceivable that causal direction could just as likely go in the opposite direction – in other words, animals may increase the variation of their foraging behavior when confronted with less-than-favorable odds of success, and that this increase in variation is the origin for a decreased response rate.
The relationship between behavioral variability and response rate is not a simple or fixed relationship. Some research has found a correlation between increased variability and decreased response rate (e.g., Gharib et al., 2004; Neuringer, Kornell, & Olufs, 2001; Stahlman et al., 2010b). Other work has found that variability can increase in the absence of change in response rate (Stahlman et al., 2010a), while there are yet other data to indicate that reduced response rates have negligible effects on behavioral variability (Grunow & Neuringer, 2002; Wagner & Neuringer, 2006). These findings clearly indicate that it is possible, under some circumstances, to dissociate the rate of response from the variability of the response. As such, the most appropriate synopsis of the principal findings of the current paper is that the multiple relevant factors of the expected outcome modulate both the variation and the rate of the pecking response. Indeed, analyses from both Experiments 1 and 2 indicate that although the strength of the operant (i.e., response rate) has a significantly predictive relationship with temporal variation (i.e., standard deviation of log IRT), it is not predictive of spatial variation (i.e., standard deviation of x- or y-location of responses).
A current account of response strength, the behavioral momentum model (e.g., Nevin, 1984, 1992; Nevin, Mandell, & Atak, 1983; see Nevin & Grace, 2000, for a review), provides a clear framework to understand the relevant differences between response rate and variability in behavior. The model suggests that while response rate is indicative of the response-reinforcer relationship (i.e., an instrumental relationship), the resistance of a particular behavior to change is indicative of the strength of stimulus-outcome relations (i.e., a Pavlovian relationship). These two aspects of behavior are readily dissociable (e.g., Nevin, Tota, Torquato, & Shull, 1990). Our experimental results, discussed in terms of the behavioral momentum model, would indicate that the differences we obtained in response rates over trial types is due to the instrumental contingency between the key-peck response and the subsequent level of reinforcement; however, the differences in variability of the response may instead be attributable to the differences between individual target stimuli with respect to their relationship to reinforcement. Behavior under comparatively low-reward conditions has been found to be less resistant to change than behavior under high-reward conditions; variability in behavior on low-reward trials may therefore be explicable in terms of a reduced resistance to change in those behaviors relative to behavior that is engendered by high-reward conditions. This account suggests that differences (both interoceptive and exteroceptive) in experimental circumstances, across and within sessions, may have a comparatively larger effect on modifying behavior on low-reward trials. This would result in relatively high variability on low-reward trials, while high reward trials would remain relatively stable over varying conditions.
Modulation of Variability by Multiple Reward Factors
The idea that conditioned behavior is dependent on a variety of reward outcome factors is not new. A review of the literature led Tolman (1932) to suggest that the strength of performance is dependent on reward expectation (though he declined to elucidate how these expectations were formed). In an early theory of learning, Hull (1943) described S-R habit strength as modulating the amount and delay of reinforcement; the model suggests that large rewards and short delays engender greater response strength. In an early theory with cognitive undertones, Pavlov (1927) suggested that excitatory learning occurred when a CS became a surrogate for the presentation of the US. Konorski (1967) echoed this idea and reaffirmed the importance of the ability for the CS to elicit a representation of the US through the CS-US association. Konorski recognized that stimulus events (e.g., Pavlovian CSs and instrumental discriminative stimuli) are not unitary in nature, but instead are multifaceted—consisting of specific sensory features of the reward and their affective components (see also Balleine, 2001; Dickinson & Balleine, 1994). Konorski also suggested that the strength and form of conditioned behavior was determined by the interplay between these individual stimulus factors, effectively foreshadowing the findings we have discussed at length within the body of this paper.
In our experiments, the pigeons discriminated between stimuli based on their predictive value with respect to reward probability (Experiments 1 & 2; see also Stahlman et al., 2010a, 2010b), reward magnitude (Expermiment 1), and delay to reinforcement (Experiment 2). Importantly, operant variation is dependent on the interaction between these stimulus dimensions. These results, found in a novel response measure, add validity to the classic understanding that reward expectation is dependent on the multiple relevant stimulus factors of the outcome.
Summary
Our findings demonstrate that operant variation is modulated by a host of associative factors, including the probability, magnitude, and timing of reward. Specifically, these two experiments support and extend the Gharib et al. (2001) rule relating reward expectation and variation to reward magnitude and delay to reinforcement. In each case, we found that a reduction in reward expectancy resulted in an increase in the spatial and temporal distribution of operant responding to the discriminative stimulus. These results have implications for the study of foraging behavior and appetitive behavior in general.
Acknowledgments
This research was supported by Grant NS059076 (Blaisdell). We thank Michael Young for his advice on data analyses. We thank Alvin Chan, Dustin Le, Cynthia Menchaca, Charlton Ong, and Sarah Sandhaus for their assistance in conducting experimental sessions. We thank Anthony Dickinson, Tony Nevin, Bill Roberts, and two anonymous reviewers for their helpful comments. This research was conducted following the relevant ethics guidelines and approved by UCLA’s Animal Care and Use Committee.
Footnotes
A reviewer was correct to point out that variability in behavior can be predictably generated through other means than explicit reinforcement of variability or non-reinforcement of a behavior. Research has demonstrated that the variability of the operant response is likely dependent on the schedule of reinforcement (i.e., ratio vs. interval; e.g., Boren, Moerschbaecher, & Whyte, 1978; Eckerman & Lanson, 1969; Ferraro & Branch, 1968; Herrnstein, 1961). Also, there is good reason to suspect that variability in adjunctive behaviors is modulated according to different rules (see Staddon, 1977; Staddon & Simmelhag, 1971; Timberlake, 1993; Timberlake & Lucas, 1985). The focus of this paper is solely on the variability of a terminal operant response (i.e., the key-peck), and not adjunctive behavior (i.e., behavior during the ITI).
This traditional view of the effect of temporal contiguity on learning has been challenged in recent years. For example, the temporal coding hypothesis suggests that animals learn the temporal relationship between related events (Barnet, Arnold, & Miller, 1991; Savastano & Miller, 1998). Much evidence has accumulated in favor of this view of conditioning (e.g., Barnet & Miller, 1996; Blaisdell, Denniston, & Miller, 1998, 1999; Leising, Sawa, & Blaisdell, 2007; see also Arcediano & Miller, 2002, for a review).
This is in contrast to the analyses initially performed prior to the exclusion of the 100%/2.8s trials. The elimination of this trial type in conjunction with the performance of the factorial ANOVA resulted in a loss of this effect.
References
- Ainslie GW. Impulse control in pigeons. Journal of the Experimental Analysis of Behavior. 1974;21:485–489. doi: 10.1901/jeab.1974.21-485. [DOI] [PMC free article] [PubMed] [Google Scholar]
- Ainslie GW. Specious reward: A behavioral theory of impulsiveness and impulse control. Psychological Bulletin. 1975;82:463–496. doi: 10.1037/h0076860. [DOI] [PubMed] [Google Scholar]
- Antonitis JJ. Response variability in the white rat during conditioning, extinction, and reconditioning. Journal of Experimental Psychology. 1951;42:273–281. doi: 10.1037/h0060407. [DOI] [PubMed] [Google Scholar]
- Arcediano F, Miller RR. Some constraints for models of timing: A temporal coding hypothesis perspective. Learning and Motivation. 2002;33:105–123. [Google Scholar]
- Balleine BW. Incentive processes in instrumental conditioning. In: Mowrer R, Klein S, editors. Handbook of contemporary learning theories. LEA; Hillsdale, NJ: 2001. pp. 307–366. [Google Scholar]
- Barnet RC, Arnold HM, Miller RR. Simultaneous conditioning demonstrated in second-order conditioning: Evidence for similar associative structure in forward and simultaneous conditioning. Learning and Motivation. 1991;22:253–268. [Google Scholar]
- Barnet RC, Miller RR. Temporal encoding as a determinant of inhibitory control. Learning and Motivation. 1996;27:73–91. [Google Scholar]
- Blaisdell AP, Denniston JC, Miller RR. Temporal encoding as a determinant of overshadowing. Journal of Experimental Psychology: Animal Behavior Processes. 1998;24:72–83. doi: 10.1037//0097-7403.24.1.72. [DOI] [PubMed] [Google Scholar]
- Blaisdell AP, Denniston JC, Miller RR. Posttraining shifts in the overshadowing stimulus-unconditioned stimulus interval alleviates the overshadowing deficit. Journal of Experimental Psychology: Animal Behavior Processes. 1999;25:18–27. [PubMed] [Google Scholar]
- Boren JJ, Moerschbaecher JM, Whyte AA. Variability of response location on fixed-ratio and fixed-interval schedules of reinforcement. Journal of the Experimental Analysis of Behavior. 1978;30:63–67. doi: 10.1901/jeab.1978.30-63. [DOI] [PMC free article] [PubMed] [Google Scholar]
- Bower GH. Correlated delay of reinforcement. Journal of Comparative and Physiological Psychology. 1961;54:196–203. [Google Scholar]
- Campbell BA, Church RM. Punishment and aversive behavior. Appleton-Century-Crofts; Oxford, England: 1969. [Google Scholar]
- Capaldi EJ. Effects of schedule and delay of reinforcement on acquisition speed. Animal Learning & Behavior. 1978;6:330–334. [Google Scholar]
- Capaldi EJ, Alptekin S, Birmingham K. Discriminating between reward-produced memories: Effects of differences in reward magnitude. Animal Learning & Behavior. 1997;25:171–176. [Google Scholar]
- Capaldi EJ, Capaldi ED. Magnitude of partial reward, irregular reward schedules, and a 24-hour ITI: A test of several hypotheses. Journal of Comparative and Physiological Psychology. 1970;72:203–209. [Google Scholar]
- Carlton PL. Effects of deprivation and reinforcement magnitude of response variability. Journal of the Experimental Analysis of Behavior. 1962;5:481–486. doi: 10.1901/jeab.1962.5-481. [DOI] [PMC free article] [PubMed] [Google Scholar]
- Cherot C, Jones A, Neuringer A. Reinforced variability decreases with approach to reinforcers. Journal of Experimental Psychology: Animal Behavior Processes. 1996;22:497–508. doi: 10.1037//0097-7403.22.4.497. [DOI] [PubMed] [Google Scholar]
- Crespi LP. Quantitative variation of incentive and performance in the white rat. American Journal of Psychology. 1942;55:467–517. [Google Scholar]
- Daly HB, Daly JT. A mathematical model of reward and aversive nonreward: Its application in over 30 appetitive learning situations. Journal of Experimental Psychology: General. 1982;111:441–480. [Google Scholar]
- Davenport JW. Species generality of within-subjects reward magnitude effects. Canadian Journal of Psychology. 24:1–7. [Google Scholar]
- Davidson TL, Capaldi ED, Myers DE. Effects of reward magnitude on running speed following a deprivation upshift. Bulleting of the Psychonomic Society. 1980;15:150–152. [Google Scholar]
- Davidson TL, Capaldi ED, Peterson JL. A comparison of the effects of reward magnitude and deprivation level on resistance to extinction. Bulletin of the Psychonomic Society. 1982;19:119–122. [Google Scholar]
- Denney J, Neuringer A. Behavioral variability is controlled by discriminative stimuli. Animal Learning & Behavior. 1998;26:154–162. [Google Scholar]
- Dickinson A, Balleine B. Motivational control of goal-directed action. Animal Learning & Behavior. 1994;22:1–18. [Google Scholar]
- Eckerman DA, Lanson RN. Variability of response location for pigeons responding under continuous reinforcement, intermittent reinforcement, and extinction. Journal of the Experimental Analysis of Behavior. 1969;12:73–80. doi: 10.1901/jeab.1969.12-73. [DOI] [PMC free article] [PubMed] [Google Scholar]
- Ferraro DP, Branch KH. Variability of response location during regular and partial reinforcement. Psychological Reports. 1968;23:1023–1031. [Google Scholar]
- Gharib A, Derby S, Roberts S. Timing and the control of variation. Journal of Experimental Psychology: Animal Behavior Processes. 2001;27:165–178. [PubMed] [Google Scholar]
- Gharib A, Gade C, Roberts S. Control of variation by reward probability. Journal of Experimental Psychology: Animal Behavior Processes. 2004;30:271–282. doi: 10.1037/0097-7403.30.4.271. [DOI] [PubMed] [Google Scholar]
- Green L, Fisher EB, Perlow S, Sherman L. Preference reversal and self-control: Choice as a function of reward amount and delay. Behaviour Analysis Letters. 1981;1:43–51. [Google Scholar]
- Grice GR. The relation of secondary reinforcement to delayed reward in visual discrimination learning. Journal of Experimental Psychology. 1948;53:347–352. doi: 10.1037/h0061016. [DOI] [PubMed] [Google Scholar]
- Grunow A, Neuringer A. Learning to vary and varying to learn. Psychonomic Bulletin & Review. 2002;9:250–258. doi: 10.3758/bf03196279. [DOI] [PubMed] [Google Scholar]
- Herrnstein RJ. Stereotypy and intermittent reinforcement. Science. 1961;133:2067–2069. doi: 10.1126/science.133.3470.2067-a. [DOI] [PubMed] [Google Scholar]
- Holland PC. The effects of qualitative and quantitative variation in the US on individual components of Pavlovian appetitive conditioned behavior in rats. Animal Learning & Behavior. 1979;7:424–432. [Google Scholar]
- Hull CL. Principles of behavior. Appleton-Century-Crofts; New York: 1943. [Google Scholar]
- Hume D. In: A treatise on human nature. Selby-Bigge LA, editor. Oxford University Press; London, England: 1964. Original work published 1739. [Google Scholar]
- Konorski J. Integrative activity of the brain: An interdisciplinary approach. University of Chicago Press; Chicago: 1967. [Google Scholar]
- Leising KJ, Sawa K, Blaisdell AP. Temporal integration in Pavlovian appetitive conditioning in rats. Learning & Behavior. 2007;35:11–18. doi: 10.3758/bf03196069. [DOI] [PubMed] [Google Scholar]
- Leon MI, Gallistel CR. Self-stimulating rats combine subjective reward magnitude and subjective reward rate multiplicatively. Journal of Experimental Psychology: Animal Behavior Processes. 1998;24:265–277. doi: 10.1037//0097-7403.24.3.265. [DOI] [PubMed] [Google Scholar]
- Leonard DW. Amount and sequence of reward in partial and continuous reinforcement. Journal of Comparative and Physiological Psychology. 1969;67:204–211. [Google Scholar]
- Lucas GA, Deich JD, Wasserman EA. Trace autoshaping: Acquisition, maintenance, and path dependence at long trace intervals. Journal of the Experimental Analysis of Behavior. 1981;36:61–74. doi: 10.1901/jeab.1981.36-61. [DOI] [PMC free article] [PubMed] [Google Scholar]
- Marlin NA. Contextual associations in trace conditioning. Bulletin of the Psychonomic Society. 1981;18:318–320. [Google Scholar]
- Mazur JE. Predicting the strength of a conditioned reinforcer: Effects of delay and uncertainty. Current Directions in Psychological Science. 1993;2:70–74. [Google Scholar]
- Mazur JE. Choice, delay, probability, and conditioned reinforcement. Animal Learning & Behavior. 1997;25:131–147. [Google Scholar]
- Mellgren RL, Dyck DG. Reward magnitude in differential conditioning: Effects of sequential variables in acquisition and extinction. Journal of Comparative and Physiological Psychology. 1974;86:1141–1148. doi: 10.1037/h0037640. [DOI] [PubMed] [Google Scholar]
- Minamimoto T, La Camera G, Richmond BJ. Measuring and modeling the interaction among reward size, delay to reward, and satiation level on motivation in monkeys. Journal of Neurophysiology. 2009;101:437–447. doi: 10.1152/jn.90959.2008. [DOI] [PMC free article] [PubMed] [Google Scholar]
- Morris RW, Bouton ME. Effect of unconditioned stimulus magnitude on the emergence of conditioned responding. Journal of Experimental Psychology: Animal Behavior Processes. 2006;32:371–385. doi: 10.1037/0097-7403.32.4.371. [DOI] [PubMed] [Google Scholar]
- Morris MD, Capaldi EJ. Extinction responding following partial reinforcement: The effects of number of rewarded trials and magnitude of reward. Animal Learning & Behavior. 1979;7:509–513. [Google Scholar]
- Neuringer A. Reinforced variability in animals and people: Implications for adaptive action. American Psychologist. 2004;59:891–906. doi: 10.1037/0003-066X.59.9.891. [DOI] [PubMed] [Google Scholar]
- Neuringer A, Kornell N, Olufs M. Stability and variability in extinction. Journal of Experimental Psychology: Animal Behavior Processes. 2001;27:79–94. [PubMed] [Google Scholar]
- Nevin JA. Pavlovian determiners of behavioral momentum. Animal Learning & Behavior. 1984;12:363–370. [Google Scholar]
- Nevin JA. An integrative model for the study of behavioral momentum. Journal of the Experimental Analysis of Behavior. 1992;57:301–316. doi: 10.1901/jeab.1992.57-301. [DOI] [PMC free article] [PubMed] [Google Scholar]
- Nevin JA, Grace RC. Behavioral momentum and the law of effect. Behavioral and Brain Sciences. 2000;23:73–130. doi: 10.1017/s0140525x00002405. [DOI] [PubMed] [Google Scholar]
- Nevin JA, Mandell C, Atak JR. The analysis of behavioral momentum. Journal of the Experimental Analysis of Behavior. 1983;39:49–59. doi: 10.1901/jeab.1983.39-49. [DOI] [PMC free article] [PubMed] [Google Scholar]
- Nevin JA, Tota ME, Torquato RD, Shull RL. Alternative reinforcement increases resistance to change: Pavlovian or operant contingencies? Journal of the Experimental Analysis of Behavior. 1990;53:359–379. doi: 10.1901/jeab.1990.53-359. [DOI] [PMC free article] [PubMed] [Google Scholar]
- Odum AL, Ward RD, Barnes CA, Burke KA. The effect of delayed reinforcement on variability and repetition of response sequences. Journal of the Experimental Analysis of Behavior. 2006;86:159–179. doi: 10.1901/jeab.2006.58-05. [DOI] [PMC free article] [PubMed] [Google Scholar]
- Page S, Neuringer A. Variability is an operant. Journal of Experimental Psychology: Animal Behavior Processes. 1985;11:429–452. doi: 10.1037//0097-7403.26.1.98. [DOI] [PubMed] [Google Scholar]
- Papini MR, Ludvigson W, Huneycutt D, Boughner RL. Apparent incentive contrast effects in autoshaping with rats. Learning and Motivation. 2001;32:434–456. [Google Scholar]
- Papini MR, Thomas B. Spaced-trial operant learning with purely instrumental contingencies in pigeons (Columba livia) International Journal of Comparative Psychology. 1997;10:128–136. [Google Scholar]
- Pavlov IP. In: Conditioned reflexes. Anrep GV, editor. Oxford University Press; London: 1927. [Google Scholar]
- Perkins CC. Proportion of large-reward trials and within-subject reward magnitude effects. Journal of Comparative and Physiological Psychology. 1970;70:170–172. [Google Scholar]
- Pryor KW, Haag R, O’Reilly J. The creative porpoise: Training for novel behavior. Journal of the Experimental Analysis of Behavior. 1969;12:653–661. doi: 10.1901/jeab.1969.12-653. [DOI] [PMC free article] [PubMed] [Google Scholar]
- Rachlin H. Self-control. Behaviorism. 1974;3:94–107. [Google Scholar]
- Rescorla RA, Wagner AR. A theory of Pavlovian conditioning: Variations in the effectiveness of reinforcement and nonreinforcement. In: Black AH, Prokasy WF, editors. Classical conditioning II. Appleton-Century-Crofts; New York: 1972. pp. 64–99. [Google Scholar]
- Roberts S. Transform your data. Nutrition. 2008;24:492–494. doi: 10.1016/j.nut.2008.01.004. [DOI] [PubMed] [Google Scholar]
- Rose J, Schmidt R, Grabemann M, Güntürkün O. Theory meets pigeons: The influence of reward-magnitude on discrimination-learning. Behavioural Brain Research. 2009;198:125–129. doi: 10.1016/j.bbr.2008.10.038. [DOI] [PubMed] [Google Scholar]
- Savastano HI, Miller RR. Time as content in Pavlovian conditioning. Behavioural Processes. 1998;44:147–162. doi: 10.1016/s0376-6357(98)00046-1. [DOI] [PubMed] [Google Scholar]
- Schaal DW, Shahan TA, Kovera CA, Reilly MP. Mechanisms underlying the effects of unsignaled delayed reinforcement on key pecking of pigeons under variable-interval schedules. Journal of the Experimental Analysis of Behavior. 1998;69:103–122. doi: 10.1901/jeab.1998.69-103. [DOI] [PMC free article] [PubMed] [Google Scholar]
- Shapiro MS, Siller S, Kacelnik A. Simultaneous and sequential choice as a function of reward delay and magnitude: Normative, descriptive, and process-based models tested in the European starling (Sturnus vulgaris) Journal of Experimental Psychology: Animal Behavior Processes. 2008;34:75–93. doi: 10.1037/0097-7403.34.1.75. [DOI] [PubMed] [Google Scholar]
- Staddon JER. Schedule-induced behavior. In: Honig WK, Staddon JER, editors. Handbook of operant behavior. Erlbaum; Hillsdale, NJ: 1977. pp. 125–152. [Google Scholar]
- Staddon JER, Simmelhag VL. The “superstition” experiment: A reexamination of its implications for the principles of adaptive behavior. Psychological Review. 1971;78:3–43. [Google Scholar]
- Stahlman WD, Blaisdell AP. Reward probability and the variation of foraging behavior in rats. International Journal of Comparative Psychology. 2011;24:168–176. [Google Scholar]
- Stahlman WD, Roberts S, Blaisdell AP. Effect of reward probability on spatial and temporal variation. Journal of Experimental Psychology: Animal Behavior Processes. 2010a;36:77–91. doi: 10.1037/a0015971. [DOI] [PubMed] [Google Scholar]
- Stahlman WD, Young ME, Blaisdell AP. Response variation in pigeons in a Pavlovian task. Learning & Behavior. 2010b;38:111–118. doi: 10.3758/LB.38.2.111. [DOI] [PubMed] [Google Scholar]
- Timberlake W. Behavior systems and reinforcement: An integrative approach. Journal of the Experimental Analysis of Behavior. 1993;60:105–128. doi: 10.1901/jeab.1993.60-105. [DOI] [PMC free article] [PubMed] [Google Scholar]
- Timberlake W, Lucas GA. The basis of superstitious behavior: Chance contingency, stimulus substitution, or appetitive behavior? Journal of the Experimental Analysis of Behavior. 1985;44:279–299. doi: 10.1901/jeab.1985.44-279. [DOI] [PMC free article] [PubMed] [Google Scholar]
- Tolman EC. Purposive behavior in animals and men. Appleton-Century; New York: 1932. [Google Scholar]
- Tukey JW. Exploratory data analysis. Addison Wesley; Reading, MA: 1977. [Google Scholar]
- Wagner K, Neuringer A. Operant variability when reinforcement is delayed. Learning & Behavior. 2006;34:111–123. doi: 10.3758/bf03193187. [DOI] [PubMed] [Google Scholar]


