

Abstract
In this study, we have analyzed the expression of TRIM24/TIF-1α, a negative regulator of various transcription factors (including nuclear receptors and p53) at the genomic, mRNA, and protein levels in human breast tumors. In breast cancer biopsy specimens, TRIM24/TIF-1α mRNA levels (assessed by Real-Time Quantitative PCR or microarray expression profiling) were increased as compared to normal breast tissues. At the genomic level, array comparative genomic hybridization analysis showed that the TRIM24/TIF-1α locus (7q34) exhibited both gains and losses that correlated with mRNA levels. By re-analyzing a series of 238 tumors, high levels of TRIM24/TIF-1α mRNA significantly correlated with various markers of poor prognosis (such as the molecular subtype) and were associated with worse overall survival. By using a rabbit polyclonal antibody for immunochemistry, the TRIM24/TIF-1α protein was detected in nuclei of normal luminal epithelial breast cells, but not in myoepithelial cells. Tissue microarray analysis confirmed that its expression was increased in epithelial cells from normal to breast infiltrating duct carcinoma and correlated with worse overall survival. Altogether, this work is the first study that shows that overexpression of the TRIM24/TIF-1α gene in breast cancer is associated with poor prognosis and worse survival, and it suggests that this transcription coregulator may play a role in mammary carcinogenesis and represent a novel prognostic marker.
Transcription intermediary factor 1α (TIF-1α), also known as TRIM24, a member of the tripartite motif protein family, has been identified as a nuclear receptor transcription coregulator. The mouse1 and human2 cDNAs have been cloned either in two-hybrid screen or through direct in vitro interaction with transcriptional active estrogen receptors (ER). TRIM24/TIF-1α interacts with a number of nuclear receptors, negatively regulates transactivation in vitro,3,4 and also functions in cooperation with GRIP1 and CARM1, as a secondary coactivator for nuclear receptors.5
Several domains exhibit interesting structural features such as RING, and B box zinc-binding domains, a coiled-coil domain, a plant homeodomain finger, and a bromodomain. These domains are potentially involved in protein-DNA or protein-protein interactions and have been found in other transcriptional cofactors and chromatin-remodeling proteins.6,7 TRIM24/TIF-1α also exhibits binding sites for different proteins associated with heterochromatin HP1α/β/γ and with the Krüppel-associated box (KRAB) repression domain.8
In addition, TRIM24/TIF-1α could regulate transcription by phosphorylating components of the basal transcriptional machinery. It has been reported that TRIM24/TIF-1α is a protein kinase that not only undergoes a ligand-dependent hyperphosphorylation once recruited by ERα, but also selectively phosphorylates TFIIEα, TAFII28, TAFII55, and the HP1 proteins in vitro.9 More recently, TRIM24/TIF-1α has been identified as a novel partner of the p53 tumor suppressor which negatively regulates p53 protein levels.10 Indeed, TRIM24/TIF-1α directly ubiquitinates p53 via its RING domain and TRIM24/TIF-1α depletion in human breast cancer cells caused p53-dependent apoptosis.
TRIM24/TIF-1α is an abundant nuclear protein found in embryo stem cells. Its expression considerably decreases during differentiation and organogenesis11 and remains detectable only in some organs, such as gonads.12 Only few data have been published concerning TRIM24/TIF-1α in human tumors. For instance, it has been implicated in fusion proteins in acute myeloid leukemia13,14 or in papillary thyroid carcinoma,15 suggesting that this genomic location could be a potential chromosomal breakpoint in the human genome. Therefore, considering TRIM24/TIF-1α biological activities and previously identified genomic alterations, we investigated its expression in breast cancer at the genomic, mRNA, and protein levels.
At the mRNA level, compared to its level in normal breast tissue, we found that TRIM24/TIF-1α expression was globally increased in breast cancers. Array Comparative Genomic Hybridization (aCGH) data of breast cancer biopsy specimens showed gains of the 7q34 region harboring the TRIM24/TIF-1α gene which correlated with mRNA expression suggesting that the alteration of genomic dosage could be one mechanism involved in TRIM24/TIF-1α expression deregulation. Analysis of expression data obtained on 238 patients from a previously published study by Fan et al16 revealed that increased levels of TRIM24/TIF-1α mRNAs were significantly correlated with several markers of poor prognosis (70-gene profile, recurrence score, and intrinsic subtypes) and with worse overall survival (OS). By studying immunohistochemistry on a tissue microarray, we confirmed that TRIM24/TIF-1α expression was increased in epithelial cells of breast infiltrating duct carcinoma and associated with a worse OS. Altogether, this study emphasizes the prognostic significance of TRIM24/TIF-1α expression in breast cancer.
Materials and Methods
Breast Tissue
For RNA quantification (sample set #1) and aCGH analysis (sample set #2), RNA and DNA were isolated from normal breast tissues or primary breast cancers that were collected in four French cancer hospitals: Centre Val d'Aurelle (Montpellier), Centre Léon Bérard (Lyon), Institut Paoli-Calmettes (Marseille), and Institut Gustave Roussy (Villejuif).17 The CBA2 Tissue MicroArray from SuperBioChips was obtained from Clinisciences (Montrouge, France). For this set of patients, median follow-up was 44 months (range, 8–184 months). Thirteen of 37 (35%) patients died at a median of 30 months (range, 8–78 months) after surgery. Survival median is not reached. The 4-year OS rate is 58% [95% confidence interval (CI): 35%–76%].
RNA Quantification
RT-QPCR was performed on a LC480 instrument using LightCycler 480 SYBR Green PCR Master (Roche Diagnostics, Meylan, France). PCR reaction was performed in a final volume of 10 μL, with 5 pmol of primers and cDNA corresponding to 5 ng of total RNA. For each set of primers, a standard curve was performed with serial dilution of cDNA to evaluate the efficiency of the amplification. Forward and reverse primer sequences were as follows:
hHBMS: 5'-CGCATCTGGAGTTCAGGAGTA-3' and 5'-CCAGGATGATGGCACTGA-3', hIPO8: 5'-GTGTACACACTGGCAGAGCAC-3' and 5'-GCCTCCCTGTTGTTCAATCT-3', Trim24 total 5'-AATGGACCAGTTCTTCCTCCTCA-3' and 5'-TGGCTTTATTGCTTGTCGTGG-3', short 5'-CAGCAACAGCAACCGCCT-3' and 5'-TGAGGAGGAAGAACTGGTCCATT-3', long 5'-GTTTACCAAACCCTAGAATGCAGG-3' and 5'-AAGTTTATCAAACGTGGAGGCG-3'.
Melting curve was systematically performed to check for specific amplification. TRIM24/TIF-1α mRNA expression (obtained on 135 tumoral and 11 normal breast samples) was normalized to endogenous references (IPO8 and HBMS mRNA).
Expression Profiling
RNA was extracted using RNAeasy columns (Qiagen, Courtaboeuf, France). Aliquots of the RNA were analyzed by electrophoresis on a Bioanalyser 2100 (version A.02 S1292, Agilent Technologies, Waldbronn, Germany). Stringent criteria for RNA quality were applied to rule out degradation, especially a 28S/18S ratio greater than 1.8. Microarray analyses were performed using 3 μg of total RNA of each sample as starting material and 10 μg cRNA per hybridization (GeneChip Fluidics Station 400; Affymetrix, Santa Clara, CA). Total RNA obtained for 108 samples was amplified and labeled following the manufacturer's one-cycle target labeling protocol (Affymetrix, Santa Clara, CA). The labeled cDNA were then hybridized to HG-U133 plus 2.0 Affymetrix GeneChip arrays (Affymetrix, Santa Clara, CA) and chips were scanned with a GCOS 1.4 and raw feature data were normalized using robust multiarray average method (R package affy). Data corresponding to the 204391_x_at and 213301_x_at probesets were extracted and analyzed.
Array CGH Profiling
We used human Integrachip V7 to establish genomic profiles (IntegraGen SA, Evry, France). IntegraChip V7 is composed of 5,984 bacterial artificial chromosome clones including 5,514 sequenced clones with a median gap of 1 clone/0.478 Mb. The TRIM24/TIF-1α gene region is covered by two bacterial artificial chromosome clones and the 7q34 genomic region represented by eight different clones. DNA labeling and hybridization were performed as previously described18 with slight modifications: 600 ng of DNA were labeled with BioPrime Total Genomic Labeling System (Invitrogen SARL, Cergy Pontoise, France). Arrays were scanned using the Axon 4000B scanner (Molecular Devices, CA) and images were analyzed using Genepix 6.0. Extracted values were then normalized, filtered, and graphically represented using Nexus 4.0 software (Biodiscovery, El Segundo, CA). Normalization and segmentation of data were performed using the Lowess algorithm and a modified rank segmentation algorithm, respectively. Thresholds for log2 ratios were set respectively at 0.138 and −0.153 for the calling of gains and losses. Clones were ordered according to the March 2006 release (Hg18) of the human draft sequences. Array CGH data were obtained for 284 breast tumors.
Antibodies
A polyclonal antibody was generated against human GST-TRIM24/TIF-1α corresponding to a fusion of 225 amino acids (residues 630 to 854).2 The rabbit antiserum was affinity purified to generate the TS1 antibody. A commercially available rabbit polyclonal antibody specific for the region corresponding to amino acids 631 to 820 of human TRIM24/TIF-1α (H-190 from Santa Cruz Biotechnology, CA) was also tested. A purified rabbit IgG1 antibody (Sigma-Aldrich, Saint-Quentin Fallavier, France) was used as a negative control.
Cell Culture
The MCF7 human breast carcinoma cell line19 from the Michigan Cancer Foundation (Detroit, MI), was maintained in Dulbecco's modified Eagle's medium (LifeTechnologies, Carlsbad, CA) supplemented with 10% fetal calf serum and 0.5% gentamicin (LifeTechnologies). Cells were grown in flasks or on glass coverslips in the same medium.
Immunocytochemistry
Cell pellets and breast carcinoma were fixed in 3.7% formalin, dehydrated, and paraffin-embedded. Thick sections (4–5 μm) of breast cancer cells, breast tumors, or formalin-fixed paraffin-embedded tissues of CBA2 tissue array were dewaxed, rehydrated, and processed with four microwave treatments of 5 minutes at 650 watts in 0.01 mol/L citrate buffer pH 6. Breast carcinomas were also processed for 30 minutes in 0.1 mol/L EDTA buffer pH 7.1 maintained at 95°C in a water bath. After washing in PBS and quenching endogenous peroxidase activity, the sections were blocked 30 minutes with 2.5% normal donkey serum in PBS and incubated for 60 minutes with TRIM24/TIF-1α polyclonal antibodies (TS1 at 1/3000 or H-190 at 1/100). Negative controls were performed with a purified rabbit IgG1 antibody or with a rabbit pre-immune serum at the same concentrations. Sections were then incubated with biotin-conjugated donkey antibody to rabbit IgG (1/400) (Life Science, Amersham, France) and then with the streptavidin-biotin peroxidase complex (Vectastain ABC kit, Vector Laboratories, Burlingame, CA) in PBS plus 1% bovine gamma globulin. After incubation in a DAB (3, 3′ diaminobenzidine, Sigma-Aldrich) solution, the sections were counterstained in hematoxylin, dehydrated, and covered with a coverslip using a permanent mounting medium.
MCF7 or T47D cells grown on glass coverslips were fixed with 4% paraformaldehyde, permeabilized with 0.02% Triton, blocked with 2.5% normal donkey serum in 0.05% Tween-PBS, then processed mostly like paraffin sections. Immunostaining specificity was checked by preincubating polyclonal TS1 antibody alone or with 3 μg/mL, 7.5 μg/mL, or 15 μg/mL of the GST-TRIM24/TIF-1α fusion protein used for immunization for 60 minutes at 37°C before incubation with permeabilized cells.
Immunostaining Quantification
Sections or cells were photographed with an image analyzer (SAMBA TITN, Unilog, Grenoble, France) adapted to a Leitz DMRB light microscope (Leica, Wetzlar, Germany) and a 3-CCD DXC-950P color video camera (Sony Corp., Tokyo, Japan). TRIM24/TIF-1α staining intensity (0, +, +/++, or ++) and the percentage of labeled cells were quantified by a pathologist. The labeling index was obtained by the multiplication of the labeled cells percentage by 1 (+), 1.5 (+/++), or 2 (++).
Statistical Analysis
mRNA expression levels were presented as medians (range) and were compared between populations with the nonparametric Kruskal-Wallis test. Differences were considered statistically significant when P < 0.05. The optimal TRIM24 threshold value, which induces the best discrimination according to vital status, was calculated to maximize the Youden's index. This index is defined as the sum of sensitivity and specificity minus 1 and is frequently used to dichotomize continuous variable in receiver operating characteristic curve methodology.
OS rates were estimated from the date of surgery until the date of death using the Kaplan-Meier method. Median survival and hazard ratios were presented with 95% confidence intervals (CIs). Patients lost to follow-up were censored at the time of last visit. Differences in survival rates were compared using a log-rank test in univariate analysis. Factors significant at the P < 0.10 level in univariate analysis were included into a multivariate Cox proportional hazards model. Statistical analyses were performed with STATA software 10.0 (StatCorp, College Station, TX).
Results
Overexpression of TRIM24/TIF-1α mRNA in Breast Cancer
To determine whether TRIM24/TIF-1α expression was deregulated in breast cancer, we first performed real-time quantitative PCR of the corresponding mRNA on a series of 135 breast cancer samples from patients diagnosed with breast carcinomas and on 11 normal breast samples obtained from healthy controls. As shown in Figure 1A, the TRIM24/TIF-1α mRNA levels showed a significant increase in breast cancers as compared to normal tissues (P = 0.001).
Figure 1.
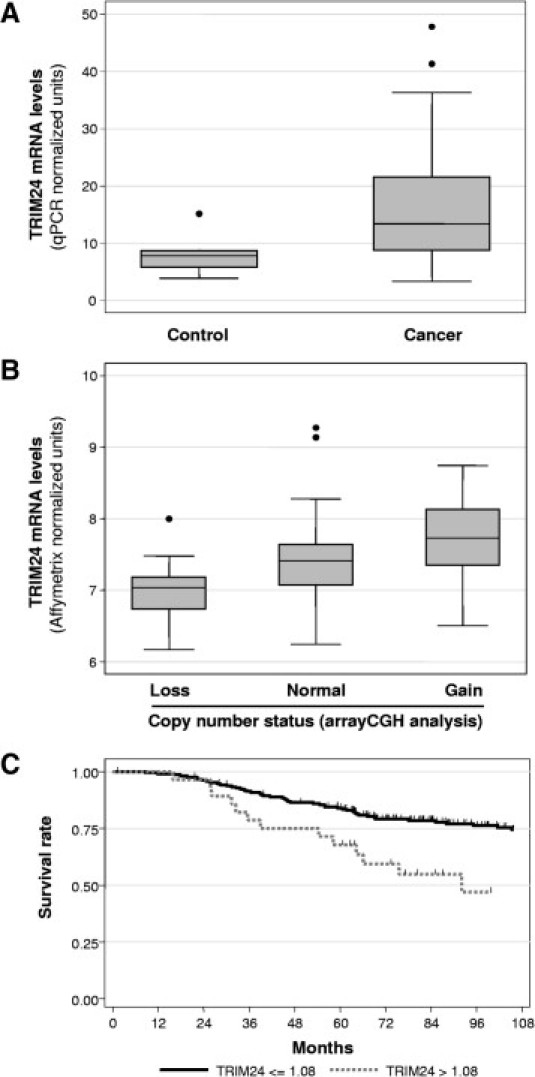
Expression of TRIM24/TIF-1α mRNA in breast carcinomas. A: TRIM24/TIF-1α mRNA levels were determined on 11 normal breast tissues (Control) and 135 breast carcinomas by RT-QPCR as described in Materials and Methods. Data were normalized using the IPO8 and HBMS mRNAs and are presented as box-plots showing the median value, upper and lower quartiles together and minimum and maximum non-atypical data values. B: TRIM24/TIF-1α mRNA levels were determined by Affymetrix microarray analysis (Affymetrix probe set 213301_x_at) in a series of 108 breast tumors with losses (13 cases), gains (18 cases), or no alterations (77 cases) at the corresponding locus as determined by aCGH analysis. Data are represented as box-plots. C: Kaplan–Meier analysis of overall survival according to TRIM24/TIF-1α mRNA expression in the 238-tumor set from Fan et al16. Patients with high TRIM24/TIF-1α mRNA expression (expression level more than the optimal threshold of 1.08 - gray solid line) were compared to patients with low TRIM24/TIF-1α mRNA expression (expression level less than or equal to the optimal threshold of 1.08 - black solid line). Differences in survival rates were statistically significant when compared using a log-rank test (P < 0.001). Tick marks indicate censored events.
We then analyzed an aCGH data set containing 284 breast cancer genomic profiles already published17 or obtained in the context of the “Cartes d'Identité des tumeurs” analysis conducted by “La Ligue Nationale Contre le Cancer” for copy number changes of the 7q34 region harboring TRIM24/TIF-1α gene. We observed a gain of the TRIM24/TIF-1α locus in 9.5% of the cases (27 patients with 3 presenting a high copy gain) and a loss in 7% of the cases (20 patients) (data not shown). On a limited number of cases (108 samples), we were able to quantify both genomic alterations by aCGH analysis and mRNA levels by Affymetrix microarray analysis (Figure 1B). We found that mRNA levels varied significantly (P = 0.001) according to the genomic dosage at the TRIM24/TIF-1α locus, indicating that genomic alterations might partly account for TRIM24/TIF-1α mRNA increase in breast cancer.
Association of TRIM24/TIF-1α mRNA Levels with Poor Prognosis and Worse Survival
In a second step, we then asked whether TRIM24/TIF-1α mRNA expression was associated with clinical outcome. To this aim, we used data published by Fan et al16 which compared the outcome predictions derived from five different gene-expression-based models (intrinsic subtypes,20 70-gene profile,21,22 wound-response,23 recurrence score,24 and two-gene ratio25). This data set of breast-cancer samples from 238 women corresponds mostly to stage I or II breast cancer and provides information on OS for all patients with a median follow-up of 108 months (range, 1–220 months) and a 4-year OS rate of 85% (95% CI: 80% - 89%)16 (see Supplemental Table S1 at http://ajp.amjpathol.org). By reanalyzing this data set, we first observed that TRIM24/TIF-1α mRNA levels were significantly higher in the group of tumors that were negative for the estrogen receptor ERα (P = 0.003) or which had a high tumor grade (P = 0.003) but were not associated with lymph node invasion or with the size of the tumor (Table 1).
Table 1.
TRIM24/TIF1-α mRNA Levels in 238 Tumors
| No. | (%) | TRIM24 mRNA levels |
|||
|---|---|---|---|---|---|
| Median | Range | P⁎ | |||
| N | |||||
| N0 | 119 | (50.0) | 0.97 | (0.80; 1.33) | 0.756 |
| N+ | 119 | (50.0) | 0.98 | (0.75; 1.22) | |
| T | |||||
| T1 (≤2 cm) | 122 | (51.3) | 0.98 | (0.75; 1.15) | 0.397 |
| T2-T3-T4 (>2 cm) | 116 | (48.7) | 0.98 | (0.77; 1.33) | |
| ER | |||||
| ER− | 58 | (24.4) | 1.02 | (0.80; 1.22) | 0.003 |
| ER+ | 180 | (75.6) | 0.97 | (0.75; 1.33) | |
| Grade SBR | |||||
| I | 57 | (24.0) | 0.95 | (0.80; 1.12) | 0.003 |
| II | 86 | (36.1) | 0.98 | (0.75; 1.33) | |
| III | 95 | (39.9) | 1.00 | (0.78; 1.22) | |
| Type/Sorlie | |||||
| Normal like | 24 | (10.1) | 0.95 | (0.80; 1.07) | <0.001 |
| Luminal A | 100 | (42.0) | 0.96 | (0.75; 1.33) | |
| Luminal B | 41 | (17.2) | 1.00 | (0.78; 1.13) | |
| Erbb2 | 30 | (12.6) | 1.00 | (0.80; 1.13) | |
| Basal | 43 | (18.1) | 1.04 | (0.85; 1.23) | |
| 70-gene | |||||
| Good | 90 | (37.8) | 0.95 | (0.75; 1.12) | <0.001 |
| Poor | 148 | (62.2) | 1.00 | (0.77; 1.33) | |
| Two-gene ratio | |||||
| High | 131 | (55.0) | 0.98 | (0.75; 1.22) | 0.699 |
| Low | 107 | (45.0) | 0.98 | (0.80; 1.33) | |
| Wound response | |||||
| Activated | 189 | (79.4) | 0.98 | (0.75; 1.33) | 0.179 |
| Quiescent | 49 | (20.6) | 0.97 | (0.80; 1.12) | |
| Recurrence | |||||
| High | 153 | (64.3) | 1.00 | (0.77; 1.33) | 0.001 |
| Intermediate | 26 | (10.9) | 0.93 | (0.75; 1.18) | |
| Low | 59 | (24.8) | 0.96 | (0.80; 1.12) | |
Kruskall-Wallis test.
The 238 tumor samples used are from Fan et al.16
Then, we investigated whether TRIM24/TIF-1α expression was correlated with the other prediction markers of clinical outcome. Using univariate analysis we found no significant correlation with wound response (activated or quiescent) (P = 0.179) or the two-gene ratio prediction (P = 0.699). By contrast, we were interested to see a significant association with the 70-gene profile (P < 0.001), the recurrence score (P = 0.001), and with the intrinsic subtype (P < 0.001) which were the most predictive variables in the comparative study published by Fan et al.16 Moreover, we found that TRIM24/TIF-1α mRNA levels were significantly greater (P < 0.0001) in the group of tumors with molecular subtypes associated with a poor prognosis (ie, basal-like, luminal B, and HER2+/ER-) than in tumors classified as luminal A or normal-like which exhibit a good prognosis (Table 1). Altogether, these results indicate that TRIM24/TIF-1α expression in breast cancer is significantly increased in tumors classified with a bad prognosis. This was supported by survival analysis (Figure 1C and Supplemental Table S2 available at http://ajp.amjpathol.org) showing that overall survival was significantly worse (P < 0.001) among patients with a high level of TRIM24/TIF-1α mRNA (threshold value defined at 1.08 as described in Materials and Methods).
TRIM24/TIF-1α Protein Expression in Breast Cancer
To determine whether TRIM24/TIF-1α overexpression could also be observed at the protein level, we set up the detection of the corresponding protein by immunohistochemistry using the TS1 polyclonal antibody raised against human TRIM24/TIF-1α. In the human breast cancer MCF7 cell line (either whole cells or formalin-fixed paraffin-embedded sections shown respectively in Figure 2A and B), the TRIM24/TIF-1α protein only localized in cell nuclei with intense labeling scattered throughout the nucleoplasm. As shown in Figure 2C and D, specificity of the antibody was confirmed by an antibody blocking procedure involving preincubation of the TS1 antibody with the TRIM24/TIF-1α fusion protein used for immunization. Similarly, a strong nuclear staining comparable to that obtained on sections of MCF-7 cells was observed on paraffin-embedded breast cancer tissue sections (Figure 2E). On tissue section, negative controls were performed with the rabbit pre-immune serum (Figure 2F) or with a purified rabbit irrelevant IgG (not shown) at the same concentration than the corresponding specific primary antibody.
Figure 2.
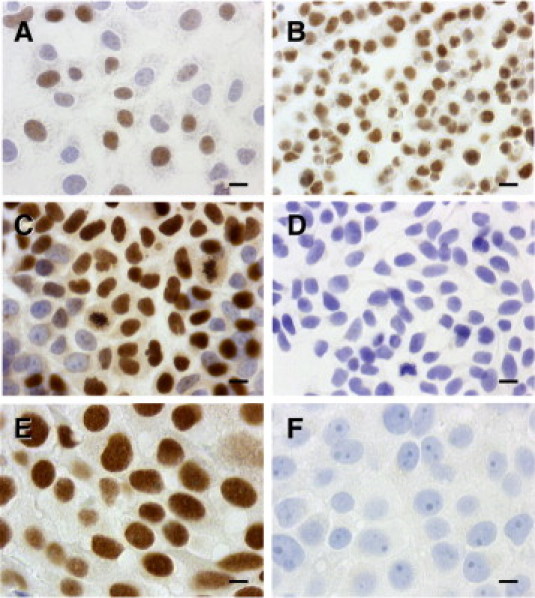
TRIM24/TIF-1α protein detection in breast cancer cells and tissues. Immunohistochemistry staining of the TRIM24/TIF-1α protein was performed as described in Materials and Methods after incubation with TIF-1α (TS1) polyclonal primary antibody (1/3000) at room temperature. A: MCF7 cells grown on glass coverslips. B: Paraffin-embedded MCF7 cell pellet sections. C, D: MCF7 cells grown on glass coverslips were incubated with TS1 antibody after incubation (D) or not (C) with 15 μg/mL of the GST-TRIM24/TIF-1α fusion protein used for immunization. E: Paraffin-embedded human breast IDC cells. F: Negative controls were performed with the rabbit pre-immune serum. (Original magnification X 630; scale bars = 10 μm.)
Interestingly, low TRIM24/TIF-1α protein levels were detected in normal breast structures (Figure 3, A and B) in concordance with mRNA data. In normal acini (Figure 3A), and normal duct (Figure 3B), we observed a slight immunoreactivity only in the nuclei of the epithelial cell layer, whereas no immunostaining was observed in nuclei of myoepithelial cells. As shown in Supplemental Figure S1 (available at http://ajp.amjpathol.org), TRIM24/TIF-1α protein was also observed in vascular endothelial cells, in some muscular cells, in adipocytes and in fibroblast nuclei whereas no expression was found in lymphocyte nuclei.
Figure 3.
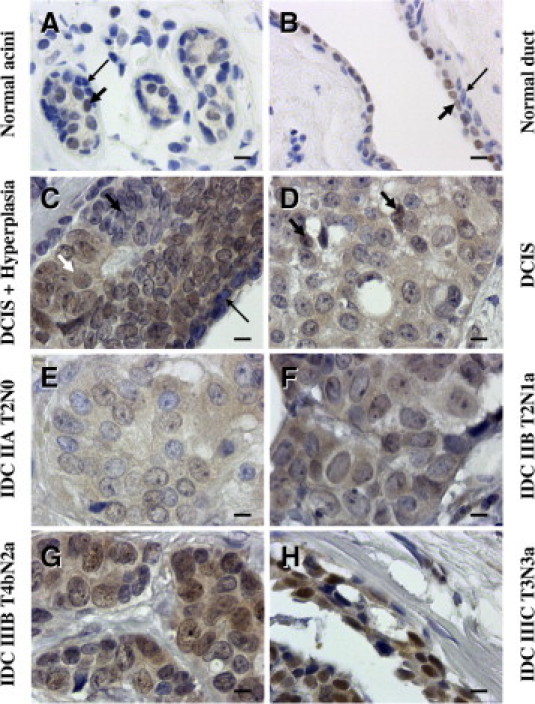
TRIM24/TIF-1α expression in human normal and tumoral tissues. Normal and tumor breast samples of the CBA2 tissue array were immunostained with the rabbit polyclonal TS1 antibody. Normal acini (A) and a normal duct (B) showing weak staining in some nuclei of epithelial cells (arrows). C–H: Representative lesions from six cases of the CBA2 tissue array showing increased intensity of staining with the TS1 antibody. C: Weak staining in a hyperplasic area (shown by a black short arrow) beside unlabeled myoepithelial cells (long black arrow) and labeled intraductal cancerous cells (white short arrow). D: Ductal carcinoma in situ (DCIS) where only two nuclei appear weakly labeled (arrows). E–H: Increase in nuclear staining observed in IDC with different staging (E) stage IIA, N0; (F) stage IIB, N1; (G) stage IIIB, N2; and (H) stage IIIC, N3. Case numbers correspond to an individual patient. (Original magnification X 630; scale bars = 10 μm.)
In ductal carcinoma in situ (DCIS) sections (and as noticed in normal tissues), no immunostaining was observed in nuclei of myoepithelial cells (Figure 3C). This contrasted with the labeling found in the nuclei of neighboring epithelial cancer cells. Interestingly, nuclei of epithelial cells from a hyperplasic area (beside the ductal in situ extension of the carcinoma) showed only weak labeling (Figure 3C).
We then analyzed TRIM24/TIF-1α expression in normal and tumoral breast using a tissue microarray (ref CBA2 from SuperBioChips Laboratories) (see Supplemental Table S1 at http://ajp.amjpathol.org). TRIM24/TIF-1α protein levels were quantified on 6 normal tissues, 2 DCIS, 33 infiltrating duct carcinoma (IDC) with 7 infiltrating ductal carcinoma metastasis (IDCM) sections. We noticed increasing levels of TRIM24/TIF-1α protein staining intensity in ER-positive tumors from DCIS where only few nuclei appear weakly labeled (Figure 3D) to the different stages of IDC, with a maximum on IDC IIIC (Figure 3H) in which all of the epithelial cell nuclei presented a strong labeling in numerous dots and nucleolus or throughout the nucleus. Moderate diffuse TRIM24/TIF-1α protein was observed in some epithelial cell nuclei in an IDC IIA, N0 (Figure 3E), while strong protein levels were detected in dots of some nuclei in an IDC IIB, N1 (Figure 3F) and in almost all nuclei in an IDC IIIB, N2 (Figure 3G). When compiled, these data showed a significant difference (P = 0.003) between TRIM24/TIF-1α protein detection in luminal epithelial cells of normal ducts or DCIS compared to epithelial cells of IDC/IDCM (Figure 4A). Altogether, these data supported the results obtained at the mRNA level and showed an increase in TRIM24/TIF-1α expression during breast tumorigenesis.
Figure 4.
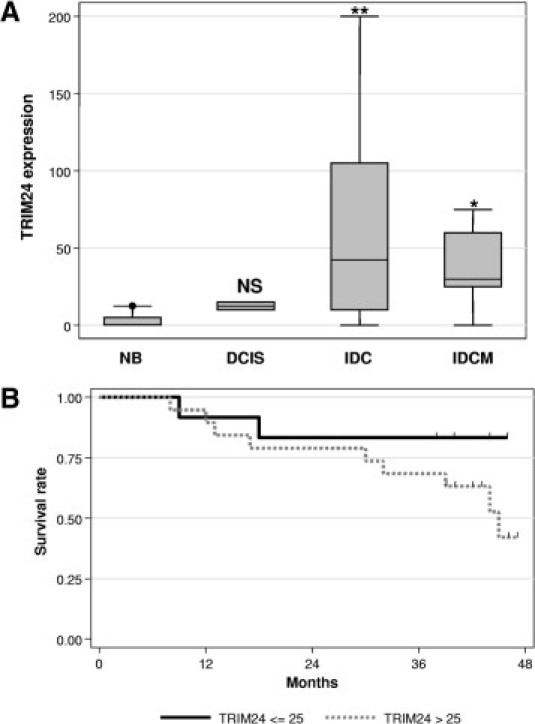
Tissue array analysis of TRIM24/TIF-1α expression. A: Data obtained after quantification of the TRIM24/TIF-1α protein by immunochemistry using the TS1 antibody on the CBA2 tissue array were represented as box-plots. The labeling values were plotted according to the different groups: normal breast (NB), DCIS, IDC, and IDCM. Statistical analysis was performed using the Mann-Whitney test with reference to the NB group data (*P < 0.05, **P < 0.01), NS. B: Overall survival was estimated for the 31 patients analyzed in the CBA2 tissue array using the Kaplan-Meier method according to TRIM24/TIF-1α protein expression. Patients with high TRIM24/TIF-1α expression (a level greater than the optimal threshold of 25 - gray solid line) were compared to patients with low TRIM24/TIF-1α expression (less than or equal to the optimal threshold of 25 - black solid line). The log-rank method was used to test the difference between the two groups, and patients with high levels of TRIM24/TIF-1α expression had significantly worse overall survival (P = 0.025). Tick marks indicate censored events.
Correlation of TRIM24/TIF-1α Protein Expression with Prognosis and Survival
Using this small set of tumors (37 samples), we found no significant association of TRIM24/TIF-1α protein levels with ERα levels, p53 status, or lymph node invasion (data not shown). As observed at the mRNA level, we found that OS was found to be significantly worse (P = 0.025) among patients with a high level of TRIM24/TIF-1α protein levels (Figure 4B and Table 2). Analyses revealed that, similar to TRIM24/TIF-1α expression, ER and Progesterone Receptor (PR) expression and Scarff-Bloom-Richardson grading were prognostic factors for OS (Table 2). Interestingly, multivariate analyses on the total cohort identified TRIM24/TIF-1α protein level as an independent prognostic factor for OS; ER, but not PR expression and Scarff-Bloom-Richardson grading, also preserved its prognostic value (Table 2). Altogether, these data indicate that TRIM24/TIF-1α protein levels strongly increase during breast cancer progression and that this marker appears clearly associated with bad prognosis and worse survival.
Table 2.
Univariate and Multivariable Cox Analysis on the CBA2 Tissue Array
| Univariate analysis |
Multivariate analysis |
|||||
|---|---|---|---|---|---|---|
| HR | 95% CI | P⁎ | HR | 95% CI | P⁎⁎ | |
| TRIM24 | ||||||
| ≤25 | 1 | 0.025 | 1 | 0.003 | ||
| >25 | 5.0 | (1.1; 23.3) | 8.1 | (1.6; 41.8) | ||
| N | ||||||
| N0 | 1 | 0.189 | ||||
| N+ | 2.35 | (0.6; 8.7) | ||||
| ER | ||||||
| ER− | 1 | 0.019 | 1 | 0.004 | ||
| ER+ | 0.28 | (0.09; 0.9) | 0.18 | (0.05; 0.6) | ||
| PR | ||||||
| PR− | 1 | 0.034 | ||||
| PR+ | 0.22 | (0.05; 1.01) | ||||
| p53 | ||||||
| WT | 1 | 0.245 | ||||
| Mut | 1.90 | (0.6; 5.7) | ||||
| Grade SBR | ||||||
| I | 1 | 0.041 | ||||
| II | 2.88 | (0.3; 24.6) | ||||
| III | 9.54 | (0.9; 92.8) | ||||
ER, Estrogen Receptor; PR, Progesterone Receptor; SBR, Scarff-Bloom-Richardson.
Logrank test.
Likelihood-ratio test.
Discussion
The TRIM24/TIF-1α gene might play an important role in tumorigenesis because it encodes a protein that controls nuclear receptor ligand-dependent activity4,26 and also acts as a ubiquitin E3-ligase for the tumor suppressor p53.10 In this study, we investigated the expression of TRIM24/TIF-1α in breast cancer at the mRNA, genomic, and protein levels.
On a series of 135 breast cancers, we first observed that TRIM24/TIF-1α mRNA levels were significantly increased as compared to normal breast tissues. These results were supported by data found in the Oncomine database27 showing higher levels of TRIM24/TIF-1α mRNA in 40 breast cancer biopsy specimens as compared to 7 normal breast samples.28 High levels of TRIM24/TIF-1α mRNA were also found in patients with myelodysplastic syndrome related acute myeloid leukemias29 and in sporadic colorectal cancers.30 We previously described the existence of two TRIM24/TIF-1α mRNA isoforms in breast cancer cells.2 The long isoform which exhibits a 34-amino acid insertion perfectly conserved in the coding region of human and mouse may play specific biological roles. However, when we compared the expression of this long isoform to the total TRIM24/TIF-1α mRNA, we found no significant differences (data not shown).
Array CGH analysis of 284 breast cancer samples showed gains in the TRIM24/TIF-1α locus (7p34) in about 10% of the cases. Moreover, data obtained from 108 cases showed a significant correlation between genomic alterations (gains and losses) and mRNA levels. The TRIM24/TIF-1α gene promoter has not been characterized, but it might be interesting to define additional levels of regulation that probably take place and which transcription factor(s) driving its expression might account for its deregulated expression in breast cancer. Concerning TRIM24/TIF-1α locus copy number, it should be mentioned that the chromosome 7 array analysis in primary papillary renal cell carcinoma showed that the majority of genes exhibited an increase in their copy number and particularly TRIM24/TIF-1α, which showed the highest frequencies of gain.31 To extend these observations, our unpublished data also revealed gain in copy number of this locus in colon (32.2%) and ovarian (20.3%) cancers, respectively, in 177 and 128 patients (data not shown).
Overexpression of TRIM24/TIF-1α in breast cancer as compared to normal tissues was also observed when we performed the analysis at the protein level using the in-house TS1 polyclonal antibody directed against the TRIM24/TIF-1α protein. Both in MCF-7 breast cancer cells and in formalin-fixed paraffin-embedded sections of breast carcinomas, TRIM24/TIF-1α protein was almost exclusively detected in nuclei. On serial carcinoma tissue sections, similar staining was observed with a commercially available polyclonal H-190 antibody from Santa Cruz, raised against amino acids 631-820 of human TRIM24/TIF-1α (see Supplemental Figure S2 at http://ajp.amjpathol.org). However, the TS1 antibody showed a greater sensibility than H-190 antibody.
In normal breast tissues, the presence of TRIM24/TIF-1α protein was not only detected in epithelial cells in acini and ducts, but also in arteriole endothelial and muscular cells, in adipocytes, and in fibroblasts. In contrast, myoepithelial cells as well as lymphocytes were not labeled. Interestingly, the TRIM24/TIF-1α protein expression was very weak in nuclei of the luminal epithelial layer of normal ducts or in DCIS samples, whereas intense labeling of nuclei of epithelial cells was observed in IDC and IDCM, thus confirming the increased expression in breast cancer tissues observed at the mRNA level.
We then investigated whether TRIM24/TIF-1α expression was correlated with tumor prognosis. At the mRNA level, on a series of 238 breast cancer biopsy specimens from the Perou's group,16 we observed high TRIM24/TIF-1α expression strongly correlated with bad prognosis classification based either on recurrence score24 or the 70-gene model.21,22 Similarly, a highly significant difference in expression was found using the intrinsic molecular subtype classification20 between good prognosis tumors (normal and luminal A) and cancers with bad outcome (basal-like, luminal B and HER2+/ER-) which express higher amounts of TRIM24/TIF-1α mRNA. When the analysis was performed at the protein level by immunohistochemistry, we failed to confirm some of these correlations. For instance, we did not find that TRIM24/TIF-1α protein levels were significantly correlated with lymph node invasion or with ERα expression. This might be due to the fact that the number of samples on our tissue microarray was too small and other studies will be required to extend the number of biopsy specimens. In addition, it will be interesting to perform the analysis both at the mRNA and protein levels using the same tumor set to avoid sample heterogeneity.
Log rank test analysis performed at both the mRNA and protein levels showed a significantly worse OS in patients with high levels of TRIM24/TIF-1α expression (P < 0.001 and P = 0.025, respectively). Moreover, multivariate analysis identified TRIM24/TIF-1α protein level as an independent prognostic factor for OS (Table 2). Interestingly, similar results were obtained at the mRNA level. If we excluded the 70-gene signature, multivariate analysis controlling for eight parameters (ie, TRIM24/TIF-1α levels, tumor size and grade, ER expression, intrinsic molecular subtype, 2-gene ratio, wound-response, and the recurrence score) confirmed that TRIM24/TIF-1α was an independent predictor of OS (P = 0.048). This suggests that TRIM24/TIF-1α may improve the prognostic strength of currently available biomarkers and performs better than some multigene assays for the prediction of OS.
We did not observe a significant difference in patient outcome depending on whether the tumor had a gain or a loss of the TRIM24/TIF-1α gene locus (analysis performed on the 108 patients described in Figure 1B). This is probably due to the fact that only very few deaths occurred in patients with loss (2 deaths) or gain (1 death) at the TRIM24/TIF-1α locus and a more global analysis would be necessary to clearly determine whether or not there is a difference between gain or loss of gene locus on patient outcome.
Although it will be necessary to confirm the results on a larger set of tumors, our data altogether strongly indicate that increased expression of TRIM24/TIF-1α gene is linked to a group of proliferating breast cancers with adverse outcome. It is interesting that TRIM24/TIF-1α retains its prognostic value for OS in patients with ER-positive tumors (data not shown). The presence of ER/PR is typically used as a rational basis for hormonal treatment. Our results suggest that TRIM24/TIF-1α might provide an additional criterion for implementation of such therapies.
Increased expression of TRIM24/TIF-1α during cancer progression might appear paradoxical since it was recently proposed that this gene functions as a liver-specific tumor suppressor in mice.26 This liver specific effect (together with the association with prognosis and survival that we evidenced in the present study) may be linked to the p53 E3-ubiquitin ligase activity of TRIM24/TIF-1α. Indeed, the overexpression of TRIM24/TIF-1α in breast cancer may negatively regulate p53 levels and lead to increased tumorigenesis. By contrast, the liver presents some specificity in term of p53 response to environmental stress such as ultraviolet irradiation since there is a lack of p53 and apoptosis induction in this tissue in response to irradiation.32
In conclusion, the present study is the first report showing that TRIM24/TIF-1α expression is increased in human breast cancer and might be considered as a new prognostic marker of this disease. Further work is needed to explore whether TRIM24/TIF-1α might represent a novel prognosis marker useful to clarify the heterogeneity of clinical outcome in ER-positive breast cancer.
Acknowledgments
We thank Jean-Yves Cance for artwork. This work is dedicated to the memory of Regine Losson.
Footnotes
Supported in part by INSERM, GEFLUC, ARC, and the Université de Montpellier 1.
M.C. and B.O. contributed equally to this work.
Supplemental material for this article can be found on http://ajp.amjpathol.org or at doi: 10.1016/j.ajpath.2010.12.026.
Current address of V.D., Institut de Génétique et de Biologie Moléculaire et Cellulaire, INSERM U596, CNRS UMR7104, Université Louis Pasteur de Strasbourg, CU de Strasbourg, France; of S.T., Institut de Génomique Fonctionnelle de Lyon, Université de Lyon, Université Lyon 1, CNRS, INRA, Ecole Normale Supérieure de Lyon, France.
Supplementary data
TRIM24/TIF-1α expression in other cell types. TRIM24/TIF-1α protein expression was detected with TS1 antibody in FFPE sections of an IDC: (A) Nuclei of vascular endothelial (long arrow) and some muscular (short arrow) cells appeared strongly labeled; (B) nuclei of adipocytes (arrow) and (C) of stromal fibroblast (arrow) presented a distinct immunostaining, while (D) no expression was found in lymphocytes nuclei. Original magnification ×630. Scale bars = 10 μm.
Comparison of two TRIM24/TIF-1α antibodies. Normal breast duct (A, C) and infiltrating duct carcinoma (B, D) sections were processed with a microwave oven treatment before immunolabeling with the TS1 (1/3000) (A, B) or (H-190, 1/100) (C, D) antibodies Original magnification ×630. Scale bars = 10 μm.
References
- 1.Le Douarin B., Zechel C., Garnier J.M., Lutz Y., Tora L., Pierrat P., Heery D., Gronemeyer H., Chambon P., Losson R. The N-terminal part of TIF1, a putative mediator of the ligand-dependent activation function (AF-2) of nuclear receptors, is fused to B-raf in the oncogenic protein T18. EMBO J. 1995;14:2020–2033. doi: 10.1002/j.1460-2075.1995.tb07194.x. [DOI] [PMC free article] [PubMed] [Google Scholar]
- 2.Thenot S., Henriquet C., Rochefort H., Cavailles V. Differential interaction of nuclear receptors with the putative human transcriptional coactivator hTIF1. J Biol Chem. 1997;272:12062–12068. doi: 10.1074/jbc.272.18.12062. [DOI] [PubMed] [Google Scholar]
- 3.Le Douarin B., Nielsen A.L., Garnier J.M., Ichinose H., Jeanmougin F., Losson R., Chambon P. A possible involvement of TIF1 alpha and TIF1 beta in the epigenetic control of transcription by nuclear receptors. EMBO J. 1996;15:6701–6715. [PMC free article] [PubMed] [Google Scholar]
- 4.Le Douarin B., You J., Nielsen A.L., Chambon P., Losson R. TIF1alpha: a possible link between KRAB zinc finger proteins and nuclear receptors. J Steroid Biochem Mol Biol. 1998;65:43–50. doi: 10.1016/s0960-0760(97)00175-1. [DOI] [PubMed] [Google Scholar]
- 5.Teyssier C., Ou C.Y., Khetchoumian K., Losson R., Stallcup M.R. Transcriptional intermediary factor 1 alpha mediates physical interaction and functional synergy between the coactivator-associated arginine methyltransferase 1 and glucocorticoid receptor-interacting protein 1 nuclear receptor coactivators. Mol Endocrinol. 2006;20:1276–1286. doi: 10.1210/me.2005-0393. [DOI] [PMC free article] [PubMed] [Google Scholar]
- 6.Haynes S.R., Dollard C., Winston F., Beck S., Trowsdale J., Dawid I.B. The bromodomain: a conserved sequence found in human: Drosophila and yeast proteins. Nucleic Acids Res. 1992;20:2603. doi: 10.1093/nar/20.10.2603. [DOI] [PMC free article] [PubMed] [Google Scholar]
- 7.Reddy B.A., Etkin L.D., Freemont P.S. A novel zinc finger coiled-coil domain in a family of nuclear proteins. Trends Biochem Sci. 1992;17:344–345. doi: 10.1016/0968-0004(92)90308-v. [DOI] [PubMed] [Google Scholar]
- 8.Nielsen A.L., Ortiz J.A., You J., Oulad-Abdelghani M., Khechumian R., Gansmuller A., Chambon P., Losson R. Interaction with members of the heterochromatin protein 1 (HP1) family and histone deacetylation are differentially involved in transcriptional silencing by members of the TIF1 family. EMBO J. 1999;18:6385–6395. doi: 10.1093/emboj/18.22.6385. [DOI] [PMC free article] [PubMed] [Google Scholar]
- 9.Fraser R.A., Heard D.J., Adam S., Lavigne A.C., Le Douarin B., Tora L., Losson R., Rochette-Egly C., Chambon P. The putative cofactor TIF1alpha is a protein kinase that is hyperphosphorylated upon interaction with liganded nuclear receptors. J Biol Chem. 1998;273:16199–16204. doi: 10.1074/jbc.273.26.16199. [DOI] [PubMed] [Google Scholar]
- 10.Allton K., Jain A.K., Herz H.M., Tsai W.W., Jung S.Y., Qin J., Bergmann A., Johnson R.L., Barton M.C. Trim24 targets endogenous p53 for degradation. Proc Natl Acad Sci USA. 2009;106:11612–11616. doi: 10.1073/pnas.0813177106. [DOI] [PMC free article] [PubMed] [Google Scholar]
- 11.Remboutsika E., Lutz Y., Gansmuller A., Vonesch J.L., Losson R., Chambon P. The putative nuclear receptor mediator TIF1alpha is tightly associated with euchromatin. J Cell Sci. 1999;112:1671–1683. doi: 10.1242/jcs.112.11.1671. [DOI] [PubMed] [Google Scholar]
- 12.Niederreither K., Remboutsika E., Gansmuller A., Losson R., Dollé P. Expression of the transcriptional intermediary factor TIF1alpha during mouse development and in the reproductive organs. Mech Dev. 1999;88:111–117. doi: 10.1016/s0925-4773(99)00175-6. [DOI] [PubMed] [Google Scholar]
- 13.LeDouarin B., Zechel C., Garnier J.M., Lutz Y., Tora L., Pierrat P., Heery D., Gronemeyer H., Chambon P., Losson R. The N-terminal part of TIF1, a putative mediator of the ligand- dependent activation function (AF-2) of nuclear receptors, is fused to B-raf in the oncogenic protein T18. EMBO J. 1995;14:2020–2033. doi: 10.1002/j.1460-2075.1995.tb07194.x. [DOI] [PMC free article] [PubMed] [Google Scholar]
- 14.Zhong S., Delva L., Rachez C., Cenciarelli C., Gandini D., Zhang H., Kalantry S., Freedman L.P., Pandolfi P.P. A RA-dependent, tumour-growth suppressive transcription complex is the target of the PML-RARalpha and T18 oncoproteins. Nat Genet. 1999;23:287–295. doi: 10.1038/15463. [DOI] [PubMed] [Google Scholar]
- 15.Klugbauer S., Rabes H.M. The transcription coactivator HTIF1 and a related protein are fused to the RET receptor tyrosine kinase in childhood papillary thyroid carcinomas. Oncogene. 1999;18:4388–4393. doi: 10.1038/sj.onc.1202824. [DOI] [PubMed] [Google Scholar]
- 16.Fan C., Oh D.S., Wessels L., Weigelt B., Nuyten D.S., Nobel A.B., van't Veer L.J., Perou C.M. Concordance among gene-expression-based predictors for breast cancer. N Engl J Med. 2006;355:560–569. doi: 10.1056/NEJMoa052933. [DOI] [PubMed] [Google Scholar]
- 17.Bertucci F., Orsetti B., Negre V., Finetti P., Rouge C., Ahomadegbe J.C., Bibeau F., Mathieu M.C., Treilleux I., Jacquemier J., Ursule L., Martinec A., Wang Q., Benard J., Puisieux A., Birnbaum D., Theillet C. Lobular and ductal carcinomas of the breast have distinct genomic and expression profiles. Oncogene. 2008;27:5359–5372. doi: 10.1038/onc.2008.158. [DOI] [PMC free article] [PubMed] [Google Scholar]
- 18.Orsetti B., Nugoli M., Cervera N., Lasorsa L., Chuchana P., Rouge C., Ursule L., Nguyen C., Bibeau F., Rodriguez C., Theillet C. Genetic profiling of chromosome 1 in breast cancer: mapping of regions of gains and losses and identification of candidate genes on 1q. Br J Cancer. 2006;95:1439–1447. doi: 10.1038/sj.bjc.6603433. [DOI] [PMC free article] [PubMed] [Google Scholar]
- 19.Soule H.D., Vazguez J., Long A., Albert S., Brennan M. A human cell line from a pleural effusion derived from a breast carcinoma. J Natl Cancer Inst. 1973;51:1409–1416. doi: 10.1093/jnci/51.5.1409. [DOI] [PubMed] [Google Scholar]
- 20.Perou C.M., Sorlie T., Eisen M.B., van de R.M., Jeffrey S.S., Rees C.A., Pollack J.R., Ross D.T., Johnsen H., Akslen L.A., Fluge O., Pergamenschikov A., Williams C., Zhu S.X., Lonning P.E., Borresen-Dale A.L., Brown P.O., Botstein D. Molecular portraits of human breast tumours. Nature. 2000;406:747–752. doi: 10.1038/35021093. [DOI] [PubMed] [Google Scholar]
- 21.van de Vijver M.J., He Y.D., van't Veer L.J., Dai H., Hart A.A., Voskuil D.W., Schreiber G.J., Peterse J.L., Roberts C., Marton M.J., Parrish M., Atsma D., Witteveen A., Glas A., Delahaye L., van d V., Bartelink H., Rodenhuis S., Rutgers E.T., Friend S.H., Bernards R. A gene-expression signature as a predictor of survival in breast cancer. N Engl J Med. 2002;347:1999–2009. doi: 10.1056/NEJMoa021967. [DOI] [PubMed] [Google Scholar]
- 22.'t Veer L.J., Dai H., van de Vijver M.J., He Y.D., Hart A.A., Mao M., Peterse H.L., van der K.K., Marton M.J., Witteveen A.T., Schreiber G.J., Kerkhoven R.M., Roberts C., Linsley P.S., Bernards R., Friend S.H. Gene expression profiling predicts clinical outcome of breast cancer. Nature. 2002;415:530–536. doi: 10.1038/415530a. [DOI] [PubMed] [Google Scholar]
- 23.Chang H.Y., Nuyten D.S., Sneddon J.B., Hastie T., Tibshirani R., Sorlie T., Dai H., He Y.D., van'T Veer L.J., Bartelink H., van de R.M., Brown P.O., van de Vijver M.J. Robustness, scalability, and integration of a wound-response gene expression signature in predicting breast cancer survival. Proc Natl Acad Sci USA. 2005;102:3738–3743. doi: 10.1073/pnas.0409462102. [DOI] [PMC free article] [PubMed] [Google Scholar]
- 24.Paik S., Shak S., Tang G., Kim C., Baker J., Cronin M., Baehner F.L., Walker M.G., Watson D., Park T., Hiller W., Fisher E.R., Wickerham D.L., Bryant J., Wolmark N. A multigene assay to predict recurrence of tamoxifen-treated, node-negative breast cancer. N Engl J Med. 2004;351:2817–2826. doi: 10.1056/NEJMoa041588. [DOI] [PubMed] [Google Scholar]
- 25.Ma X.J., Wang Z., Ryan P.D., Isakoff S.J., Barmettler A., Fuller A., Muir B., Mohapatra G., Salunga R., Tuggle J.T., Tran Y., Tran D., Tassin A., Amon P., Wang W., Wang W., Enright E., Stecker K., Estepa-Sabal E., Smith B., Younger J., Balis U., Michaelson J., Bhan A., Habin K., Baer T.M., Brugge J., Haber D.A., Erlander M.G., Sgroi D.C. A two-gene expression ratio predicts clinical outcome in breast cancer patients treated with tamoxifen. Cancer Cell. 2004;5:607–616. doi: 10.1016/j.ccr.2004.05.015. [DOI] [PubMed] [Google Scholar]
- 26.Khetchoumian K., Teletin M., Tisserand J., Herquel B., Ouararhni K., Losson R. Trim24 (Tif1 alpha): an essential ‘brake’ for retinoic acid-induced transcription to prevent liver cancer. Cell Cycle. 2008;7:3647–3652. doi: 10.4161/cc.7.23.7123. [DOI] [PubMed] [Google Scholar]
- 27.Rhodes D.R., Yu J., Shanker K., Deshpande N., Varambally R., Ghosh D., Barrette T., Pandey A., Chinnaiyan A.M. ONCOMINE: a cancer microarray database and integrated data-mining platform. Neoplasia. 2004;6:1–6. doi: 10.1016/s1476-5586(04)80047-2. [DOI] [PMC free article] [PubMed] [Google Scholar]
- 28.Richardson A.L., Wang Z.C., De Nicolo A., Lu X., Brown M., Miron A., Liao X., Iglehart J.D., Livingston D.M., Ganesan S. X chromosomal abnormalities in basal-like human breast cancer. Cancer Cell. 2006;9:121–132. doi: 10.1016/j.ccr.2006.01.013. [DOI] [PubMed] [Google Scholar]
- 29.Gandini D., De Angeli C., Aguiari G., Manzati E., Lanza F., Pandolfi P.P., Cuneo A., Castoldi G.L., del Senno L. Preferential expression of the transcription coactivator HTIF1alpha gene in acute myeloid leukemia and MDS-related AML. Leukemia. 2002;16:886–893. doi: 10.1038/sj.leu.2402452. [DOI] [PubMed] [Google Scholar]
- 30.Popanda O., Zheng C., Magdeburg J.R., Buttner J., Flohr T., Hagmuller E., Thielmann H.W. Mutation analysis of replicative genes encoding the large subunits of DNA polymerase alpha and replication factors A and C in human sporadic colorectal cancers. Int J Cancer. 2000;86:318–324. doi: 10.1002/(sici)1097-0215(20000501)86:3<318::aid-ijc3>3.0.co;2-b. [DOI] [PubMed] [Google Scholar]
- 31.Strefford J.C., Stasevich I., Lane T.M., Lu Y.J., Oliver T., Young B.D. A combination of molecular cytogenetic analyses reveals complex genetic alterations in conventional renal cell carcinoma. Cancer Genet Cytogenet. 2005;159:1–9. doi: 10.1016/j.cancergencyto.2004.09.020. [DOI] [PubMed] [Google Scholar]
- 32.Jain A.K., Barton M.C. Regulation of p53: tRIM24 enters the RING. Cell Cycle. 2009;8:3668–3674. doi: 10.4161/cc.8.22.9979. [DOI] [PubMed] [Google Scholar]
Associated Data
This section collects any data citations, data availability statements, or supplementary materials included in this article.
Supplementary Materials
TRIM24/TIF-1α expression in other cell types. TRIM24/TIF-1α protein expression was detected with TS1 antibody in FFPE sections of an IDC: (A) Nuclei of vascular endothelial (long arrow) and some muscular (short arrow) cells appeared strongly labeled; (B) nuclei of adipocytes (arrow) and (C) of stromal fibroblast (arrow) presented a distinct immunostaining, while (D) no expression was found in lymphocytes nuclei. Original magnification ×630. Scale bars = 10 μm.
Comparison of two TRIM24/TIF-1α antibodies. Normal breast duct (A, C) and infiltrating duct carcinoma (B, D) sections were processed with a microwave oven treatment before immunolabeling with the TS1 (1/3000) (A, B) or (H-190, 1/100) (C, D) antibodies Original magnification ×630. Scale bars = 10 μm.