

Abstract
Aims
Polymorphisms in the 5′ regulatory region of the thymidylate synthase gene (TYMS) have been shown to modulate thymidylate synthase expression and are associated with resistance to fluoropyrimidine-based therapies. These polymorphisms include a two repeat (2R) or three repeat (3R) of a 28-bp sequence and a G>C SNP in the second repeat of the 3R allele (TSER*3 G>C). Genotyping methods for the TYMS 5′-UTR polymorphisms have typically involved visualizing PCR and RFLP products on agarose gels. This article describes the use of a robust capillary electrophoresis assay for TYMS 5′-UTR genotyping.
Materials & methods
As part of pharmacogenetic studies, we performed TYMS genotyping for the 5′-UTR polymorphisms in 314 colorectal cancer patients. A gel-based capillary electrophoresis method, employing a high-resolution gel cartridge on a QIAxcel® system, was developed to detect PCR products and RFLP fragment sizes.
Results
The high resolution of the capillary electrophoresis technique allowed identification of a 6-bp insertion in the second repeat of the 3R allele in three patients. The frequency of the insertion allele was 0.4% in Caucasians and 1.3% in African–Americans. We also found 3.3% of Caucasian patients were heterozygous for a G>C SNP in the first repeat of the 2R allele, but this allele was not observed in the African–American patients.
Conclusion
We describe a robust RFLP genotyping technique that employs size discrimination by capillary electrophoresis to genotype the TYMS TSER*3 G>C SNP. The technique also allows identification of a 6-bp insertion in the 3R allele, and we report the allelic frequencies for two uncommon TSER alleles.
Keywords: 2RC allele frequency, 5′-UTR 6-bp insertion, capillary gel electrophoresis, QIAxcel, TSER*3 G>C, TSER tandem repeat, TYMS, TYMS 2RC allele
Thymidylate synthase (TS) is a key enzyme in nucleotide synthesis that catalyzes the methylation of dUMP to dTMP. The TS reaction is the sole de novo source of thymidylate in the cell and is essential for DNA replication. Accordingly, TS has been an important target for a variety of chemotherapeutic agents such as 5-fluorouracil (5-FU) or capecitabine (Xeloda®), and its over-expression has been linked to resistance to fluoropyrimidine-based chemotherapy in numerous cancers [1-6].
A polymorphism in the TS gene (TYMS) promoter enhancer region (TSER), consisting of tandem repeats of 28 bp, has been implicated in modulating TS mRNA expression [7,8] and translational efficiency [9]. The most common alleles are the double repeat (2R, TSER*2) and triple repeat (3R, TSER*3). In vitro and in vivo studies have shown that increasing the number of repeats (from 2R to 3R) leads to a stepwise increase in TS expression [7,10,11]. In addition, a common G>C substitution at the 12th nucleotide in the second repeat of the 3R allele has been identified (TSER*3 G>C, rs2853542) [12]. This SNP changes a critical residue in the upstream stimulatory factor E-box consensus element (CACTTG>CACTTC). This abolishes one E-box in the 3R allele, which leads to a decrease in TYMS transcription, such that 3RC has lower transcriptional activity than 3RG, but similar activity to 2R [13].
A rare G>C SNP in the TYMS 2R allele, carrying a G>C base change at the 12th nucleotide of the first 28-bp repeat has also been described (2RC) [14,15]. A recent functional study demonstrated that the transcriptional activity of the 2RC allele promoter is lowest among the known alleles, which is consistent with the SNP altering the single E-box of the 2R allele [16]. To date, only two studies have reported the 2RC allele frequency, which was found to be 1.5% in 100 Caucasian colorectal cancer patients in an Italian study [14], and 4.2% in 59 Caucasian colorectal cancer patients in Australia [15].
As part of cancer pharmacogenetic studies, we genotyped 314 5-FU-treated cancer patients for the TYMS tandem repeat polymorphism and the TSER*3 G>C SNP using RFLP combined with fragment size detection by gel-based capillary electrophoresis. In this study, we report the benefit of this new method for detecting small insertion/deletions, and report the frequencies of two rare TYMS alleles in 314 colorectal patients.
Materials & methods
Patients
We studied 314 colorectal patients. The patient cohort included 135 rectal cancer patients receiving first-line neoadjuvant chemoradiation, and 179 patients receiving first-line therapy for metastatic colorectal cancer. The study was approved by the institutional review boards at Washington University School of Medicine (MO, USA) and the University of North Carolina (NC, USA). The total population included 270 Caucasians, 38 African–Americans, two Asians and four individuals belonging to other races (one Hispanic, one Native Hawaiian or Pacific Islander and two unknown). Informed consent was obtained from all participants prior to enrollment.
Genotyping
The 314 samples were genotyped for the TSER*3 G>C SNP. Genomic DNA was extracted from peripheral blood samples and PCR was performed using the primers previously described [17], with the following modifications. The PCR mixture contained HotStarTaq® Plus Master Mix (1X) (Qiagen, Hilden, Germany), Q solution (1X) (Qiagen), 1 μM of each primer and 1.5 ng of DNA in a 15 μl final volume. The thermocycler conditions were as follows: initial incubation at 95°C for 5 min followed by 40 amplification cycles (30 s at 94°C, 30 s at 60°C and 1 min at 72°C) and a final elongation at 72°C for 10 min. Instead of running the PCR products on a 4% agarose gel to visualize the bands, amplicons were sized using a QIAxcel® DNA high-resolution gel cartridge (Qiagen) on a QIAxcel system (Qiagen), which enabled high-resolution capillary electrophoresis. A 25–450 bp QX DNA Size Marker (Qiagen) was included on QIAxcel runs and the size of the products was determined using the Biocalculator software (Qiagen). The QX Alignment Marker (Qiagen), which consisted of 15-bp and 500-bp bands, was automatically injected onto the cartridge with each sample by the QIAxcel system and enabled the software to align the lanes. The QIAxcel system produces a digital gel image and an electropherogram for fragment analysis.
The QIAxcel system used a standardized volume (less than 0.1 μl) for each analysis of the 15 μl of PCR product that was placed on the QIAxcel. We used the OH700 method to analyze the PCR products. The expected PCR product sizes were 214 bp (2R), 242 bp (3R) and 270 bp (4R).
For the purpose of comparison, PCR products from samples displaying a representative panel of genotypes were also analyzed with a 4% agarose gel [12].
Afterwards, the PCR products were digested with HaeIII as previously described, with minor modifications [12]. Briefly, 10 μl of PCR product was incubated with the HaeIII restriction enzyme (New England Biolabs, MA, USA) in a 15 μl reaction, containing 3 units of restriction enzyme, 1X NE buffer 2 and water at 37°C for 16 h followed by 20 min at 80°C to inactivate the enzyme. The digested products were diluted (1/10) in the dilution buffer provided by the cartridge kit and the size of the digested products was determined using a QIAxcel DNA high-resolution gel cartridge on a QIAxcel system, as described above, using the OL700 method. The expected fragment sizes were as follows: 2RC: 12, 44, 45 and 113 bp; 2RG: 12, 44, 45, 47 and 66 bp; 3RG: 12, 28, 44, 45, 47 and 66 bp; 3RC: 12, 44, 45, 47 and 94 bp.
Sequencing
For homozygous samples for the TSER polymorphism, the PCR products (2R/2R or 3R/3R) obtained as described above, were purified with the QIAquick® PCR Purification Kit (Qiagen) according to the manufacturer guidelines, and directly sequenced. For heterozygous samples, the PCR products were first separated in a 4% low-melt agarose gel. Each band (2R or 3R) was cut from the gel and the DNA was extracted using the QIAquick Gel Extraction Kit (Qiagen) and purified with the QIAquick PCR Purification Kit. The two alleles were sequenced separately. The sequencing reaction was performed using the ABI PRISM™ Big Dye™ version 1.1 Terminator Cycle Sequencing Ready Reaction Kit with AmpliTaq® DNA polymerase, FS (Applied Biosystems, Foster City, CA USA) with the PCR reverse primer used as the sequencing primer. DNA was sequenced at the Genome Analysis Facility of University of North Carolina, Chapel Hill on a 3730xl DNA Analyzer (Applied Biosystems).
Results & discussion
All samples were genotyped for the TSER polymorphism using the QIAxcel system, and most of them displayed expected patterns of bands on the gel image, as shown in lanes 1–3 of Figure 1. However, in three samples, a 248-bp band was observed, suggesting a 6-bp insertion (ins) in the 3R allele (see Figure 1A lane 4 for 2R/3R-ins genotype). The interpretation of the gel image was confirmed by the electropherogram, which showed the peak size (see Figure 1B & 1C). The direct sequencing of two out of the three samples was performed and confirmed the presence of a 6-bp insertion (CCCCCG) in the second repeat of the 3R allele (Table 1). The results obtained with the QIAxcel were similar to those observed on a 4% agarose gel, except for two samples carrying the 6-bp insertion in the 3R allele that were not identified with the agarose gel method. Figure 1A & 1D illustrate the benefit of using the QIAxcel system over the 4% agarose gel to distinguish between 3R and 3R-ins alleles. Although the size difference between 3R and 3R-ins is slight, it is visible on the gel image provided by the QIAxcel system (and confirmed by the electropherograms), but is easily overlooked on the agarose gel.
Figure 1. Visualization of PCR products for TSER genotyping.
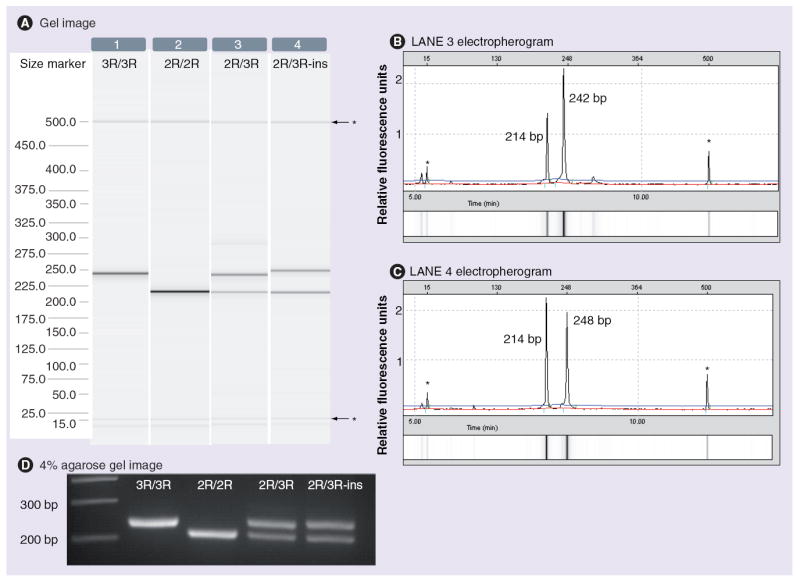
(A) Gel images (lanes 1–4) and (B & C) electropherograms (displayed for lanes 3 and 4 only) created by the Biocalculator software (QIAxcel) for TSER polymorphism discrimination. Lane 4 shows the pattern of a 2R/3R-ins genotype: the 3R band is slightly larger (248 bp) than the normal 3R band (242 bp) shown in lane 3. The gel image is complemented by the electropherograms (B & C), which provide the sizes of the DNA fragments that are detected in lanes 3 and 4, respectively. (D) Gel image obtained with a 4% agarose gel for the indicated genotypes.
*Alignment markers.
Table 1.
Nucleotide sequences and frequencies of the 3RC-ins and 2RC alleles described in this study.
| Allele | Repeat number | Nucleotide sequence | Caucasians carrying the allele (n) | Allele frequency in Caucasians | African–Americans carrying the allele | Allele frequency in African–Americans |
|---|---|---|---|---|---|---|
| 3RC-ins | 1st repeat | CCGCGCCACTTGGCCTGCCTCCGTCCCG | 2/270† | 0.0037 | 1/38† | 0.0132 |
| 2nd repeat | CCGCGCCACTTCGCCTGCCTCCGTcccccgCCCG | |||||
| 3rd repeat | CCGCGCCACTTCGCCTGCCTCCGTCCCCCGCCCG | |||||
|
| ||||||
| 2RC | 1st repeat | CCGCGCCACTTCGCCTGCCTCCGTCCCG | 9/270† | 0.0167 | 0/38 | 0 |
| 2nd repeat | CCGCGCCACTTCGCCTGCCTCCGTCCCCCGCCCG | |||||
The differences compared with wild-type sequence are in bold. The lowercase bold nucleotides represent the 6-bp insertion and the uppercase bold nucleotide is a G>C single nucleotide substitution.
All individuals were heterozygous for the alleles.
In Figure 2, lanes 1–4 depict some examples of the digestion patterns obtained with the gel-based capillary electrophoresis system. For the three carriers of the 6-bp insertion mentioned above, a 100-bp band was observed instead of a 94-bp band, as shown in lane 4 of Figure 2. Of note, the 6-bp insertion was only found in the 3RC allele (3RC-ins) and generated the 100-bp band after digestion. The electropherograms shown in Figure 2B & 2C confirmed the 6-bp size difference between the 94 and 100-bp peaks. The three patients with the 3RC-ins were heterozygous: one carried genotype 3RG/3RC-ins and two were 2RG/3RC-ins.
Figure 2. Visualization of RFLP products for TSER*3 G>C genotyping.
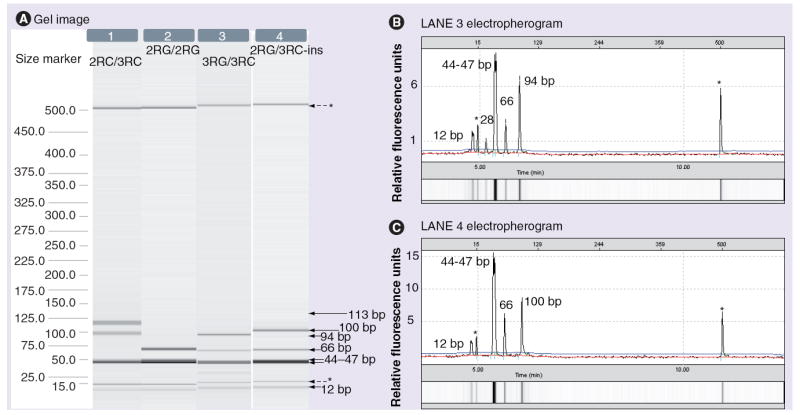
(A) Gel images (lanes 1–4), and (B & C) electropherograms (displayed for lanes 3 and 4 only) created by the Biocalculator software (QIAxcel) for TSER*3 G>C SNP genotyping after digestion with HaeIII. The corresponding genotypes are indicated on the top of each lane and were deduced from runs obtained before (not shown here) and after digestion of PCR products.
*Alignment markers.
To our knowledge, the 3RC-ins allele has not been previously reported in Caucasians or African–Americans. In 2006, it was identified in Japanese individuals with a frequency of 0.6% [18]. Most of the published pharmacogenetic studies that have genotyped the TSER polymorphism in the past 10 years used 2–4% agarose gels to visualize PCR and digested products. Agarose gels do not provide enough discriminatory power to detect a 6-bp difference in fragment size, which may explain why the 3RC-ins allele has not been reported by most previous studies.
Here, we describe the use of a gel-based capillary electrophoresis technique that sizes DNA amplicons and fragments with high resolution, thereby allowing for the discrimination between TSER 3RC and 3RC-ins alleles, which differ in size by 6 bp. The frequency of the 3RC-ins allele in our study was 0.4% in Caucasians and 1.3% in African–Americans (Table 1). To date, the functional consequences of the 6-bp insertion have not been investigated. However, it is possible that the presence of the 6-bp insertion affects the proposed stem loop structure formed by association of the inverted and direct repeats [8]. Nevertheless, specific confirmatory studies are required. It was also possible to detect the rare 2RC allele using the electrophoresis system, although the 113-bp band generated after digestion for the 2RC allele can also be visualized with an agarose gel [12]. Indeed, the G>C SNP in the first repeat of the 2R allele disrupts the restriction site and leads to a 113-bp band after digestion by HaeIII, which was easily detected by the QIAxcel system (see lane 1, Figure 2A). The frequency of the allele has only been reported twice in Caucasians. Of note, the 2RC allele was not found in the 263 Japanese patients mentioned earlier [18]. In our study, we found nine patients that were heterozygous for the 2RC allele and all of them were Caucasian (3.3%), therefore the allelic frequency was 1.7% in this population (Table 1). Four out of the nine samples identified as 2RC by gel-based electrophoresis were sequenced and the genotypes were confirmed in all cases. All patients carrying a 2RC allele were heterozygous: five were 2RC/2RG, three were 2RC/3RC and one was 2RC/3RG. The frequency of the 2RC allele that we report here is in agreement with that previously described in Caucasians (1.5–4.2%) [14,15] but was determined with a greater number of patients (i.e., 314 patients vs 100 and 59 patients in previous studies). Of note, our population included 38 African–Americans and the 2RC allele was not found in this subgroup of patients. Nevertheless, a larger cohort of African–Americans needs to be studied before drawing conclusions regarding the 2RC allele frequency in this population.
Conclusion
We describe an improvement over the existing method for TSER genotyping and report the frequencies of two uncommon TSER alleles. We sized PCR and RFLP products on the QIAxcel system with a QIAxcel DNA high resolution gel cartridge, which allowed for the identification of a rare TSER allele, which contains a 6-bp insertion (CCCCCG) in the second repeat of the 3RC allele. Indeed, the high-resolution automated electrophoresis system can resolve bands of 3–5 bp size difference (see manufacturer’s instructions [101]). We recommend that future studies investigating the role of TYMS polymorphisms in drug response and/or toxicity use this method of detection so that we can improve our knowledge regarding the 3RC-ins allele frequency and its putative functional consequences.
Executive summary.
TYMS polymorphisms & fluoropyrimidine-based chemotherapy
-
▪
TYMS genetic polymorphisms have been shown to have an impact on fluoropyrimidine-based treatment resistance.
-
▪
The TSER polymorphisms in the 5′-UTR region of TYMS, which consists of two or more repeats of a 28-bp sequence and a G>C SNP at the 12th nucleotide in the second repeat of the 3R allele, are often investigated by visualizing PCR and RFLP products on agarose gels.
Capillary electrophoresis using the QIAxcel® system improves small insertion/deletion detection
-
▪
This study describes the use of a robust capillary electrophoresis assay using the QIAxcel system for TYMS 5′-UTR genotyping, which also allows identification of a 6-bp insertion in the 3R allele (3RC-ins) that is probably not detectable with the agarose gels usually used for TYMS genotyping.
Frequency report
-
▪
The frequency of the 3RC-ins allele was 0.4% in Caucasians and 1.3% in African–Americans.
-
▪
We found 3.3% of Caucasian patients were heterozygous for a G>C SNP in the first repeat of the 2R allele (2RC) and this allele was not observed in the African–American patients.
Conclusion
-
▪
The functional consequence of the 6-bp insertion in the 3R allele remains to be determined.
-
▪
Future pharmacogenetic studies are encouraged to use this high-resolution system for TYMS genotyping to determine whether the 3RC-ins allele influences clinical outcomes in patients treated with fluoropyrimidines.
Acknowledgments
Fabienne Thomas was supported by a grant from the Fondation de France. Dr Hoskins and Dr McLeod are supported in part by the UNC CTSA Award (UL1RR025747) from the National Center for Research Resources, from the Carolina Partnership, and the University Cancer Research Fund.
Footnotes
Financial & competing interest disclosure The authors have no other relevant affiliations or financial involvement with any organization or entity with a financial interest in or financial conflict with the subject matter or materials discussed in the manuscript apart from those disclosed.
No writing assistance was utilized in the production of this manuscript.
Ethical conduct of research The authors state that they have obtained appropriate institutional review board approval or have followed the principles outlined in the Declaration of Helsinki for all human or animal experimental investigations. In addition, for investigations involving human subjects, informed consent has been obtained from the participants involved.
References
Papers of special note have been highlighted as:
-
▪
of interest
-
▪▪
of considerable interest
- 1.Johnston PG, Fisher ER, Rockette HE, et al. The role of thymidylate synthase expression in prognosis and outcome of adjuvant chemotherapy in patients with rectal cancer. J Clin Oncol. 1994;12(12):2640–2647. doi: 10.1200/JCO.1994.12.12.2640. [DOI] [PubMed] [Google Scholar]
- 2.Johnston PG, Lenz HJ, Leichman CG, et al. Thymidylate synthase gene and protein expression correlate and are associated with response to 5-fluorouracil in human colorectal and gastric tumors. Cancer Res. 1995;55(7):1407–1412. [PubMed] [Google Scholar]
- 3.Leichman CG, Lenz HJ, Leichman L, et al. Quantitation of intratumoral thymidylate synthase expression predicts for disseminated colorectal cancer response and resistance to protracted-infusion fluorouracil and weekly leucovorin. J Clin Oncol. 1997;15(10):3223–3229. doi: 10.1200/JCO.1997.15.10.3223. [DOI] [PubMed] [Google Scholar]
- 4.Lenz HJ, Danenberg KD, Leichman CG, et al. p53 and thymidylate synthase expression in untreated stage II colon cancer: associations with recurrence, survival, and site. Clin Cancer Res. 1998;4(5):1227–1234. [PubMed] [Google Scholar]
- 5.Lenz HJ, Leichman CG, Danenberg KD, et al. Thymidylate synthase mRNA level in adenocarcinoma of the stomach: a predictor for primary tumor response and overall survival. J Clin Oncol. 1996;14(1):176–182. doi: 10.1200/JCO.1996.14.1.176. [DOI] [PubMed] [Google Scholar]
- 6.Salonga D, Danenberg KD, Johnson M, et al. Colorectal tumors responding to 5-fluorouracil have low gene expression levels of dihydropyrimidine dehydrogenase, thymidylate synthase, and thymidine phosphorylase. Clin Cancer Res. 2000;6(4):1322–1327. [PubMed] [Google Scholar]
- 7▪▪.Horie N, Aiba H, Oguro K, Hojo H, Takeishi K. Functional analysis and DNA polymorphism of the tandemly repeated sequences in the 5′-terminal regulatory region of the human gene for thymidylate synthase. Cell Struct Funct. 1995;20(3):191–197. doi: 10.1247/csf.20.191. First genetic study describing the different expression activities of the TYMS alleles containing double and triple tandem repeats in the 5′-UTR. [DOI] [PubMed] [Google Scholar]
- 8.Kaneda S, Takeishi K, Ayusawa D, et al. Role in translation of a triple tandemly repeated sequence in the 5′-untranslated region of human thymidylate synthase mRNA. Nucleic Acids Res. 1987;15(3):1259–1270. doi: 10.1093/nar/15.3.1259. [DOI] [PMC free article] [PubMed] [Google Scholar]
- 9.Kawakami K, Salonga D, Park JM, et al. Different lengths of a polymorphic repeat sequence in the thymidylate synthase gene affect translational efficiency but not its gene expression. Clin Cancer Res. 2001;7(12):4096–4101. [PubMed] [Google Scholar]
- 10.Pullarkat ST, Stoehlmacher J, Ghaderi V, et al. Thymidylate synthase gene polymorphism determines response and toxicity of 5-FU chemotherapy. Pharmacogenomics J. 2001;1(1):65–70. doi: 10.1038/sj.tpj.6500012. [DOI] [PubMed] [Google Scholar]
- 11.Kawakami K, Omura K, Kanehira E, Watanabe Y. Polymorphic tandem repeats in the thymidylate synthase gene is associated with its protein expression in human gastrointestinal cancers. Anticancer Res. 1999;19(4B):3249–3252. [PubMed] [Google Scholar]
- 12▪▪.Mandola MV, Stoehlmacher J, Muller-Weeks S, et al. A novel single nucleotide polymorphism within the 5′ tandem repeat polymorphism of the thymidylate synthase gene abolishes USF-1 binding and alters transcriptional activity. Cancer Res. 2003;63(11):2898–2904. First to describe the G>C SNP in the 3R allele of TYMS. [PubMed] [Google Scholar]
- 13.Kawakami K, Watanabe G. Identification and functional analysis of single nucleotide polymorphism in the tandem repeat sequence of thymidylate synthase gene. Cancer Res. 2003;63(18):6004–6007. [PubMed] [Google Scholar]
- 14▪.Gusella M, Bolzonella C, Crepaldi G, Ferrazzi E, Padrini R. A novel G/C single-nucleotide polymorphism in the double 28-bp repeat thymidylate synthase allele. Pharmacogenomics J. 2006;6(6):421–424. doi: 10.1038/sj.tpj.6500401. Identified the G>C SNP in the 2R allele of TYMS. [DOI] [PubMed] [Google Scholar]
- 15.Lincz LF, Scorgie FE, Garg MB, Ackland SP. Identification of a novel single nucleotide polymorphism in the first tandem repeat sequence of the thymidylate synthase 2R allele. Int J Cancer. 2007;120(9):1930–1934. doi: 10.1002/ijc.22568. [DOI] [PubMed] [Google Scholar]
- 16.de Bock CE, Garg MB, Scott N, et al. Association of thymidylate synthase enhancer region polymorphisms with thymidylate synthase activity in vivo. Pharmacogenomics J. 2010 doi: 10.1038/tpj.2010.43. (Epub ahead of print) [DOI] [PubMed] [Google Scholar]
- 17.Marsh S, Collie-Duguid ES, Li T, Liu X, McLeod HL. Ethnic variation in the thymidylate synthase enhancer region polymorphism among Caucasian and Asian populations. Genomics. 1999;58(3):310–312. doi: 10.1006/geno.1999.5833. [DOI] [PubMed] [Google Scholar]
- 18▪.Kim SR, Ozawa S, Saito Y, et al. Fourteen novel genetic variations and haplotype structures of the TYMS gene encoding human thymidylate synthase (TS) Drug Metab Pharmacokinet. 2006;21(6):509–516. doi: 10.2133/dmpk.21.509. Only paper that has reported the existence of the 6-bp insertion in the 3R allele of TYMS. [DOI] [PubMed] [Google Scholar]
Website
- 101.Qiagen Sample and Assay Technologies. www.qiagen.com/products/qiaxcelsystem.aspx.