Abstract
The rapid transverse relaxation of the sodium magnetic resonance (MR) signal during spatial encoding causes a loss of image resolution, an effect known as T2-blurring. Conventional wisdom suggests that spatial resolution is maximized by keeping the readout duration as short as possible to minimize T2-blurring. Flexible twisted projection imaging (flexTPI) performed with an ultra-short echo time, relative to T2, and a long repetition time, relative to T1, has been shown to be effective for quantitative sodium MR imaging. A minimized readout duration requires a very large number of projections and, consequentially, results in an impractically long total acquisition time to meet these conditions. When the total acquisition time is limited to a clinically practical duration (e.g., 10 minutes), the optimal parameters for maximal spatial resolution of a flexTPI acquisition do not correspond to the shortest possible readout. Simulation and experimental results for resolution optimized acquisition parameters of quantitative sodium flexTPI of parenchyma and cerebrospinal fluid are presented for the human brain at 9.4T and 3T. The effect of signal loss during data collection on sodium quantification bias and image signal-to-noise ratio are discussed.
Keywords: Sodium imaging, quantification, T2-blurring, resolution, flexTPI
Introduction
Quantitative sodium (23Na) magnetic resonance (MR) imaging measures tissue sodium concentration (TSC) that can be interpreted in terms of sodium ion homeostasis and, therefore, tissue viability (1). The derived map of tissue sodium concentration (TSC) has been termed a bioscale as it is a spatially-resolved quantitative parametric map that has a direct biochemical interpretation, distinct from the term biomarker, which has a more limited implication of risk associated with pathology (2). The TSC bioscale provides insight into diseases that disrupt sodium ion homeostasis (e.g., failure of metabolic energy production in stroke (1)) or cell packing (e.g., cell death in tumors responding to radiation treatment (2–4)). Although the potential clinical importance of 23Na imaging (5) and a method for quantification of MR signals into molar concentrations (6) have been known for more than two decades, quantitative sodium imaging with acquisition times suitable for humans only became feasible with the introduction of high and ultra-high field advanced MR scanner technology (7), and ultra-short echo-time (UTE) pulse sequences (8–10).
Accurate and precise measurement of the sodium bioscale at a resolution matched to the biological questions and tissue dimensions of human brain is necessary to address issues about regional brain health. Quantitative sodium MR imaging using flexible twisted projection imaging (flexTPI) on a clinical 3 Tesla (T) MR scanner has been described and demonstrated as having acceptable precision and accuracy in human brain (9). This approach calls for a series of 23Na, or 23Na and proton, acquisitions to compute the B0 and B1 corrected TSC bioscale of the human brain using matched acquisitions performed on a calibration phantom. The calibration phantom is designed to mimic the radiofrequency (RF) coil loading and relaxation characteristics of the human brain while providing compartments of known sodium concentration that can be used to calibrate the arbitrary signal intensity of the MR image into a molar concentration scale. This same quantification approach has also been applied to quantitative sodium and 17-oxygen MR imaging at 9.4 T to compute the cerebral metabolic rate of oxygen consumption (CMRO2) bioscale (11).
The MR signal of the quadrupolar sodium nucleus has short, bi-exponential transverse relaxation characteristics in human brain tissue (12). An UTE imaging sequence with a short RF pulse and readout duration is required to minimize signal loss during data collection. The most practical and widely used 23Na acquisition schemes sample k-space using 3-D trajectories that evolve on the surface of nested cones from the center of k-space (8–10). While such sequences are well suited to sodium imaging, the effects of transverse relaxation on the resolution, signal-to-noise ratio (SNR), and accuracy of the final sodium bioscale must be considered within the constraints of acceptable total acquisition times for clinical imaging. In this report, 10 minutes will be considered the upper limit tolerated by cooperative patients in terms of head motion.
The signal loss due to T2* decay during data acquisition has two effects. First, it constrains the resolution that can be achieved within a fixed total acquisition time. Acquisition parameters that optimize the resolution of 23Na can be selected, but the impact on the SNR must also be considered to ensure the final images can be reliably quantified. Second, signal loss during data sampling determines the bias of quantitative sodium MR imaging based on the T2* difference between the sample being measured and the calibration phantom providing the external quantification standard. This report analyzes the impact of T2* decay on flexTPI (9) for quantitative 23Na MR imaging to find the acquisition parameters that maximize the resolution of the final TSC bioscale without compromising the SNR required for accurate quantification within a fixed total acquisition time. The analysis is presented in the context of quantitative 23Na imaging, but could be applied for other short T2 nuclei (e.g, 17O) as well.
Materials and Methods
Rapid decay of the MR signal during sampling (readout) in an imaging experiment leads to a loss of image resolution, an effect that is commonly referred to as T2-blurring (13,14). In conventional proton imaging, the readout duration (TADC) is typically much shorter than the transverse relaxation time constant, resulting in a negligible loss of spatial resolution. For short-T2 species such as sodium, however, the readout duration is often comparable to or longer than the relaxation time constant and the effect of T2* decay on image resolution is pronounced. Specialized acquisition schemes have been proposed for imaging short-T2 proton signals, where readout times of 0.81•T2 and 0.69•T2 were suggested for 2-D and 3-D projection imaging, respectively (14). In addition to rapid relaxation of the signal, sodium MR imaging has the added difficulties of a low concentration that creates an SNR challenge and a low gyromagnetic ratio that limits the rate at which k-space can be traversed during spatial encoding. These factors must be considered when optimizing any 23Na imaging protocol.
Intuitively, it follows that the shortest readout duration results in the least T2-blurring. Among all UTE sequences, 3-D projection imaging (PI) would be optimal to maximize resolution with the shortest readout duration. Unfortunately, 3-D PI requires the largest number of projections to critically sample k-space, resulting in an impractically long acquisition time for quantitative 23Na MR imaging of human subjects.
Flexible TPI samples k-space with 3-D projections that twist on a set of nested cones that lie within a sphere of radius KMAX (see Figure 1) rather than sampling a rectangular cuboid as is done for 3-D Cartesian imaging. Sampling a sphere instead of the circumscribed cube effectively limits the full-width at half-max (FWHM) resolution of the final reconstruction to approximately 1.59 times the nominal voxel dimension (14). This follows from the fact that the 3-D continuous Fourier transform of a unit diameter sphere, sometimes referred to as the tinc function (15), has a FWHM of approximately 1.59 Hz. From the time-frequency duality and scaling properties of the Fourier Transform, it follows that the 3-D Inverse Fourier Transform of a sphere of radius KMAX will be a tinc function with a FWHM of 1.59 (2· KMAX)=1.59·Δxnominal, where Δxnominal is the nominal voxel size. The T2* decay during data collection will further decrease the resolution of the reconstructed image. For comparison, the FWHM of the 3-D sinc function that corresponds to sampling a 3-D unit cube of k-space is approximately 1.21·Δxnominal.
Figure 1.
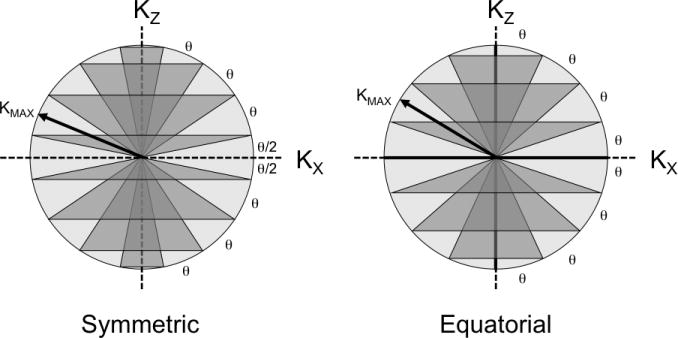
Two schemes (Symmetric, Equatorial) for separating the k-space sphere into nested cones are possible for flexTPI. The nested cones can be symmetrically placed about the KX-KY plane (left, symmetric layout) such that there are no cones of radius KMAX (“equator” cone in KX-KY plane) or zero (“polar” cones lying along z-axis). Alternatively, the cones can be designed with equatorial and polar cones (right, equatorial layout). The two designs impose slightly different slew rate constraints. KMAX, the number of cones, and total number of projections depend on the acquisition FOV and matrix size.
In flexTPI, the total number of cones (NC), total number of projections (NP), and maximum k-space radius (KMAX) are selected to critically sample k-space to achieve a desired nominal resolution (Δxnominal) over a specified field of view (FOV), resulting in an effective 3-D matrix size of NM = FOV/Δxnominal. Each slew-rate limited flexTPI trajectory begins as a radial projection that continues until the k-space radius equals a specified radial fraction (FR) of KMAX (9). Trajectories then change from radial to twisting, thereby reducing the total acquisition time as fewer trajectories are needed to sample each cone (8). The readout duration of each flexTPI projection is the same and is determined by the maximum gradient amplitude (GMAX), the maximum gradient slew rate (SMAX), FR, KMAX, FOV, and Δxnominal (or, equivalently, NM). Optimization of flexTPI for quantitative 23Na imaging for the best resolution in a fixed total acquisition time is now considered.
True Resolution and SNR of flexTPI Acquisition and Reconstruction
Since flexTPI uses slew-rate-limited twisting trajectories rather than radial projections, the signal intensity from a point source as a function of k-space radius is not the simple exponential of the ideal (non slew-rate limited) 3-D PI (see Figure 2). As the analytical expression for the point-spread function (PSF) of a flexTPI acquisition for a specified T2* decay profile is not easily derived, a numerical calculation has been used.
Figure 2.
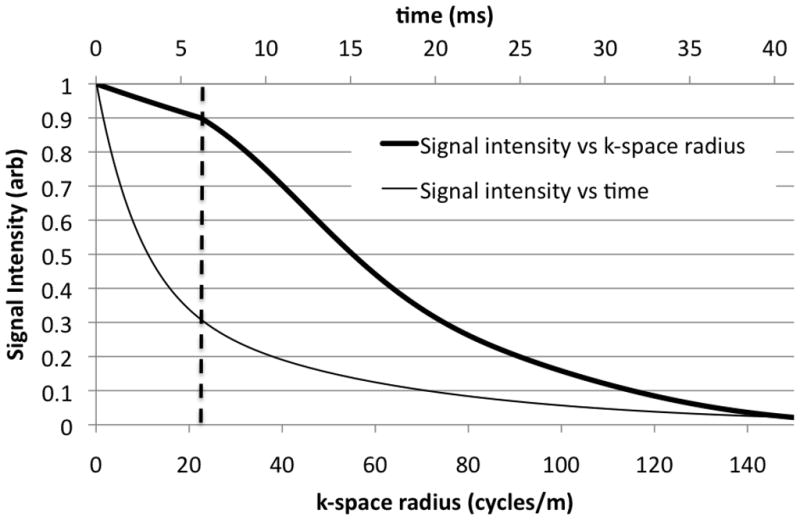
Simulated signal intensity from a unit amplitude point source with a bi-exponential decay (60% T2=2.5 ms, 40% T2=14 ms) for a flexTPI acquisition (GMAX=5 mT/m, SMAX=200 mT/m/ms, FR=0.15, FOV=20 cm, NM=60). The thick line is the signal intensity as a function of k-space radius, which has a non-exponential form (relative to k-space radius). The thin line is the signal intensity as a function of time with the conventional exponential form and corresponds to the signal for a comparable radial acquisition. The vertical dashed line indicates the point at which flexTPI trajectories transition from radial to twisting.
The overall PSF, due to acquisition, T2* decay, and image reconstruction of flexTPI for the acquisition parameters GMAX, SMAX, KMAX, FR, NM, and FOV, was computed by simulating the MR signal from a point-source with a defined T2* relaxation. The signal from a point-source located at isocenter and with a multi-exponential T2* decay is
| [1] |
where is the number of T2* relaxation rates and T2*[n] and F[n] are the relaxation rate and contribution fraction of nth time-constant, respectively. C is a proportionality constant that depends on several factors including the receiver sensitivity, flip angle, and the static magnetic field. The data were reconstructed using a standard gridding-based approach (16) with a Kaiser-Bessel gridding kernel using the known k-space trajectories and sampling density (9) to give the discretely sampled PSF, from which the FWHM was numerically computed and defined as the true resolution (Δxtrue) achieved by the acquisition parameters. This approach to determining the PSF is conceptually similar to “gridding ones” (10), except that it incorporates the T2* decay characteristics to allow the impact of the readout trajectory on resolution (through T2-blurring) to be evaluated.
The SNR of a flexTPI acquisition was evaluated by comparing the simulated signal from a homogenous cuboid to the result of a simulated noise-only acquisition. The signal from a homogenous cuboid located at isocenter with widths of wx, wy, and wz in the x-, y-, and z-dimensions, respectively, is given by:
| [2] |
Here sinc(x)= sin(πx)πx, and kx(t), ky(t), kz(t) are the k-space positions at time t. The reconstructed image from a simulated cuboid was used to define the signal intensity in a homogenous region (SIh) as the mean signal intensity over the center 50% of the cuboid in each dimension (i.e., ). Using the central region avoided any effects due to the limited resolution that prohibited a sharp transition between the object and the background. For the same acquisition parameters used to compute SIh, k-space data consisting of unit variance complex white Gaussian noise was reconstructed and the variance of the resulting image-domain standard deviation (σn) was computed. The theoretical SNR of a homogenous region was then calculated as:
| [3] |
Computing the noise standard deviation explicitly incorporated any influence of the flexTPI acquisition and image reconstruction on the noise level. Although the SNR from a single point-source (SNRp) has previously been used to optimize acquisition of short-T2 species (14,17), SNRh is adopted here as it is a more applicable measure for homogenous regions (e.g., white matter of the brain).
Resolution optimized flexTPI acquisition parameters
A naïve resolution optimization of flexTPI for 23Na imaging results in the trivial, but impractical, result that calls for FR =1.0 (i.e. flexTPI reduces to 3-D PI) with GMAX, SMAX, KMAX, NC, and NP as large as possible. While such an acquisition would indeed have the highest resolution, the total acquisition time would be unrealistically long for human applications. A more practical result is obtained by maximizing the resolution of flexTPI subject to constraints on the total imaging time (TTOTAL), GMAX, and SMAX, the latter two of which are dictated by the scanner hardware performance and the former by the cooperation of the subject. Experience has shown that a total acquisition time longer than 8–10 minutes accumulates artifacts due to head motion for most subjects, although longer acquisitions are possible with motivated subjects.
Quantitative sodium imaging requires a repetition time (TR) of at least 150–175 ms to achieve the full T1 recovery necessary for straightforward signal quantification to compute the TSC bioscale. Thus, the maximum number of flexTPI projections that can be used for a single TTOTAL -length acquisition is:
| [4] |
For a fixed FOV, both NM and FR influence the number of projections in a flexTPI acquisition. These two factors must be adjusted simultaneously to maintain the total number of projections. As the NM is increased (smaller Δxnominal), more trajectories are required to critically sample k-space. Likewise, when FR is increased, each trajectory samples a smaller volume of k-space (since there is less twist), also resulting in a larger number of necessary trajectories. This means that for any (TTOTAL,TR) pair, there is a collection of (FR, NM) pairs that result in the same number of projections. Figure 3 shows example combinations of (FR, NM) pairs that satisfy different TTOTAL constraints for TR =160 ms.
Figure 3.
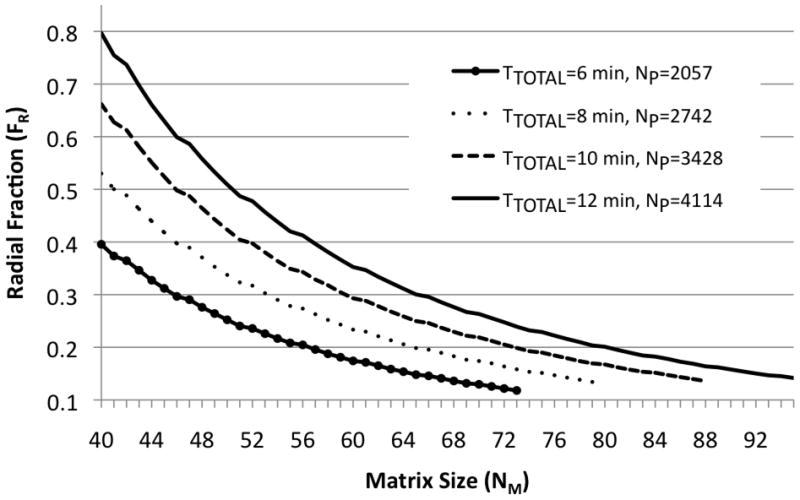
Pairs of (FR, NM) satisfying four values of TTOTAL constraint (6, 8, 10, 12 minutes) for a TR=160 ms and symmetric k-space cones. For any specified total acquisition time, there is a collection of (FR, NM) pairs that must be evaluated for resolution performance.
Figure 3 implies that for any NP, there are a number of acquisition parameters combinations that must be evaluated to determine which set results in the best final resolution. Even with GMAX and SMAX fixed, each combination of (FR, NM) has a different readout duration that results in a different amount of T2-blurring. As NM is increased, FR must correspondingly decrease in order to keep NP constant. This results in an increased TADC and, therefore, increased T2-blurring. However, at the same time that the nominal voxel size is decreased, so the overall impact of the resolution loss due to the tinc function is decreased. These two competing factors contribute to the final true resolution of the reconstructed image.
SMAX will typically be dictated by the system hardware while a range of GMAX values will be possible. This raises the question of what maximum gradient amplitude should be used to optimize the resolution of the flexTPI acquisition. The naïve response is to select that largest possible GMAX so as to minimize TADC and the amount of T2-blurring. However, since flexTPI uses slew-rate limited trajectories (9), use of the maximum gradient amplitude is not necessary. The maximum gradient amplitude that can be achieved during the twist is given by:
| [5] |
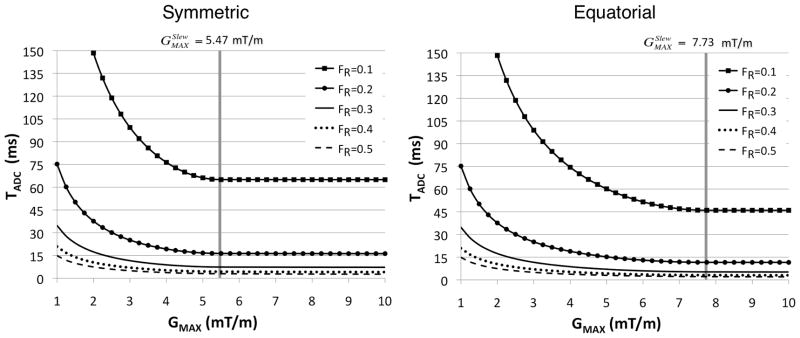
where θ is the angular spacing between cones (see Figure 1). The symmetric and equatorial nesting of k-space cones have different cone configurations and, therefore, produce slightly different slew rate constraints. As shown in Figure 4, choosing will result in a nearly minimal readout duration while using a modest gradient amplitude. When , the duration of the twisted portion of the flexTPI trajectories is minimized. Use of a larger maximum gradient amplitude has minimal impact on the overall readout time since only the radial part of the trajectories, constituting a small fraction of the total readout for FR < 0.5, can be shortened. For any modern human MR scanner, is well below the maximum gradient amplitude of the gradient system. This means that the gradient system is conservatively operated during flexTPI acquisitions, which is a potentially valuable property for extending the lifetime of the gradient system at ultra-high field.
Figure 4.
Readout duration for various values of FR for symmetric and equatorial cone nesting for flexTPI (FOV= 22 cm, NM=44, SMAX=150 mT/m/ms. In both cases, (gray vertical line) achieves nearly the shortest TADC among all gradient amplitudes. The difference in minimum TADC that can be achieved for the two cone-nesting schemes shown in Figure 1 diminishes as FR increases.
The true resolution of a 23Na image acquired with flexTPI for a FOV of 22 cm was evaluated for the TTOTAL constraints of 4 min and 10 min. The 10 min acquisition time was selected as the maximum time that can be routinely completed without excessive artifacts due to head motion. The 4 min acquisition was selected based on the original flexTPI description (9), which used parameters that resulted in a total acquisition time of approximately 8 minutes by using a 4-minute acquisition and two averages. For each TTOTAL, the true resolutions in brain parenchyma and in CSF were evaluated separately by numerically finding the FWHM of the PSF computed using the appropriate T2 relaxation values of each tissue. Brain parenchyma was modeled as having a bi-exponential relaxation of T2,short = 2.5 ms (60%) and T2,long =14 ms (40%) and cerebrospinal fluid (CSF) was modeled as having a mono-exponential relaxation of 55 ms. These relaxation rates were selected based on the multiple reports of T2,short =1–3 ms, T2,long =12–25 ms, and the T2 of CSF= 45–60 ms (2, 18–23). All (FR, NM) pairs that satisfied each TTOTAL constraint were evaluated for SMAX= 90 mT/m/ms and SMAX=150 mT/m/ms with for both the equatorial and symmetric cone nesting patterns shown in Figure 1. For each (FR, NM), the homogeneous signal intensity was found by simulating a unit amplitude 10 × 10 × 10 cm3 cube using Equation [2]. The SNR values of CSF and brain parenchyma were then computed using Equation [3] and normalized by the SNR of the TTOTAL= 4 min, SMAX = 90 mT/m/ms, and NM= 44 acquisition for straightforward comparison. The time of the first sample point in all simulations was 0.3 ms relative to the middle of the RF pulse. This time can be achieved for human imaging at both 9.4 T and 3 T (9,24,25).
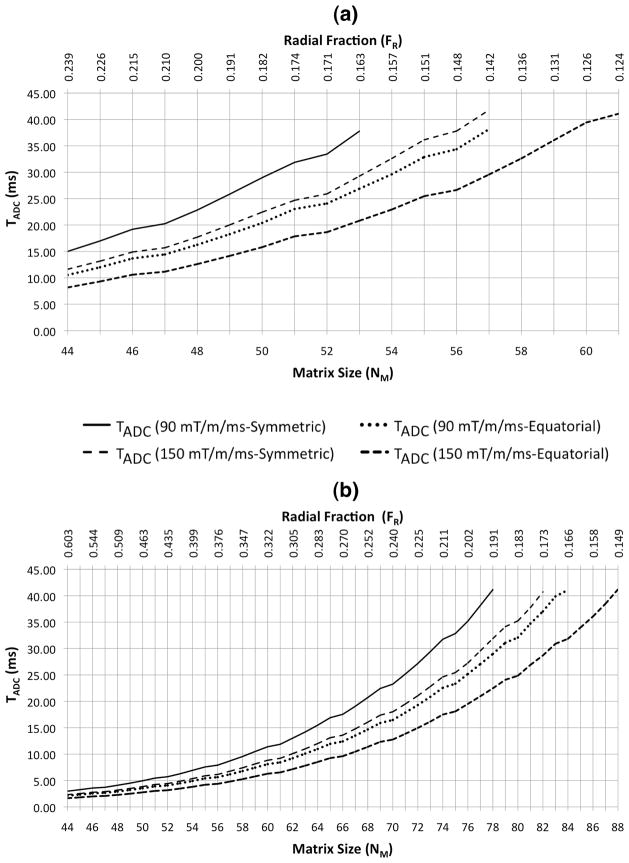
As shown in Figure 5, since flexTPI uses slew-rate limited trajectories, different maximum slew rate constraints and cone nesting schemes result in different readout durations even for the same (FR, NM) pair. TADC was given an upper bound of 42 ms for all simulations, which is the time at which 5% of the transverse signal from the T2,long component of brain parenchyma remains. NM was given a lower bound of 44, which corresponds to a nominal isotropic resolution of 5 mm for the 22 cm FOV.
Figure 5.
Required readout time, TADC (ms), as a function of matrix size and radial fraction constrained to total acquisition times of TTOTAL = 4 (a) and 10 (b) minutes, respectively, for and both the symmetric and equatorial patterns of k-space trajectories at two different slew rates (90 mT/m/ms, 150 mT/m/ms).
The impact of choosing was evaluated by computing the true FWHM resolution of brain parenchyma and CSF for symmetric cone nesting with FOV=22 cm and TR=160 ms. Acquisitions were simulated for and GMAX= 20 mT/m with (FR, NM)=(1.0, 44), (1.0, 63), and (1.0, 82), all of which require TTOTAL>10 min, to determine whether choosing placed a limitation on the achievable resolution. Changing from to GMAX= 20 mT/m for FR=1.0 results in the most significant change in TADC as there is no twisted component to the flexTPI trajectories.
PSF analysis of quantification accuracy
The impact of T2* decay on quantification accuracy was evaluated by examining the theoretical signal intensity in a homogenous region that would arise from a brain under study and from a quantification phantom with known T2 characteristics. In the absence of noise, the signal intensity from the homogenous compartment of known sodium concentration ([Na]true) is simply
| [6] |
To quantify a signal of unknown concentration measured from a brain under study, a linear calibration function is computed from the signal intensity and known concentrations of the calibration phantom compartments (9). In the absence of noise, this calibration function (fQ) is simply the inverse of the homogenous signal intensity of the calibration phantom. The quantified 23Na concentration corresponding to the signal intensity measured in the brain then becomes
| [7] |
where and are the homogenous signal intensity of the brain and phantom, respectively. [Na]brain is the true sodium concentration in the brain and SI[Na]brain is the signal intensity measured in the brain for that sodium concentration.
From Equation [7], it can be seen that the quantified sodium concentration in a homogenous region is a scaled version of the true concentration. The term is termed the quantification bias and depends on the T2* difference between the sample and the calibration phantom. Even in the absence of noise, fQ (SI[Na]brain)≠ [Na]brain unless the T2* characteristics of the calibration phantom and the brain under study are identical.
The impact of T2*-decay on the quantification accuracy was evaluated by examining the quantification bias as a function of readout duration and T2* mismatch between brain parenchyma and CSF and the calibration phantom (9). The homogenous signal intensity for the calibration phantom with a mono-exponential T2* decay of 12 ms (T2* experimentally measured in the calibration phantom) was computed for each parameter set satisfying the TTOTAL constraints of 4 min and 10 min used for the already described PSF and SNR simulation. A 10 × 10 × 10 cm3 cube was used to compute the homogenous signal intensities and for Equation [7].
Human Experiments
Sodium MR imaging was performed on healthy normal volunteers at 9.4 T and 3.0 T to demonstrate the impact of acquisition parameters on the true resolution. Human imaging was performed under IRB approved protocols requiring informed consent.
Ultra-high field quantitative sodium MR imaging was performed using a custom-built state-of-the-art 9.4 T MR scanner optimized for human brain imaging (7) and a custom-built quadrature birdcage RF coil tuned to 105.92 MHz. Since this scanner operates above the static magnetic field guideline for insignificant risk set by the United States Food and Drug Administration, the data were collected under an investigational device exemption (IDE). Previous safety evaluations of this MR scanner have revealed no irreversible adverse impact on human health (24,25). Imaging was performed for selected resolutions using the acquisition parameter sets A and B shown in Table 1. For each acquisition parameter set, complementary sodium acquisitions were made for B0 and B1 mapping as required for accurate and precise TSC measurement (9). Linear and B0 eddy currents were corrected using previously measured system constants (26).
Table 1.
Acquisition parameters for selected resolutions of human quantitative 23Na imaging with flexTPI at 9.4 T and 3.0 T.
| B0 (T) | TTOTAL (min) | Matrix | FR | TADC (ms) | Nominal Resolution (mm) | True Resolution1 CSF (mm) | True Resolution1 Brain Parenchyma (mm) | |
|---|---|---|---|---|---|---|---|---|
| A | 9.4 | 10 | 44 | 0.603 | 2.3 | 5.00 | 7.66 | 7.88 |
| B | 9.4 | 10 | 76 | 0.203 | 27.3 | 2.89 | 4.67 | 5.66 |
| C | 3 | 4 | 44 | 0.239 | 10.5 | 5.00 | 7.74 | 8.65 |
| D | 3 | 4 | 56 | 0.148 | 34.4 | 3.93 | 6.32 | 8.00 |
FWHM of the point spread function
All acquisitions used and symmetric k-space cone nesting. Acquisitions A and B were performed at 9.4T and used symmetric k-space cone nesting. Acquisitions C and D were performed at 3.0T and used equatorial k-space cone nesting and two averages (8 minutes to complete both averages).
High-field quantitative sodium imaging was performed using a clinical 3T whole-body scanner (HDx Signa, GE Healthcare, Waukesha, WI) and custom-built birdcage proton and sodium RF coils tuned to 127.8 MHz and 33.8 MHz, respectively. Sodium imaging was performed for selected resolutions using the acquisition parameter sets C and D in Table 1. For efficiency, B0 mapping was performed at the proton frequency as described by Lu, et al (9) while B1 mapping was completed using the sodium signal.
The 9.4T and 3.0T data were processed as described in (9) to compute B0 and B1 corrected TSC maps. All acquisitions were reconstructed and processed at their nominal voxel sizes. Acquisitions A and C were also reconstructed and processed with voxel sizes matched to acquisitions B and D, respectively. The TSC of white matter and CSF were measured for each acquisition reconstructed at its nominal resolution. White matter voxels were selected from the left and right hemispheres, above the ventricles and away from sulci to avoid bias due to partial volume contributions from CSF and tissue. Similarly, CSF voxels were chosen from within the ventricles but away from all edges. Since flexTPI is a true 3D acquisition the proximity of sulci and ventricle edges were considered in all three planes.
Results
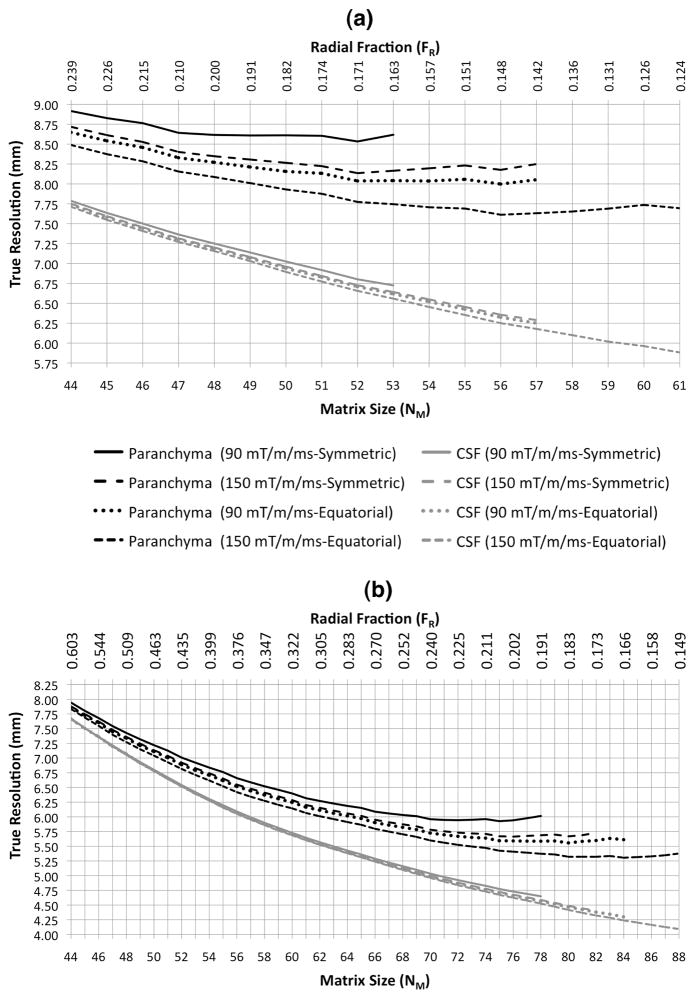
The true FWHM resolutions achieved for flexTPI with TTOTAL = 4 and 10 min, respectively, are shown in Figure 6. Regardless of total acquisition time and acquisition parameters, the true resolution measured from the FWHM of the PSF is significantly lower than the nominal resolution. The true resolution achieved in brain parenchyma and CSF varies as TTOTAL and (NM, FR) are changed. SMAX and the cone-nesting scheme also impact the achievable resolution, although the dependence on these factors is most pronounced for TTOTAL= 4min. Contrary to the conventional view of T2-blurring, the true resolution of flexTPI generally improves as the readout duration is increased up to approximately 30–35 ms, provided that TTOTAL is held constant. The exact acquisition parameters that maximize the resolution achieved for brain parenchyma depend on TTOTAL, SMAX, and the cone nesting scheme, but in each case there was an (NM,FR) pair that produced the optimal resolution in brain parenchyma.
Figure 6.
True resolution (measured as FWHM of simulated PSF) as a function of matrix size as achieved in either brain parenchyma or CSF for a flexTPI acquisition constrained to TTOTAL = 4 (a) and 10 (b) minutes, respectively, for and both the symmetric and equatorial patterns of k-space trajectories at two different slew rates (90 mT/m/ms, 150 mT/m/ms).
Table 2 shows the FWHM resolutions for flexTPI with and GMAX = 20 mT/m for FR=1.0 (3-D PI). Increasing GMAX from to 20 mT/m significantly reduced the readout duration but only slightly improved the resolution in CSF and brain parenchyma.
Table 2.
Parameters for simulation comparing resolution achieved for to GMAX = 20 mT/m.
| GMAX = 20 mT/m | ||||||||
|---|---|---|---|---|---|---|---|---|
| (FR, NM) | TTOTAL (min) | TADC (ms) | True Resolution1 CSF (mm) | True Resolution1 Brain Parenchyma (mm) | TADC (ms) | True Resolution1 CSF (mm) | True Resolution1 Brain Parenchyma (mm) | |
| (1.0, 44) | 16.5 | 1.66 | 7.59 | 7.73 | 0.53 | 7.58 | 7.62 | |
| (1.0, 63) | 33.7 | 2.36 | 5.38 | 5.51 | 0.73 | 5.37 | 5.41 | |
| (1.0, 82) | 57.0 | 3.06 | 4.15 | 4.28 | 0.92 | 4.14 | 4.18 | |
FWHM of the point spread function
All three simulated acquisitions used symmetric cone nesting. These data suggest that the tinc function does not strictly limit resolution. For example, the true parenchymal resolution for (FR,NM)=(1.0, 44) is better than the 7.95 mm = 1.59 · 5 mm from the tinc function without any T2-blurring. This is simply due the very short readout, leading to very little T2-blurring, and the gridding reconstruction that results in gridded data that extends slightly beyond KMAX.
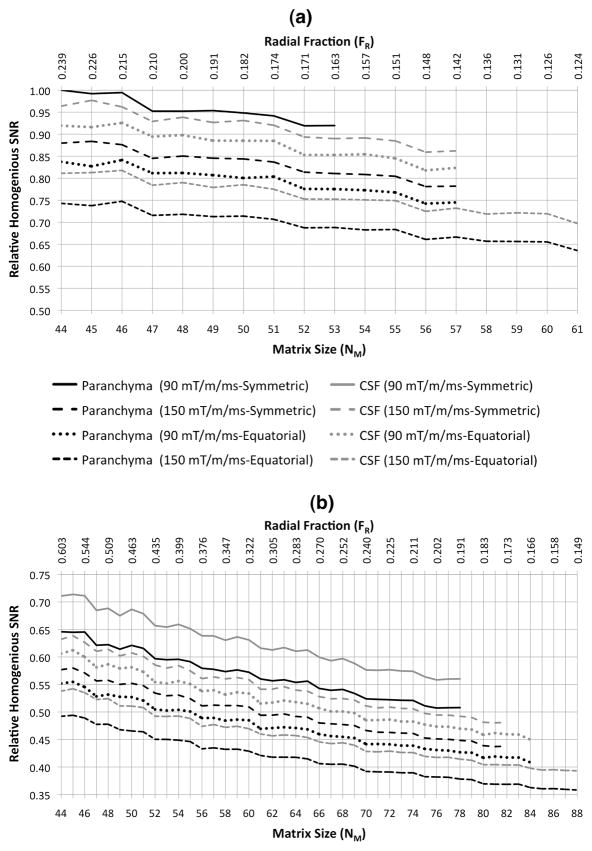
Figure 7 shows the relative SNRs achieved for flexTPI optimized for resolution with TTOTAL = 4 and 10 min, respectively. The best SNR was achieved by the shortest total acquisition time.
Figure 7.
Relative homogenous SNR as a function of matrix size for flexTPI acquisition with TTOTAL = 4 (a) and 10 (b) minutes, respectively. SNR values are relative to the homogenous SNR of tissue for TTOTAL=4 min, NM=44 and FR=0.603. Results for and both the symmetric and equatorial patterns of k-space trajectories at two different slew rates (90 mT/m/ms, 150 mT/m/ms) are shown.
The quantification bias for brain parenchyma and CSF did not vary substantially as a function of acquisition parameters. TSC of brain parenchyma was underreported by approximately 6.7 +/− 0.2 % across all acquisition parameters while CSF was overreported by 2.5 +/− 0.2 %.
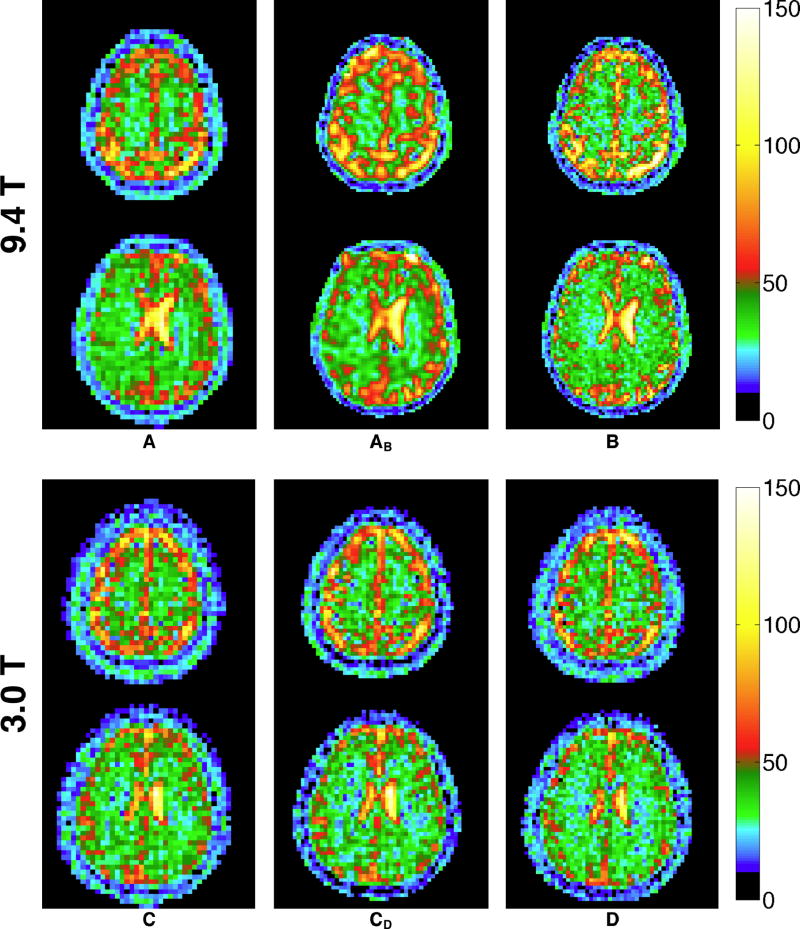
Figure 8 shows representative slices from the TSC bioscales from 9.4 T and 3.0 T acquired with the acquisition parameters in Table 1. In both cases, the short-readout acquisitions (Table 1, A and C) are included twice, first at the nominal acquisition resolution and again with voxels matching the nominal resolution of the resolution optimized acquisition parameters (Table 1, B and D). The resolution difference between the nominal resolution and optimized resolution acquisitions at 9.4T is very significant and easily appreciated visually. The longer readout duration results in significantly improved resolution in brain parenchyma (theoretically 5.66 mm vs 7.88 mm) while maintaining a total acquisition time of 10 min. The difference for TSC data from 3 T is not as striking, which is not surprising given the modest theoretical improvement (8.65 mm to 8.00 mm). The measured TSC values for white matter were 31.4 ± 5.6 mM (A), 30.7 ± 6.2 mM (B), 31.1 ± 6.9 mM (C), and 30.1 ± 7.0 mM (D), respectively. These values are in good agreement with the theoretical TSC of ~33 mM (9), that is reduced to ~30.8 mM by the −6.7% quantification bias found by the simulation. The sodium concentrations in CSF were 127.7 ± 4.6 mM (A), 141.5 ± 6.0 mM (B), 134.9 ± 15.3 mM (C), and 135.5 ± 10.4 mM (D), respectively.
Figure 8.
Two representative slices from quantitative TSC maps in mM acquired at 9.4T (top) and 3T (bottom) on the same subject using the acquisition parameter sets shown in Tables 1 and 2, respectively. Acquisitions A (top, left column) and B (top, right column) were reconstructed at voxel sizes equal to their nominal resolutions of 5 mm and 2.89 mm, respectively. Column AB (top, center column) is the result of reconstructing acquisition A at the same voxel size as acquisition B. Both A and B have identical acquisition times of 10 minutes. Acquisition B has significantly improved resolution despite the longer readout duration (27.3 ms vs 2.3 ms). This matches the true resolution expected in CSF and brain parenchyma (see Table 1) determined from the PSF simulation. Acquisitions C (bottom, left column) and D (bottom, right column) were reconstructed at voxel sizes equal to their nominal resolutions of 5 mm and 3.92 mm, respectively. Column CD (bottom, center column) is the result of reconstructing acquisition C at the same voxel size as acquisition D. Both C and D have identical acquisition times of 8 minutes (two averages of a 4-minute acquisition. Acquisition C theoretically has slightly improved resolution in brain parenchyma (8.00 mm vs 8.65 mm), although the difference is difficult to appreciate visually.
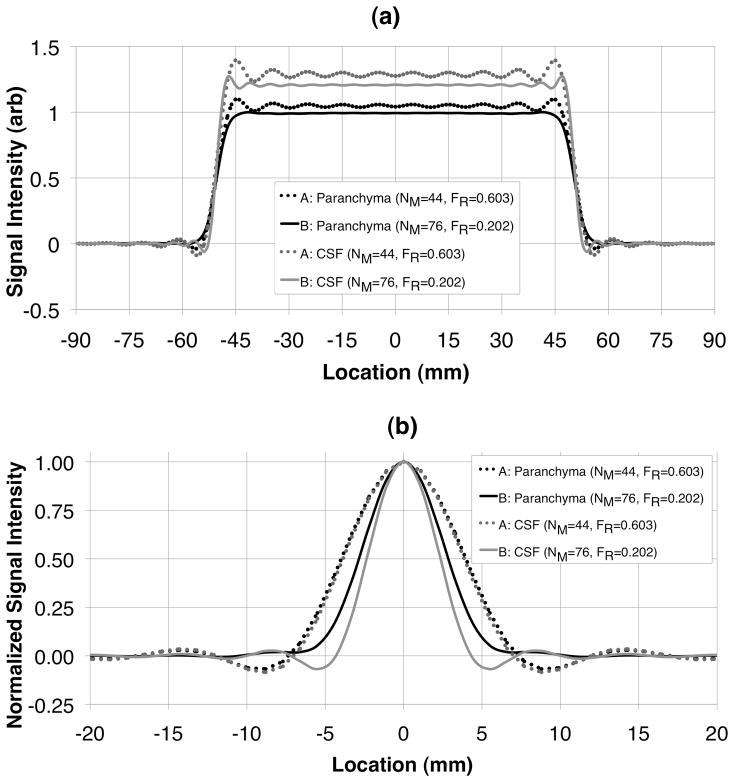
Figure 9 shows the PSF and object cross-sections simulated for acquisition parameter sets A and B for parenchyma and CSF, respectively.
Figure 9.
Cross-sections of simulated 10 cm cube object (a) and point-spread functions normalized to unit amplitude (b) for brain parenchyma and CSF for acquisition parameter sets A and B shown in Table 1. The long readout of acquisition B results in a better FWHM resolution and significantly reduced Gibbs ringing more than the short readout of acquisition A.
Discussion and Conclusion
The resolution and SNR of quantitative flexTPI for clinical 23Na imaging depends on both acquisition parameters and the T2* relaxation characteristics of the sample. It is not surprising that the best resolution can be achieved with the longest total acquisition time. However, for a fixed total acquisition time, the resolution can vary more than 30% in brain parenchyma and up to 40% in CSF by simply changing the acquisition parameters. In contrast to previously reported optimizations for short-T2 species, the optimal true resolution for a fixed total acquisition time is not achieved with the shortest readout duration as has been shown with both simulation and human brain imaging. This non-intuitive result is due to the competing effects of the FWHM of the tinc function and T2-blurring that combine to produce the overall spatial resolution of the final image. The impact of these two factors can be balanced for a flexTPI acquisition by simultaneously changing the effective matrix size and radial fraction so that the readout trajectory is modified but the total acquisition time remains fixed. Although the changes to (NM,FR) are done without modifying GMAX or SMAX, the readout duration changes significantly based on the amount of twist and maximum k-space radius required.
The necessary SNR of a TSC bioscale derived from quantitative sodium imaging depends on how the bioscale will be analyzed. Examining the TSC of individual voxels generally requires a higher SNR than interrogating a region of interest. For example, an SNR of 20:1 means that there is a ~0.68 probability (P) of a measured TSC value (TSCM) in a single voxel falling within ±5% of the true value. For ±10%, the probability is ~0.95. That is, if the true TSC is 30 mM, P(28.5 mM < TSCM < 31.5 mM) = ~0.68 and P(27 mM < TSCM < 33 mM) = ~0.95. If the SNR were 10:1, these drop to P(28.5 mM < TSCM < 31.5 mM) = ~0.38 and P(27 mM < TSCM < 33 mM) = ~0.68. These values follow directly from the Gaussian approximation to noise in an MR image, which is valid once SNR > ~3:1 (27).
When flexTPI is optimized for resolution, the SNR in a homogenous region is approximately linearly proportional to the matrix size. Even though the nominal voxel volume is proportional to 1/NM3, the homogenous SNR does not fall that rapidly due to the fact that the noise is proportional to (TADC×NP)(−1/2)and TADC is approximately a fifth-order function of NM (see Figure 5 and (8)). Thus, the homogenous SNR for a fixed TTOTAL becomes approximately proportional to 1/NM-1/2 as seen in Figure 7. Because of this, performing a TTOTAL=10min resolution optimized acquisition at high field (e.g, 3 T) will result in a substantial decrease in SNR (approximately 60%—70% lower) compared to a TTOTAL= 4min acquisition with 2 averages. Even with optimized hardware, the resultant SNR from a 10-min resolution optimized acquisition at 3 T is insufficient for quantification. To achieve a true resolution of less than 6 mm isotropic within a reasonable total acquisition time and with an SNR sufficient for robust quantification, imaging should be performed at ultra-high field. Based on the results presented in Figure 7, achieving sub-6 mm resolution at 3.0 T with an SNR equivalent to that of Acquisition C from Table 1 (see Figure 8) would require at least 4 averages, resulting in an unrealistically long total acquisition time of 40 minutes. The 9.4 T scanner used in this report represents current state-of-the-art in ultra-high field scanner technology and, therefore, provides the best means of achieving the highest true resolution for 23Na data while maintaining an SNR suitable for robust quantification. Further improvements may be possible from parallel imaging (28) or phased-array (29) configurations not described in this report. For example, the improved SNR from a phased-array receiver may remedy the SNR issue at 3.0 Tesla, provided that the result remains quantitative. At any field strength, a higher resolution could be achieved by increasing the total acquisition time to allow more projections to be collected. However, acquisitions significantly longer than 10 minutes are likely to be tolerated by only the most cooperative and motivated subjects.
When optimizing flexTPI for resolution, the maximum gradient amplitude needed for imaging is dictated by the slew rate capabilities of the scanner as described by Equation [5]. Use of a larger gradient amplitude will have only very minimal impact on the readout duration when FR < 0.5 but will result in longer gradient ramping times (since a higher GMAX must be reached) during the radial portion of the trajectories and higher peak current being used to drive the gradient system. These factors may cause heating or additional torque forces, potentially shortening the longevity of the gradient system without any improvement in sodium imaging quality. In addition, the increased acoustic noise and potential for peripheral nerve stimulation may reduce the comfort of the participant. Given the cost of MR gradients and the importance of a positive patient experience, flexTPI has a significant benefit of making only compassionate demand on the gradients without compromising image quality.
For large FR, choosing can significantly shorten the readout duration as the majority of the flexTPI trajectory is radial and not slew-rate limited. However, the actual resolution improvement from increasing from to GMAX= 20 mT/m was found to be very modest (~2% for brain parenchyma and < 0.25% improvement for CSF) for symmetric cone nesting with FR=1.0.
For moderate radial fractions (0.2< FR < 0.5), the choice between k-space nesting schemes is largely irrelevant as both can achieve approximately the same resolution, SNR, and quantification bias provided . Equatorial k-space nesting has a slight resolution benefit (e.g., parenchyma: ~ 5.30 mm vs 5.65 mm for TTOTAL=10min) while the symmetric configuration results in higher homogenous SNR (e.g., parenchyma: ~0.46 vs ~0.37 for TTOTAL =10min)
The CSF sodium concentrations measured experimentally (see Figure 8) were lower than the expected 144 mM. This was likely due to partial volume effects between CSF and tissue that dilute the measured TSC. Although voxels were selected from inside the ventricles, the wide PSF of tissue made it difficult to choose voxels that are pure CSF, especially at low resolution (e.g., acquisitions A, C, and D) where the ventricles are spanned by only a few voxels. At higher resolution (e.g., acquisition B), there are more voxels within the ventricles and the CSF measurement approached the expected value and the variance of CSF values accordingly dropped.
From the object and PSF cross-sections shown in Figure 9, an additional result of the optimization was observed. The k-space filtering that is common for proton MR imaging is largely unnecessary when imaging short T2 species, such as 23Na, with a resolution optimized acquisition. The rapid signal decay effectively windows the data and removes Gibbs-type artifacts. When reconstructed without any k-space filter, the short readout duration (parameter set A, TADC= 2.3 ms) shows the characteristic Gibbs artifacts due to the significant side-lobes of the PSF. However, when acquisition parameters B (TADC= 27.3 ms) are used, which result in higher spatial resolution with the same total acquisition time, virtually all Gibbs effects are suppressed in brain parenchyma. Windowing k-space data is unnecessary and would only further reduce the true resolution of the data.
In conclusion, quantitative 23Na imaging with a flexTPI acquisition can be optimized for resolution within an acceptable clinical imaging time. Although T2*-decay during data acquisition does result in resolution loss due to T2-blurring, for a fixed total acquisition time, the optimal resolution is not achieved by the shortest readout duration.
Acknowledgments
The authors gratefully acknowledge financial support from the PHS RO1 CA CA1295531. This work was funded in part by the Chicago Biomedical Consortium with support from The Searle Funds at The Chicago Community Trust.
References
- 1.Thulborn KR, Gindin TS, Davis D, Erb P. Comprehensive MRI Protocol for Stroke Management: Tissue Sodium Concentration as a Measure of Tissue Viability in a Non-Human Primate Model and Clinical Studies. Radiology. 1999;139:26–34. doi: 10.1148/radiology.213.1.r99se15156. [DOI] [PubMed] [Google Scholar]
- 2.Lu A, Atkinson IC, Thulborn KR. Encyclopedia of Magnetic Resonance. Hoboken, NJ: John Wiley & Sons; 2010. Sodium magnetic resonance imaging and its bioscale of tissue sodium concentration. (in press) [Google Scholar]
- 3.Thulborn KR, Lu A, Atkinson IC, Damen F, Villano JL. Quantitative sodium MR imaging and sodium bioscales for the management of brain tumors. Neuroimag Clin N Am. 2009;19:615–624. doi: 10.1016/j.nic.2009.09.001. [DOI] [PMC free article] [PubMed] [Google Scholar]
- 4.Thulborn KR, Atkinson IC, Lu A. Metabolic Magnetic Resonance Imaging: A Case for Bioscales in Medicine. In: Faro Scott, Mohamed FB., editors. Functional Neuroradiology: Principles and Clinical Applications. Springer Science + Business Media, NY; NY: 2010. (in press) [Google Scholar]
- 5.Hilal SK, Maudsley AA, Ra JB, Simon HE, Roschmann P, Wittekoek S, Cho ZH, Mun SK. In vivo NMR imaging of sodium-23 in the human head. J Comput Assist Tomogr. 1985;9(1):1–7. doi: 10.1097/00004728-198501000-00001. [DOI] [PubMed] [Google Scholar]
- 6.Thulborn KR, Ackerman JJH. Absolute molar concentrations by NMR in inhomogeneous B1: A scheme for analysis of in vivo metabolites. J Magn Reson. 1983;55:357–71. [Google Scholar]
- 7.Thulborn KR. In: Ultra High Field Magnetic Resonance Imaging. Robitaille PM, Berliner L, editors. Springer; 2007. [Google Scholar]
- 8.Boada FE, Gillen JS, Shen GX, Chang SY, Thulborn KR. Fast three dimensional sodium imaging. Magnetic Resonance in Medicine. 1997;37:706–715. doi: 10.1002/mrm.1910370512. [DOI] [PubMed] [Google Scholar]
- 9.Lu A, Atkinson IC, Claiborne T, Damen F, Thulborn KR. Quantitative Sodium Imaging with a Flexible Twisted Projection Pulse Sequence. Magnetic Resonance in Medicine. 2010;63:1583–1593. doi: 10.1002/mrm.22381. [DOI] [PMC free article] [PubMed] [Google Scholar]
- 10.Gurney PT, Hargreaves BA, Nishimura DG. Design and analysis of a practical 3-D cones trajectory. Magnetic Resonance in Medicine. 2006;55:575–582. doi: 10.1002/mrm.20796. [DOI] [PubMed] [Google Scholar]
- 11.Atkinson IC, Thulborn KR. Feasibility of Mapping the Tissue Mass Corrected Bioscale of Cerebral Metabolic Rate of Oxygen Consumption Using 17-Oxygen and 23-Sodium MR Imaging in a Human Brain at 9.4 T. NeuroImage. 2010;51:723–733. doi: 10.1016/j.neuroimage.2010.02.056. [DOI] [PubMed] [Google Scholar]
- 12.Hubbard PS. Nonexponential nuclear magnetic relaxation by quadrupole interactions. J Chem Phys. 1970;53:985–987. [Google Scholar]
- 13.Bernstein MA, King KF, Zhou ZJ. Handbook of MRI Pulse Sequences. Elsevier Academic Press; 2004. [Google Scholar]
- 14.Rahmer J, Bornert P, Groen J, Bos C. Three-Dimensional Radial Ultrashort Echo-Time Imaging with T2 Adapted Sampling. Magnetic Resonance in Medicine. 2006;55:1075–1082. doi: 10.1002/mrm.20868. [DOI] [PubMed] [Google Scholar]
- 15.Blahut RE. Theory of Remote Image Formation. University Press; 2004. [Google Scholar]
- 16.Jackson JJ, Meyer CH, Nishimura DG, Macovski A. Selection of a convolution function for Fourier inversion using gridding. IEEE Transactions on Medical Imaging. 1991;10:473–478. doi: 10.1109/42.97598. [DOI] [PubMed] [Google Scholar]
- 17.Nagel AM, Laun FB, Weber M, Matthies C, Semmler W, Schad LR. Sodium MRI using a density-adapted 3D radial acquisition technique. 2009;62:1565–1573. doi: 10.1002/mrm.22157. [DOI] [PubMed] [Google Scholar]
- 18.Ouwerkerk R, Bleich KB, Gillen JS, Pomper MG, Bottomley PA. Tissue Sodium Concentration in Human Brain Tumors as Measured with 23Na MR Imaging Radiology. 2003;227:529–537. doi: 10.1148/radiol.2272020483. [DOI] [PubMed] [Google Scholar]
- 19.Rooney WD, Springer CS. A comprehensive approach to the analysis and interpretation of the resonances of spins 3/2 from living systems. NMR Biomed. 1991;4:209–226. doi: 10.1002/nbm.1940040502. [DOI] [PubMed] [Google Scholar]
- 20.Bartha R, Menon RS. Long Component Time Constant of 23Na T*2 Relaxation in Healthy Human Brain. Magnetic Resonance in Medicine. 2004;52:407–410. doi: 10.1002/mrm.20144. [DOI] [PubMed] [Google Scholar]
- 21.Winkler SS, Thomasson DM, Sherwood K, Perman WH. Regional T2 and sodium concentration estimates in the normal human brain by sodium-23 MR imaging at 1.5 T. J Comput Assist Tomogr. 1989;13:561–566. doi: 10.1097/00004728-198907000-00002. [DOI] [PubMed] [Google Scholar]
- 22.Perman WH, Turski PA, Houston LW, Glover GH, Hayes CE. Methodology of in vivo human sodium MR imaging at 1.5 T. Radiology. 1986;160:811–820. doi: 10.1148/radiology.160.3.3737922. [DOI] [PubMed] [Google Scholar]
- 23.Clayton RB, Lenkinski RE. MR Imaging of Sodium in the Human Brain with a Fast Three-Dimensional Gradient-Recalled-Echo Sequence at 4 T*1. Academic Radiology. 2003;10:358–365. doi: 10.1016/s1076-6332(03)80023-5. [DOI] [PubMed] [Google Scholar]
- 24.Atkinson IC, Renteria L, Burd H, Pliskin NH, Thulborn KR. Safety of human MRI at static fields above the FDA 8T guideline: sodium imaging at 9.4T does not affect vital signs or cognitive ability. Journal of Magnetic Resonance Imaging. 2007;26:1222–1227. doi: 10.1002/jmri.21150. [DOI] [PubMed] [Google Scholar]
- 25.Atkinson IC, Sonstegaard R, Pliskin NH, Thulborn KR. Vital Signs and Cognitive Function are Not Affected by 23-Sodium and 17-Oxygen MR Imaging of the Human Brain at 9.4 Tesla. Journal of Magnetic Resonance Imaging. 2010;32:82–87. doi: 10.1002/jmri.22221. [DOI] [PubMed] [Google Scholar]
- 26.Atkinson IC, Lu A, Thulborn KR. Characterization and correction of system delays and eddy currents for MR imaging with ultra-short echo-time and time varying gradients. Magnetic Resonance in Medicine. 2009;62:532–537. doi: 10.1002/mrm.22016. [DOI] [PubMed] [Google Scholar]
- 27.Gudbjartsson H, Patz S. The rician distiribution of noisy MRI data. Magnetic Resonance in Medicine. 1995;34:910–914. doi: 10.1002/mrm.1910340618. [DOI] [PMC free article] [PubMed] [Google Scholar]
- 28.Qian Y, Stenger AV, Boada FE. Parallel imaging with 3D TPI trajectory: SNR and acceleration benefits. Magnetic Resonance Imaging. 2009;27:565–669. doi: 10.1016/j.mri.2008.10.008. [DOI] [PubMed] [Google Scholar]
- 29.James JR, Lin C, Stark H, Dale BM, Bansal N. Optimization and characterization of sodium MRI using 8-channel 23Na and 2-channel 1H RX/TX coil. Proceedings of International Conference on Biomedical Imaging. 2009;23:138–141. [Google Scholar]


