

Abstract
Gene expression analysis is a valuable tool for determining the risk of disease recurrence and overall survival of an individual patient with breast cancer. The purpose of this study was to create and validate a robust prognostic algorithm and implement it within an online analysis environment. Genomic and clinical data from 477 clinically diverse patients with breast cancer were analyzed with Cox regression models to identify genes associated with outcome, independent of standard prognostic factors. Percentile-ranked expression data were used to train a “metagene” algorithm to stratify patients as having a high or low risk of recurrence. The classifier was applied to 1016 patients from five independent series. The 200-gene algorithm stratifies patients into risk groups with statistically and clinically significant differences in recurrence-free and overall survival. Multivariate analysis revealed the classifier to be the strongest predictor of outcome in each validation series. In untreated node-negative patients, 88% sensitivity and 44% specificity for 10-year recurrence-free survival was observed, with positive and negative predictive values of 32% and 92%, respectively. High-risk patients appear to significantly benefit from systemic adjuvant therapy. A 200-gene prognosis signature has been developed and validated using genomic and clinical data representing a range of breast cancer clinicopathological subtypes. It is a strong independent predictor of patient outcome and is available for research use.
Genomic profiling is increasingly being incorporated into the clinical management of patients with breast cancer, specifically the use of multigene algorithms to predict an individual patient's risk of disease recurrence, overall survival (OS), and potential benefit from adjuvant therapy.1 Since the advent of high-throughput genomics, multiple gene “signatures” associated with disease progression have been identified, several of which are sold as commercially available diagnostic tests [eg, MammaPrint (Agendia BV, Amsterdam, The Netherlands), OncoType DX (Genomic Health, Redwood City, CA), and MapQuant DX (Ipsogen, Marseille, France)].2–5 Although there is minimal overlap between the underlying gene sets used,6,7 the clinical significance of each is similar.8 For a patient predicted to be at low risk of recurrence, the risks and adverse effects of chemotherapy negate the small potential increase in recurrence-free survival (RFS) probability.8 Prospective clinical trials9 are under way to further test this hypothesis.
In addition to the clinical significance of the available assays, another similarity is their mode of delivery: a centralized sample processing and gene expression analysis laboratory. This format requires the shipping of tumor tissue and a wait of up to 2 weeks for the generation of a result. The hypothesis behind this study was that a prognostic breast cancer signature could be developed using publicly available data sets and ultimately made available to appropriately equipped and experienced diagnostic laboratories, via the Internet. Although this model would require the treating hospital to generate the gene expression profile, the potential cost and time savings would be substantial. In addition, this model would allow the clinician to remain in control of the biopsy material, all data generated, and the overall diagnostic process. A similar approach has been taken to develop a prognostic signature for patients with stage II or III colon cancer.10
A training series of genomic data from patients with breast cancer with diverse clinicopathological variables was compiled from public data repositories. This information was analyzed using a statistical approach designed to identify individual genes associated with recurrence, independent of other prognostic factors. A predictive algorithm was formed on the gene set identified by this strategy and then applied to multiple independent breast cancer series, representing a range of clinicopathological variables. The resulting algorithm outputs a robust easily interpretable prognostic index and risk group assignment. Prognostic indexes and risk group assignments for all patients were evaluated in the context of the available clinical and survival data to assess clinical utility. The algorithm is implemented in an online diagnostic environment (ChipDX), available for evaluation (http://www.ChipDX.com, last accessed March 3, 2011; free registration is required).
Materials and Methods
Patients and Clinical Data
Gene expression and clinical data from two previously described cohorts were compiled to form a gene-selection and algorithm training series of 477 patients [National Center for Biotechnology Information (NCBI) Gene Expression Omnibus (GEO) GSE492211 and GSE653212]. Of the patients, 164 (34%) did not receive adjuvant treatment of any kind, whereas 205 (43%) received endocrine therapy only. Local or distant recurrence was defined as the clinical end point. The institutional ethics board of each hospital approved the use of the tissue material, and written informed consent was obtained. Relevant molecular and clinical variables for the training series are shown in Table 1.
Table 1.
Details of the 477-Patient Training Series Used for Gene Selection and Algorithm Training
| Characteristic | No. of patients | % of Series |
|---|---|---|
| Tumor size (cm) | ||
| <2 | 182 | 38 |
| 2–5 | 232 | 49 |
| >5 | 9 | 2 |
| NA | 4 | 11 |
| Age (years) | ||
| <50 | 97 | 20 |
| ≥50 | 331 | 69 |
| NA | 49 | 10 |
| ER status | ||
| Positive | 358 | 75 |
| Negative | 119 | 25 |
| Nodal involvement | ||
| Positive | 128 | 27 |
| Negative | 349 | 73 |
| Tumor grade | ||
| 1 (low) | 93 | 19 |
| 2 (moderate) | 234 | 49 |
| 3 (high) | 72 | 15 |
| NA | 78 | 16 |
| 10-year disease recurrence | ||
| No | 327 | 69 |
| Yes | 150 | 31 |
| Adjuvant therapy | ||
| None | 164 | 34 |
| Endocrine only | 205 | 43 |
| Systemic treatment | 108 | 23 |
The clinicopathological characteristics of the five independent validation series can be found in the referenced publications and in Supplemental Tables S1-S5 (available at http://jmd.amjpathol.org).
NA, not available.
To test the performance of the classifier on patients who were not involved in gene selection and the algorithm training process, five additional series11,13–16 of genomic profiles were obtained, totaling 1016 patients. Selection criteria for each series are summarized in Table 2 and described in detail in the original publications associated with each series. Patients from validation series 1, 2, and 5 did not receive adjuvant therapy. Of 159 patients, 126 (79%) in validation series 3 received adjuvant systemic therapy, although patient-level treatment data for this series were not available. All patients in validation series 4 were estrogen receptor (ER) positive and received adjuvant hormonal therapy. Clinicopathological tables for each of the five validation series are provided in Supplemental Tables S1-S5 (available at http://jmd.amjpathol.org).
Table 2.
Training and Validation Series Details, Group Size, Demographic Description, and Multivariate Cox Proportional Hazards Analysis Output (DMFS and OS)
| Series | Description | Covariate | DMFS P value⁎ | DMFS HR (95% CI) | OS P value† | OS HR (95% CI) |
|---|---|---|---|---|---|---|
| Training: GSE4922, Ivshina et al,12; GSE6532, Loi et al11 (N = 477) | ER+/ER-, N0/N1, systemic therapy, tamoxifen only, or no adjuvant therapy | Age | 0.42 | 1.01 (0.99–1.02) | ||
| ER+ | 0.58 | 1.18 (0.65–2.16) | ||||
| Grade | 0.059 | 1.40 (0.99–1.97) | ||||
| Size | 0.10 | 1.01 (1.00–1.02) | ||||
| Node+ | 0.0001‡ | 2.79 (1.67–4.66)‡ | ||||
| Endocrine therapy | 0.28 | 0.73 (0.42–1.28) | ||||
| Chemotherapy | 0.0032‡ | 0.35 (0.18–0.70)‡ | ||||
| 200-Gene signature | 0.0001‡ | 3.14 (1.80–5.49)‡ | ||||
| Validation 1: GSE7390, Desmedt et al13 (N = 198) | ER+/–, N0, <61 years, untreated, ≤5 cm | Age | 0.35 | 1.022 (0.98–1.07) | 0.46 | 1.02 (0.97–1.06) |
| ER+ | 0.54 | 0.81 (0.40–1.62) | 0.033‡ | 0.48 (0.25–0.94)‡ | ||
| Grade | 0.73 | 1.11 (0.63–1.95) | 0.23 | 0.74 (0.45–1.21) | ||
| Size | 0.092 | 1.35 (0.95–1.92) | 0.074 | 1.35 (0.97–1.87) | ||
| 200-Gene signature | 0.0046‡ | 4.37 (1.58–12.08)‡ | 0.0053‡ | 3.31 (1.43–7.64)‡ | ||
| Validation 2: GSE11121, Schmidt et al14 (N = 200) | ER+/–, untreated, population based, N0 | Grade | 0.033‡ | 1.93 (1.057–3.51)‡ | ||
| Size | 0.79 | 1.044 (0.75–1.45) | ||||
| 200-Gene signature | 0.056 | 2.63 (0.98–7.055) | ||||
| Validation 3: GSE1456, Pawitan et al15 (N = 159) | ER+/–, population based, 126 received adjuvant therapy | Grade | 0.19 | 1.47 (0.83–2.64) | 0.34 | 1.40 (0.70–2.80) |
| 200-Gene signature | 0.055 | 2.58 (0.98–6.67) | 0.025‡ | 4.67 (1.23–17.81)‡ | ||
| Validation 4: GSE9195 and GSE6532, Loi et al11 (N = 128) | ER+, adjuvant tamoxifen treated, N0/N1, ≤5 cm | Age | 0.22 | 0.97 (0.93–1.019) | ||
| Grade | 0.74 | 0.89 (0.46–1.72) | ||||
| Nodes | 0.94 | 0.96 (0.38–2.38) | ||||
| Size | 0.0075‡ | 1.49 (1.11–1.98)‡ | ||||
| 200-Gene signature | 0.019‡ | 6.51 (1.37–30.86)‡ | ||||
| Validation 5: NKI 295, Van De Vijver et al16 (N = 295)§ | ER+/–, untreated, stage I/ II, <53 years; N0/N1 | ER+ | 0.18 | 0.74 (0.47–1.16) | 0.057 | 0.51 (0.32–0.82) |
| Node+ | 0.39 | 0.84 (0.56–1.25) | 0.63 | 0.90 (0.57–1.40) | ||
| 99-Gene signature | <0.0001‡ | 2.92 (1.77–4.80)‡ | <0.0001‡ | 3.91 (2.06–7.42)‡ |
GSE numbers are the National Center for Biotechnology Information Gene Expression Omnibus entry for each series.
GSE, GEO Series; N0, lymph node negative; N1, lymph node positive; NKI, Nederlands Kanker Instituut (Netherlands Cancer Institute).
Value for RFS in the training series and for DMFS in the validation 1, 3, 4, and 5 series.
Value for OS in the validation 1 and 5 series and DSS in the validation 3 series. OS details for other series not available.
Statistically significant variables within each CPH model.
Validation series 5 was generated using a custom oligonucleotide microarray containing 99 of the 200 genes used by the classifier.
Data were obtained from Rosetta Inpharmatics, Seattle, WA (http://www.rii.com/publications/2002/nejm.html, last accessed March 3, 2011).
Gene Expression Data Processing and Quality Control
Training and validation series 1 through 4 were generated using a platform (Affymetrix GeneChip) with a chip (U133a or U133 Plus 2.0). Sample processing and hybridization (GeneChip) was performed according to manufacturer recommendations, as reported by the respective original publications.11–14,17 Raw GeneChip output files (CEL files) were processed with the MAS5 method and median centered using the housekeeping/reference gene set (Affymetrix) value, defined by determining the median.
Validation series 5 was generated using a custom two-channel oligonucleotide microarray, described by van't Veer et al3 and van de Vijver et al.16 Data from this validation series were downloaded in a normalized log-ratio format.
Prognostic Gene Selection and Algorithm Training
A modified version of the method described by Bair and Tibshirani,18 implemented in a package (BRB ArrayTools),19 was used to develop and train a predictive algorithm to stratify patients into categories corresponding to a high or low risk of disease recurrence. This method uses Cox proportional hazards (CPH) models to relate RFS to a specified number of “metagene” expression levels (ie, principal component linear combinations of expression data). To identify a predictive set of genes for use with the classification algorithm, tenfold cross validation (CV) was performed on the training series. At each iteration of the CV process, those genes significantly associated with RFS (P < 0.001) in nine tenths of the training series, independent of age, tumor size, ER status, nodal involvement, and tumor grade, were identified. These genes were used to predict the RFS risk status of the “held-out” one tenth of the training series. An example of the CPH method of gene selection is provided in Supplemental Table S6 (available at http://jmd.amjpathol.org).
Genes selected in two or more of the CV rounds were selected for inclusion in the final predictive gene set. To minimize the impact of inter-laboratory “batch effects” on the performance of the classifier, a data standardization method was developed. This involved converting the log 2 intensity values for the final gene set to percentile rank values (ie, 0.00 to 100.00) using the “percentrank” function in Microsoft Excel or the “ecdf” function in R. The metagene classifier was then retrained on the percentile rank values to generate the final classification algorithm.
The prognostic index can be computed by the following formula: Σiwixi + C, where wi and xi are the weight and logged gene expression, respectively, for the i gene and C is an adjustment factor calculated during algorithm training to center the distribution of indexes at approximately 0. A high value of the prognostic index corresponds to a high value of hazard of developing distant metastases. The classification threshold was set based on the 33rd percentile of training series prognostic indexes.
Because a subset of the training series (164 patients) did not receive any form of adjuvant therapy, the entire gene selection and algorithm training process was repeated using data corresponding to the untreated patients alone. Cross-validated risk-group predictions from the model developed were compared with those generated using the complete series; however, a reduction in cross-validated algorithm performance was observed (data not shown). Thus, the signature generated from analysis of the complete 477-patient series was retained as the final model.
Statistical Analysis
Kaplan-Meier analysis and log-rank testing were used to evaluate the RFS, distant metastases–free survival (DMFS), OS, or disease-specific survival (DSS) of predicted risk groups identified within each series. All follow-up data were censored at 10 years. Multivariate CPH analysis of each series was performed, using the available clinical covariates for each (Table 2). In all CPH analyses, the low-risk group was used as the reference group. For all tests, P < 0.05 was considered statistically significant. Assay sensitivity, specificity, and positive predictive values were calculated on validation series 1 and 2 using 10-year censored data.
Gene expression analysis was performed using R (http://www.r-project.org, last accessed March 3, 2011), Bioconductor,20 and BRB ArrayTools.21 Statistical analyses were performed using MedCalc (MedCalc Inc., Mariakerke, Belgium). An online gene expression analysis system (ChipDX) was developed with R, Bioconductor, Microsoft ASP.net, and SQL Server (Microsoft Corporation, Redmond, WA).
Results
Selection of Genes Associated with Cancer Recurrence and Comparison with Other Signatures
From the training series of 477 patients with breast cancer, Cox regression–based gene selection identified a set of 200 genes with univariate prognostic significance (P < 0.001). These genes were associated with RFS, independent of age, tumor grade, ER status, tumor size, and nodal involvement. Of the 200 genes, only three (CKS2, PRC1, and TRIP13; all involved in cell-cycle regulation) were shared with the 231-gene Amsterdam signature of van't Veer et al3; two genes (CCNB1 and MKI67; involved in cell cycle regulation and proliferation) were shared with the 21-gene recurrence score.2,3 No genes were in common between all three classifiers. A nonsignificant overlap of seven genes was observed with the Sørlie et al22 intrinsic subtype gene list [361 (85%) of the 427 unique genes in this list were present on the U133A GeneChip]. The annotated 200-gene set, correlations to outcome, and CPH P values are provided in Supplemental Table S7 (available at http://jmd.amjpathol.org).
Although the genes were selected without regard to their known or purported biological functions, it was hypothesized that closer inspection of the set would reveal roles in cancer development and progression. Functional analysis was performed using Ingenuity Pathway Analysis (http://www.ingenuity.com/products/pathways-analysis.html, last accessed March 3, 2011), which compares the composition of a given gene set with a database of all known genes and associated functional annotation. This analysis revealed that significant associations existed between the 200-gene set and gene categories known to regulate tumorigenesis (eg, ADAM17, MKI67, and CCNB1), cell cycle modulation (eg, ATM, SMARCA4, and CSK2), cell death (eg, APC, BCL2L, and TOP2A), and connective tissue development (eg, NR3C1 and CD46). The top three canonical pathways enriched in the prognostic gene set were ATM signaling (eg, ATM, MAP2K4, and H2AFX), hereditary breast cancer signaling (eg, POLR2H, RAC2, and SMARCA4), and cell cycle G2/M DNA damage checkpoint regulation (eg, CCNB1, GADD45A, and TOP2A).
These results suggest that the 200-gene signature represents several diverse biological and molecular processes relevant to breast cancer development and progression. This observation has also been made of other prognosis signatures that share similar categories of enriched genes.23
Training Series Cross Validation and Algorithm Training
After converting the gene expression intensities of the 200 genes to percentile-rank values (from 0.00 to 100.00), the metagene algorithm was retrained. Risk-group predictions were compared with those generated by the gene expression (log) intensity algorithm to verify no loss of accuracy had occurred because of the data conversion process. In the finalized rank-based algorithm, samples were classified as low risk if their prognostic index was ≤−0.38 or high risk if the index was greater than this threshold (Figure 1). Table 1 provides details of the 477-patient training series used for gene selection and algorithm training. Clinicopathological characteristics of the five independent validation series can be found in the referenced publications and in Supplemental Tables S1-S5 (available at http://jmd.amjpathol.org).
Figure 1.
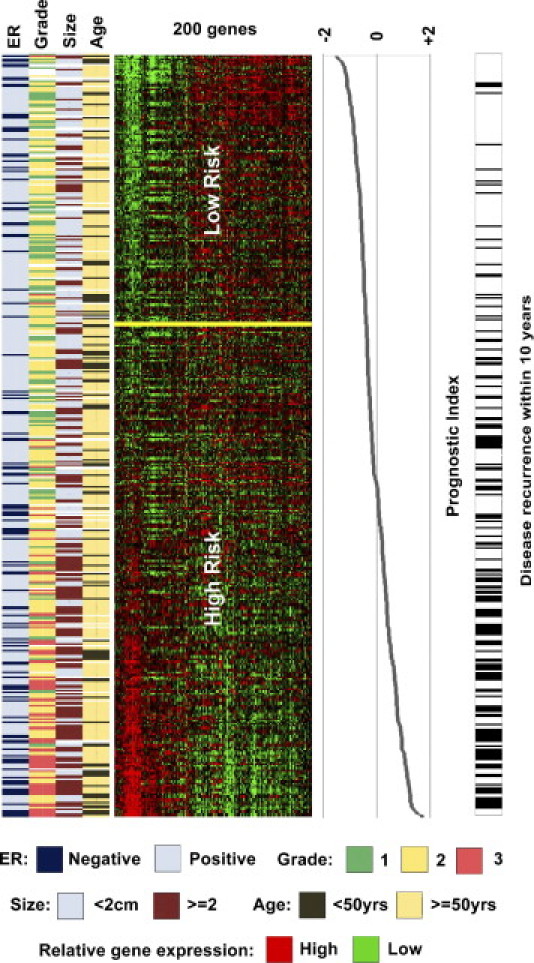
Visualization of the 200-gene signature in the training series of patients with breast cancer. Patients are represented horizontally, and genes are represented vertically. Rows are ordered by increasing prognostic index (range, –2 to 2), and those individuals experiencing disease relapse within 10 years are indicated with a black bar adjacent to the gene-expression matrix. Patients without disease recurrence but less than a 3-year follow-up are excluded. Gene expression: red, up-regulated; green, down-regulated; and black, no change or absent.
In Figure 1, this threshold corresponded to an 8.5% false-negative rate for 5-year RFS in the subset of training series patients who did not receive systemic therapy.
Figure 1 also shows the relationship between tumor grade and prognostic index, with 97% of grade 3 tumors classified as high risk and 54% of grade 1 tumors classified as low risk. Of grade 2 tumors, 69% (representing 54% of the complete training series) were classified as high risk. The result of a χ2 test of tumor grade versus risk group was significant (P < 0.001). The difference in tumor size was significantly different between risk groups: mean ± SD of 19 ± 10 mm in the low-risk group versus 25 ± 12 mm in the high-risk group (P < 0.0001).
Kaplan-Meier analysis and log-rank testing were performed on the cross-validated training series risk groups, and a statistically significant difference in RFS was observed between the high- and low-risk groups [P < 0.001; hazard ratio (HR), 4.2; 95% confidence interval (CI), 3.0 to 5.8]. At the 10-year follow-up, RFS for the low-risk group [161 patients (33.8%)] was 87%, compared with 56% for the high-risk group [316 patients (66.2%)]. Of the 118 patients who developed disease recurrence within 5 years, 104 (88%) were assigned to the high-risk group. An additional 32 individuals relapsed between 5- and 10-year follow-up, 26 (81%) of whom were classified as high risk by the signature.
Validation series 5 was analyzed on a custom 22,000-feature microarray platform that contained features matching 99 (49.5%) of those used in the 200-gene signature developed herein. [The metagene algorithm was retrained on these 99 genes (percentile-rank values), resulting in cross-validation risk-group assignment changes for 10% of the 477 patients in the training series, compared with their result with the full 200-gene model.] A 15% decrease in the HR of the algorithm was also observed when comparing the CV performance of the 99 genes with that of the 200-gene classifiers (see Supplemental Figure S1 at http://jmd.amjpathol.org).
Analysis of Classifier Performance on Multiple Independent Validation Series
The performance of the 200-gene prognostic signature was evaluated by analysis of multiple independent previously described breast cancer gene expression data sets, summarized in Table 2 and Supplemental Tables S1-S5 (available at http://jmd.amjpathol.org). Kaplan-Meier analyses were assessed with the log-rank test and resulted in a statistically significant result (P ≤ 0.002) for RFS, DMFS, OS, or DSS. For validation series 1 through 4, analyzed by the complete 200-gene signature, each subset of patients classified as low risk (ie, prognostic index ≤−0.38) experienced extremely high survival rates (≥95% at 5 years and ≥90% at 10 years).
Despite validation series 5 being analyzed using a 99-gene subset of the full classifier, a significant stratification for both DMFS and OS was still observed (P < 0.0001 for both). Comparison of risk-group predictions by the 99-gene classifier and those generated by van de Vijver et al16 with their 70-gene algorithm revealed 81% agreement in high-/low-risk group assignment. Kaplan-Meier analysis of the discordant predictions (ie, high/low versus low/high) for DMFS and OS was not statistically significant (P = 0.15, P = 0.26, respectively), indicating neither classifier was superior in these cases, despite the observation that the 99-gene model is known to be less accurate than the full 200-gene version.
Across the five validation series, 376 (37%) of 1016 patients were classified as low risk, a similar proportion to that observed in the cross validation of the training series. Series-specific risk-group numbers are shown in Figure 2.
Figure 2.
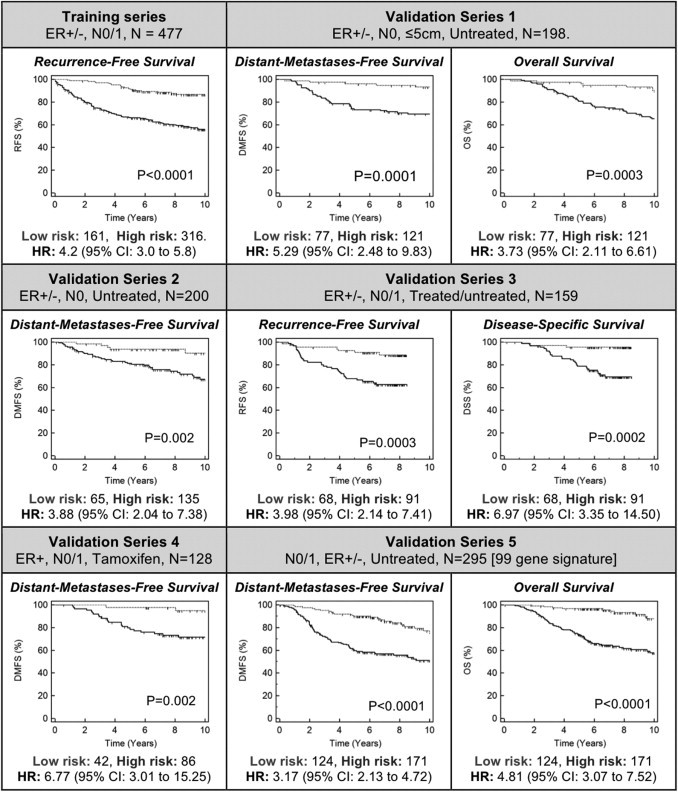
Kaplan-Meier analysis of risk-group–stratified training and validation series. P values are from log-rank testing of the high- versus the low-risk group. Validation series 5 was analyzed using a 99-gene subset classifier, generated using 99 of 200 genes available on the NKI custom microarray used (see Supplemental Figure S1 at http://jmd.amjpathol.org).
To further assess the clinical significance of the 200-gene signature, differences in OS and DSS for the predicted high- and low-risk groups from validation series 1 and 3, respectively, were analyzed. In these series, patients classified as low risk experienced favorable 10-year OS (90%) and 8.5-year DSS (95%). Kaplan-Meier analysis and log-rank testing of the risk groups were significant for both OS (P = 0.002; HR, 6.97; 95% CI, 3.35 to 14.5) and DSS (P = 0.003; HR, 3.73; 95% CI, 2.11 to 6.61). In agreement with these findings, risk-group stratification of patients from validation series 5, performed using the 99-gene model, was highly significant (P < 0.0001; HR, 4.81; 95% CI, 3.07 to 7.52). Of patients from this series, 88% who were classified as low risk were alive at the 10-year follow-up.
Multivariate Analysis of 200-Gene Risk-Group Predictions
Multivariate CPH was performed on the training and validation series using all available clinicopathological covariates to further assess the clinical significance of the 200-gene algorithm (Table 2). Covariate-adjusted RFS HRs for the training series and validation series 1 and 4 were statistically significant: 3.14 (P = 0.0001), 4.37 (P = 0.0046), and 6.51 (P = 0.019), respectively. The 200-gene signature was marginally significant in validation series 2 (P = 0.056) and 3 (P = 0.055). Analysis of validation series 5 revealed the 99-gene subset classifier to be independently significant for both DMFS and OS (P < 0.0001). In each CPH analysis, the gene expression classifier was the strongest predictor of outcome.
Analysis of untreated N0 patients (validation series 1 and 2) revealed the sensitivity and specificity of the assay for predicting 10-year DMFS to be 87.8% (95% CI, 78.7% to 94.0%) and 41.8% (95% CI, 36.0% to 47.8%), respectively. The positive and negative predictive values of the classifier in this clinical setting were 30.5% (95% CI, 24.7% to 36.8%) and 92.2% (95% CI, 86.1% to 96.2%), respectively. The sensitivity and specificity of the assay for 10-year OS (based on validation series 1 only) were 89.2% (95% CI, 74.5% to 97.0%) and 46.1% (95% CI, 37.2% to 55.1%), respectively. The positive and negative predictive values for OS were 32.4% (95% CI, 23.4% to 42.3%) and 93.4% (95% CI, 84% to 96.2%), respectively.
Multivariate Analysis of Training Series Patients Stratified by Gene Expression Risk Group and Adjuvant Treatment Status
CPH analysis was performed on the high- and low-risk subset of training series patients to determine the association of receiving no adjuvant treatment, tamoxifen treatment only, or systemic therapy on RFS. All training series covariates listed in Table 2 were included in this analysis. Of the 161 patients classified as low risk, 61 (38%) did not receive adjuvant treatment, 63 (39%) received tamoxifen only, and 37 (23%) received systemic therapy. CPH analysis revealed neither treatment type was significantly associated with RFS compared with the untreated subset of patients (tamoxifen only, P = 0.69; systemic therapy, P = 0.16) nor were any of the other covariates (P ≥ 0.58 for all), as shown in Supplemental Table S8 (available at http://jmd.amjpathol.org).
Within the high-risk subset of the training series (n = 316), 103 (33%) of the patients were untreated, 142 (45%) received tamoxifen only, and 71 (22%) received systemic therapy. In these patients, CPH analysis showed that systemic therapy was significantly associated with recurrence (P = 0.012; HR, 0.38; 95% CI, 0.18 to 0.81; Supplemental Table S9 at http://jmd.amjpathol.org). This result suggests that individuals with a high-risk gene expression profile who receive systematic adjuvant therapy are approximately two to six times less likely to relapse within 10 years compared with an untreated patient of equivalent clinicopathological and gene expression profile status. Tamoxifen-only treatment was not significantly associated with a significant change in RFS for patients in the high-risk subset (P = 0.63).
Discussion
By leveraging the body of publicly available breast cancer gene expression data, a prognostic signature has been generated and validated on multiple independent series of patients with breast cancer. The 200-gene algorithm uses gene expression rank values and generates a unique prognostic index, the higher values of which are associated with increased risk of disease recurrence and death. Validation of the assay was performed using an independent series of patients with breast cancer, representing 1016 individuals with ER+/− and N0/1 cancer, across multiple age categories, tumor sizes, microarray platforms, treating hospitals, and adjuvant treatment regimens.
The outcome of the 200-gene classifier may be useful in determining the optimal treatment approach for individual patients. For example, someone classified as low risk (prognostic index, ≤−0.38) may elect not to receive adjuvant systemic therapy, confident that ≥95% of several large series of patients with a similar molecular profile were recurrence free at 5 years, with ≥90% remaining recurrence free at 10 years. On the other hand, a patient who is classified as high risk (prognostic index, ≥−0.38) may elect to pursue more aggressive treatment options to reduce his or her risk of recurrence. Furthermore, multivariate analysis of the high-risk patient subset of the cross-validated training series showed a significant benefit from adjuvant systemic therapy compared with untreated patients. Because this observation was made on the same group of patients used to create the signature, further validation of independent patients is warranted. These are theoretical examples of how the algorithm described herein may be useful in the clinical decision-making process.
Analysis of the 477-patient training series revealed an association between histological grade and the prognostic index (Figure 1). Although tumor grade is known to correlate with disease recurrence in an analysis of large populations, it is not included in breast cancer staging guidelines because of the subjectivity associated with its assessment.24,25 Tumor size and patient age are two factors that are included in treatment guidelines and were incorporated into the multivariate analysis of the gene expression risk-group predictions for RFS in validation series 1, 2, and 4. In all three analyses, the 200-gene risk group prediction remained statistically significant and resulted in the largest HR within each model. Tumor size was significantly associated with RFS in validation series 4 only; however, the HR of 1.49 (95% CI, 1.11 to 1.98) indicates that its contribution to the overall model was marginal when compared with the gene expression signature (HR, 6.51; 95% CI, 1.37 to 30.86).
All genomic data used to develop and validate the assay were derived from fresh-frozen tumor tissue, which may not be the most practical preservation method for routine clinical use. A recent clinical trial26 of biomarker-driven treatment allocation for patients with advanced-stage lung cancer showed exciting improvements in response rates and advocates for changes in routine diagnostic work flows to facilitate the use of fresh tissue. Furthermore, a system that allows local specimen processing and genomic data generation may represent an alternate reimbursement model compared with the use of off-site third-party diagnostic services. This factor, potential time savings plus the ability to analyze multiple genomic signatures in parallel, could incentivize changes to allow the collection and preservation of fresh-tissue biopsy specimens in more routine surgical procedures. Viable alternatives to the use of fresh-frozen tissue do exist, including FFPE or RNA-later preservation, both of which have generated high-quality gene expression data using a platform (Affymetrix).27,28 Further studies will be required to evaluate the stability of the assay on tissue preserved in these formats.
The 200-gene prognostic algorithm exhibits several key differences versus the commercially available assays for breast cancer prognosis, including the use of multivariate Cox regression models for gene selection. This method identified individual genes with expression patterns significantly associated with RFS, independent of age, tumor size, grade, ER status, and nodal involvement. Another difference is the use of gene expression ranks, rather than log-transformed expression values or ratios. The use of rank values resulted in a robust algorithm, as demonstrated by the ability to successfully classify patients from multiple independent breast cancer series into risk groups with significant RFS and OS characteristics.
In conclusion, a robust gene expression signature was developed and validated multiple independent breast cancer series totaling 1016 patients, including N0/1 and ER+/− disease, across multiple age groups and adjuvant treatment categories. The algorithm assigns patients to a high- or low-risk group on the basis of a set of 200-gene expression rank values, with those classified as low risk experiencing high rates of RFS, DMFS, DSS, and OS up to 10 years after diagnosis; these patients do not appear to benefit from adjuvant treatment.
The 200-gene signature described herein has been incorporated with automated quality control functions, data visualization, and result-reporting tools (http://www.ChipDX.com; free registration is required). The system is available to interested parties for evaluation use and represents a novel globally available genomic data analysis platform, ultimately aimed at clinical use. By providing a convenient and standardized system for multigene diagnostic assays, the benefits of recurrence-risk prediction and treatment optimization may be extended to more patients worldwide.
Acknowledgments
I acknowledge the patients and researchers responsible for the genomic and clinical data used in this study and thank Elena Provenzano, M.D., Ph.D., FRCPA (Cambridge University Hospital, Cambridge, UK), Lajos Pusztai, M.D., Ph.D. (University of Texas MD Anderson Cancer Center, Houston, TX), Sherene Loi, M.D., Ph.D. (Institut Jules Bordet, Bruxelles, Belgium), and Andrew Holloway, Ph.D. (Peter MacCallum Cancer Center, Melbourne, Australia) for helpful discussions and assistance with manuscript preparation.
Footnotes
R.K.V.L. is the founder and developer of ChipDX LLC. A provisional patent application has been filed and includes the method described in this article.
Supplemental material for this article can be found at http://jmd.amjpathol.org or at doi: 10.1016/j.jmoldx.2010.12.003.
Supplemental data
Kaplan-Meier analysis of the “99-gene subset” classifier developed analysis of validation series 5 (NKI patients). To analyze this series using the ChipDX system, a classifier was trained on the original 477-patient training series using a subset of 99 of the 200 genes in the full signature that were present on the NKI custom 22k microarray used to profile the patients in this validation series. The 99-gene signature assigned 158 of the training series patients to the low-risk group and 319 to the high-risk group (log-rank test P < 0.0001). The HR of the 99-gene classifier, 3.56 (95% CI, 2.56 to 4.95), was 15.3% smaller than that obtained for the full 200-gene classifier, generated on the same training series.
References
- 1.Harris L., Fritsche H., Mennel R., Norton L., Ravdin P., Taube S., Somerfield M.R., Hayes D.F., Bast R.C., Jr American Society of Clinical Oncology 2007 update of recommendations for the use of tumor markers in breast cancer. J Clin Oncol. 2007;25:5287–5312. doi: 10.1200/JCO.2007.14.2364. [DOI] [PubMed] [Google Scholar]
- 2.Paik S., Shak S., Tang G., Kim C., Baker J., Cronin M., Baehner F.L., Walker M.G., Watson D., Park T., Hiller W., Fisher E.R., Wickerham D.L., Bryant J., Wolmark N. A multigene assay to predict recurrence of tamoxifen-treated, node-negative breast cancer. N Engl J Med. 2004;351:2817–2826. doi: 10.1056/NEJMoa041588. [DOI] [PubMed] [Google Scholar]
- 3.van't Veer L.J., Dai H., van de Vijver M.J., He Y.D., Hart A.A., Mao M., Peterse H.L., van der Kooy K., Marton M.J., Witteveen A.T., Schreiber G.J., Kerkhoven R.M., Roberts C., Linsley P.S., Bernards R., Friend S.H. Gene expression profiling predicts clinical outcome of breast cancer. Nature. 2002;415:530–536. doi: 10.1038/415530a. [DOI] [PubMed] [Google Scholar]
- 4.Wang Y., Klijn J., Zhang Y., Sieuwerts A., Look M., Yang F., Talantov D., Timmermans M., van Gelder M., Yu J., Jatkoe T., Berns E., Atkins D., Foekens J. Gene-expression profiles to predict distant metastasis of lymph-node-negative primary breast cancer. Lancet. 2005;365:671–679. doi: 10.1016/S0140-6736(05)17947-1. [DOI] [PubMed] [Google Scholar]
- 5.Ma X.J., Wang Z., Ryan P.D., Isakoff S.J., Barmettler A., Fuller A., Muir B., Mohapatra G., Salunga R., Tuggle J.T., Tran Y., Tran D., Tassin A., Amon P., Wang W., Enright E., Stecker K., Estepa-Sabal E., Smith B., Younger J., Balis U., Michaelson J., Bhan A., Habin K., Baer T.M., Brugge J., Haber D.A., Erlander M.G., Sgroi D.C. A two-gene expression ratio predicts clinical outcome in breast cancer patients treated with tamoxifen. Cancer Cell. 2004;5:607–616. doi: 10.1016/j.ccr.2004.05.015. [DOI] [PubMed] [Google Scholar]
- 6.Ein-Dor L., Kela I., Getz G., Givol D., Domany E. Outcome signature genes in breast cancer: is there a unique set? Bioinformatics. 2005;21:171–178. doi: 10.1093/bioinformatics/bth469. [DOI] [PubMed] [Google Scholar]
- 7.Abraham G., Kowalczyk A., Loi S., Haviv I., Zobel J. Prediction of breast cancer prognosis using gene set statistics provides signature stability and biological context. BMC Bioinformatics. 2010;11:277. doi: 10.1186/1471-2105-11-277. [DOI] [PMC free article] [PubMed] [Google Scholar]
- 8.Haibe-Kains B., Desmedt C., Piette F., Buyse M., Cardoso F., van't Veer L., Piccart M., Bontempi G., Sotiriou C. Comparison of prognostic gene expression signatures for breast cancer. BMC Genomics. 2008;9:394. doi: 10.1186/1471-2164-9-394. [DOI] [PMC free article] [PubMed] [Google Scholar]
- 9.Cardoso F., Piccart-Gebhart M., Van't Veer L., Rutgers E. The MINDACT trial: the first prospective clinical validation of a genomic tool. Mol Oncol. 2007;1:246–251. doi: 10.1016/j.molonc.2007.10.004. [DOI] [PMC free article] [PubMed] [Google Scholar]
- 10.Van Laar R.K. An online gene expression assay for determining adjuvant therapy eligibility in patients with stage 2 or 3 colon cancer. Br J Cancer. 2010;103:1852–1857. doi: 10.1038/sj.bjc.6605970. [DOI] [PMC free article] [PubMed] [Google Scholar]
- 11.Loi S., Haibe-Kains B., Desmedt C., Lallemand F., Tutt A.M., Gillet C., Ellis P., Harris A., Bergh J., Foekens J.A., Klijn J.G.M., Larsimont D., Buyse M., Bontempi G., Delorenzi M., Piccart M.J., Sotiriou C. Definition of clinically distinct molecular subtypes in estrogen receptor-positive breast carcinomas through genomic grade. J Clin Oncol. 2007;25:1239–1246. doi: 10.1200/JCO.2006.07.1522. [DOI] [PubMed] [Google Scholar]
- 12.Ivshina A.V., George J., Senko O., Mow B., Putti T.C., Smeds J., Lindahl T., Pawitan Y., Hall P., Nordgren H., Wong J.E.L., Liu E.T., Bergh J., Kuznetsov V.A., Miller L.D. Genetic reclassification of histologic grade delineates new clinical subtypes of breast cancer. Cancer Res. 2006;66:10292–10301. doi: 10.1158/0008-5472.CAN-05-4414. [DOI] [PubMed] [Google Scholar]
- 13.Desmedt C., Piette F., Loi S., Wang Y., Lallemand F.O., Haibe-Kains B., Viale G., Delorenzi M., Zhang Y., d'Assignies M.S., Bergh J., Lidereau R., Ellis P., Harris A.L., Klijn J.G.M., Foekens J.A., Cardoso F., Piccart M.J., Buyse M., Sotiriou C. Strong time dependence of the 76-gene prognostic signature for node-negative breast cancer patients in the TRANSBIG multicenter independent validation series. Clin Cancer Res. 2007;13:3207–3214. doi: 10.1158/1078-0432.CCR-06-2765. [DOI] [PubMed] [Google Scholar]
- 14.Schmidt M., Bohm D., von Torne C., Steiner E., Puhl A., Pilch H., Lehr H.-A., Hengstler J.G., Kolbl H., Gehrmann M. The humoral immune system has a key prognostic impact in node-negative breast cancer. Cancer Res. 2008;68:5405–5413. doi: 10.1158/0008-5472.CAN-07-5206. [DOI] [PubMed] [Google Scholar]
- 15.Pawitan Y., Bjohle J., Amler L., Borg A.L., Egyhazi S., Hall P., Han X., Holmberg L., Huang F., Klaar S., Liu E.T., Miller L., Nordgren H., Ploner A., Sandelin K., Shaw P.M., Smeds J., Skoog L., Wedren S., Bergh J. Gene expression profiling spares early breast cancer patients from adjuvant therapy: derived and validated in two population-based cohorts. Breast Cancer Res. 2005;7:R953–R964. doi: 10.1186/bcr1325. [DOI] [PMC free article] [PubMed] [Google Scholar]
- 16.van de Vijver M.J., He Y.D., van'T Veer L.J., Dai H., Hart A.A., Voskuil D.W., Schreiber G.J., Peterse J.L., Roberts C., Marton M.J., Parrish M., Atsma D., Witteveen A., Glas A., Delahaye L., van der Velde T., Bartelink H., Rodenhuis S., Rutgers E.T., Friend S.H., Bernards R. A gene-expression signature as a predictor of survival in breast cancer. N Engl J Med. 2002;347:1999–2009. doi: 10.1056/NEJMoa021967. [DOI] [PubMed] [Google Scholar]
- 17.Chowdary D., Lathrop J., Skelton J., Curtin K., Briggs T., Zhang Y., Yu J., Wang Y., Mazumder A. Prognostic gene expression signatures can be measured in tissues collected in RNAlater preservative. J Mol Diagn. 2006;8:31–39. doi: 10.2353/jmoldx.2006.050056. [DOI] [PMC free article] [PubMed] [Google Scholar]
- 18.Bair E., Tibshirani R. Semi-supervised methods to predict patient survival from gene expression data. PLoS Biol. 2004 doi: 10.1371/journal.pbio.0020108. [DOI] [PMC free article] [PubMed] [Google Scholar]
- 19.Simon R., Lam A., Li M.C., Ngan M., Menenzes S., Zhao Y. Analysis of gene expression data using BRB-Array Tools. Cancer Inform. 2007;3:11–17. [PMC free article] [PubMed] [Google Scholar]
- 20.Gentleman R.C., Carey V.J., Bates D.M., Bolstad B., Dettling M., Dudoit S., Ellis B., Gautier L., Ge Y., Gentry J., Hornik K., Hothorn T., Huber W., Iacus S., Irizarry R., Leisch F., Li C., Maechler M., Rossini A.J., Sawitzki G., Smith C., Smyth G., Tierney L., Yang J.Y., Zhang J. Bioconductor: open software development for computational biology and bioinformatics. Genome Biol. 2004;5:R80. doi: 10.1186/gb-2004-5-10-r80. [DOI] [PMC free article] [PubMed] [Google Scholar]
- 21.Simon R., Lam A., Li M.-C., Ngan M., Menenzes S., Zhao Y. Analysis of Gene Expression Data Using BRB-Array Tools. Cancer Inform. 2007;3:11–17. [PMC free article] [PubMed] [Google Scholar]
- 22.Sørlie T., Perou C.M., Tibshirani R., Aas T., Geisler S., Johnsen H., Hastie T., Eisen M.B., van de Rijn M., Jeffrey S.S., Thorsen T., Quist H., Matese J.C., Brown P.O., Botstein D., Eystein Lønning P., Børresen-Dale A.L. Gene expression patterns of breast carcinomas distinguish tumor subclasses with clinical implications. Proc Natl Acad Sci U S A. 2001;98:10869–10874. doi: 10.1073/pnas.191367098. [DOI] [PMC free article] [PubMed] [Google Scholar]
- 23.Shen R., Chinnaiyan A.M., Ghosh D. Pathway analysis reveals functional convergence of gene expression profiles in breast cancer. BMC Med Genomics. 2008;1:28. doi: 10.1186/1755-8794-1-28. [DOI] [PMC free article] [PubMed] [Google Scholar]
- 24.Robbins P., Pinder S., Klerk N.D., Dawkins H., Harvey J., Sterrett G., Ellis I., Elston C. Histological grading of breast carcinomas: a study of interobserver agreement. Human Pathol. 1995;26:873–879. doi: 10.1016/0046-8177(95)90010-1. [DOI] [PubMed] [Google Scholar]
- 25.Singletary S.E., Allred C., Ashley P., Bassett L.W., Berry D., Bland K.I., Borgen P.I., Clark G., Edge S.B., Hayes D.F., Hughes L.L., Hutter R.V., Morrow M., Page D.L., Recht A., Theriault R.L., Thor A., Weaver D.L., Wieand H.S., Greene F.L. Revision of the American Joint Committee on Cancer staging system for breast cancer. J Clin Oncol. 2002;20:3628–3636. doi: 10.1200/JCO.2002.02.026. [DOI] [PubMed] [Google Scholar]
- 26.Trial watch: adaptive BATTLE trial uses biomarkers to guide lung cancer treatment. Nat Rev Drug Discov. 2010;9:423. doi: 10.1038/nrd3199. [DOI] [PubMed] [Google Scholar]
- 27.Abdueva D., Wing M., Schaub B., Triche T., Davicioni E. Quantitative expression profiling in formalin-fixed paraffin-embedded samples by affymetrix microarrays. J Mol Diagn. 2010;12:409–417. doi: 10.2353/jmoldx.2010.090155. [DOI] [PMC free article] [PubMed] [Google Scholar]
- 28.Mutter G., Zahrieh D., Liu C., Neuberg D., Finkelstein D., Baker H., Warrington J. Comparison of frozen and RNALater solid tissue storage methods for use in RNA expression microarrays. BMC Genomics. 2004;5:88. doi: 10.1186/1471-2164-5-88. [DOI] [PMC free article] [PubMed] [Google Scholar]
Associated Data
This section collects any data citations, data availability statements, or supplementary materials included in this article.
Supplementary Materials
Kaplan-Meier analysis of the “99-gene subset” classifier developed analysis of validation series 5 (NKI patients). To analyze this series using the ChipDX system, a classifier was trained on the original 477-patient training series using a subset of 99 of the 200 genes in the full signature that were present on the NKI custom 22k microarray used to profile the patients in this validation series. The 99-gene signature assigned 158 of the training series patients to the low-risk group and 319 to the high-risk group (log-rank test P < 0.0001). The HR of the 99-gene classifier, 3.56 (95% CI, 2.56 to 4.95), was 15.3% smaller than that obtained for the full 200-gene classifier, generated on the same training series.