

Abstract
High‐resolution peripheral quantitative computed tomography (HR‐pQCT) is a new in vivo imaging technique for assessing 3D microstructure of cortical and trabecular bone at the distal radius and tibia. No studies have investigated the extent to which measurements of the peripheral skeleton by HR‐pQCT reflect those of the spine and hip, where the most serious fractures occur. To address this research question, we performed dual‐energy X‐ray absorptiometry (DXA), central QCT (cQCT), HR‐pQCT, and image‐based finite‐element analyses on 69 premenopausal women to evaluate relationships among cortical and trabecular bone density, geometry, microstructure, and stiffness of the lumbar spine, proximal femur, distal radius, and distal tibia. Significant correlations were found between the stiffness of the two peripheral sites (r = 0.86), two central sites (r = 0.49), and between the peripheral and central skeletal sites (r = 0.56–0.70). These associations were explained in part by significant correlations in areal bone mineral density (aBMD), volumetric bone mineral density (vBMD), and cross‐sectional area (CSA) between the multiple skeletal sites. For the prediction of proximal femoral stiffness, vBMD (r = 0.75) and stiffness (r = 0.69) of the distal tibia by HR‐pQCT were comparable with direct measurements of the proximal femur: aBMD of the hip by DXA (r = 0.70) and vBMD of the hip by cQCT (r = 0.64). For the prediction of vertebral stiffness, trabecular vBMD (r = 0.58) and stiffness (r = 0.70) of distal radius by HR‐pQCT were comparable with direct measurements of lumbar spine: aBMD by DXA (r = 0.78) and vBMD by cQCT (r = 0.67). Our results suggest that bone density and microstructural and mechanical properties measured by HR‐pQCT of the distal radius and tibia reflect the mechanical competence of the central skeleton. © 2010 American Society for Bone and Mineral Research.
Keywords: high‐resolution peripheral quantitative computed tomography, finite‐element analysis, lumbar spine, proximal femur, distal radius, distal tibia
Introduction
The most common sites of osteoporotic fracture are the proximal femur, vertebra, and distal radius. Measurement of areal bone mineral density (aBMD) of these sites by dual‐energy X‐ray absorptiometry (DXA) is currently the accepted method for the clinical diagnosis of osteoporosis and assessment of fracture risk.1 However, DXA measures integral bone mass of the cortical and trabecular bone compartments divided by the 2D projected area. Therefore, the aBMD measurement provided by DXA is highly influenced by bone size. Moreover, DXA does not distinguish between cortical and trabecular compartments, which may contribute differentially to bone strength and resistance to fracture. Thus there has been great interest in developing new imaging methods capable of measuring bone microstructure that then could be used to derive volumetric bone mineral density (vBMD) and microstructural and mechanical measurements and improve our understanding of the microarchitectural mechanisms that contribute to bone fragility.2, 3
One such clinical imaging modality is high‐resolution peripheral quantitative computed tomography (HR‐pQCT). HR‐pQCT has an isotropic voxel size of 82 µm, which allows for separate measurements of the trabecular and cortical bone compartments at the distal radius and tibia and is high enough to assess the microarchitecture of trabecular bone.4, 5 HR‐pQCT images can also be used for building microstructural finite‐element (µFE) models to estimate stiffness, a measurement of the mechanical competence of whole‐bone segments. Several studies have demonstrated the clinical utility of this novel technique in distinguishing between subjects with and without fractures and have shown that HR‐pQCT image–based analyses can provide measurements of microstructural and mechanical properties that associate independently with prevalent fractures.4, 6, 7, 8, 9, 10, 11, 12, 13
It would be desirable to generate high‐resolution 3D images of the trabecular and cortical bone microarchitecture of the central skeleton, where many of the most clinically serious fractures occur. However, the achievable signal‐to‐noise ratio of magnetic resonance imaging (MRI) limits its ability to acquire highly resolved images of the lumbar spine and proximal femur. Currently, central QCT (cQCT) scanners available for clinical use cannot evaluate microarchitectural features of vertebral bone and have difficulty distinguishing between cortical and trabecular regions.14, 15 Even though multidetector high‐resolution computed tomography (HR‐CT) has recently been developed for imaging, high radiation exposure limits its general applicability.16, 17, 18, 19, 20 It would be ideal if measurements of microarchitecture and mechanical competence at peripheral sites, which involve much less ionizing radiation, could be used as indicators of central bone quality. However, the microstructure of one skeletal site may not correlate well with the microstructure of another site.21 To our knowledge, there are no published data investigating the correlations of bone density, structure, and mechanical measurements between central and peripheral skeletal sites at the whole‐bone level in vivo.
The primary objective of this study was to investigate whether and to what extent measurements obtained at peripheral sites (distal tibia and radius) reflect the bone density, microstructure, and mechanical competence at clinically relevant sites (ie, lumbar spine and proximal femur). Many in vitro and in vivo studies have demonstrated that structural characteristics of trabecular bone at peripheral skeletal sites, such as the calcaneus, radius, and tibia, can differentiate between subjects with and without osteoporotic fractures at the proximal femur or spine.11, 22, 23, 24, 25, 26, 27 We therefore hypothesized that bone density, microstructural measurements, and µFE predictions of stiffness of the distal radius and tibia are significantly associated with those of the lumbar vertebrae and proximal femur.
Materials and Methods
Patient population
We included 69 female subjects (20 to 48 years of age) from a cross‐sectional case‐control study of idiopathic osteoporosis (IOP) in premenopausal women8, 9 at Columbia University (New York, NY, USA) and Creighton University (Omaha, NB, USA). All subjects had a detailed history, physical and biochemical evaluation to exclude secondary causes of osteoporosis, including disorders causing premenopausal estrogen deficiency, endocrinopathies (eg, hyperthyroidism, Cushing's syndrome, prolactinoma), eating disorders, celiac or other gastrointestinal diseases, abnormal mineral metabolism (eg, osteomalacia, hyperparathyroidism), hypercalciuria (>300 mg/g of Cr), and drug exposures (eg, glucocorticoids, anticonvulsants, anticoagulants, methotrexate). Subjects were excluded if they had given birth or had lactated within the past 12 months. Subjects with IOP were defined on the basis of a documented history of low‐trauma fractures after age 18 and/or very low BMD measurement (T‐score ≤ –2.5 or Z‐score ≤ –2.0) at the lumbar spine, total hip, or femoral neck. Low‐trauma fractures were defined as equivalent to a fall from a standing height or less, excluding skull or digit fractures. Fractures were ascertained by the review of radiographs or radiograph reports. The fractured sites were excluded from DXA, cQCT, or HR‐pQCT scans. To qualify as normal controls, women were required to have a normal aBMD by DXA (T‐score ≥ –1.0) and no history of adult low‐trauma fractures.
All subjects provided written informed consent, and the Institutional Review Boards of both Columbia University and Creighton University approved these studies.
Areal bone mineral density (aBMD)
aBMD of the lumbar spine (LS), total hip (TH), and one‐third radius (DR) was measured by DXA (QDR‐4500, Hologic, Inc., Walton, MA, USA) at Columbia and Creighton University Medical Centers for all participants. T‐ and Z‐scores compared subjects and controls with normal young and age‐matched populations of the same race and sex, as provided by the manufacturer. Scanners at both sites were cross‐calibrated with a reference phantom to read BMD within 1% at baseline and at 6‐month intervals throughout the study.
HR‐pQCT images of the distal radius and distal tibia
HR‐pQCT (XtremeCT, Scanco Medical AG, Bassersdorf, Switzerland) was performed at Columbia University for 55 participants. The nondominant forearm and distal tibia were immobilized in a carbon fiber shell and scanned as described previously.4, 6, 11 The measurement included 110 slices corresponding to a 9.02‐mm section along the axial direction with a nominal voxel size of 82 µm (Fig. 1). The European Forearm Phantom was scanned whenever subjects were scanned for quality control.
Figure 1.
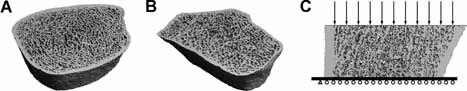
3D HR‐pQCT images of (A) the distal tibia and (B) the distal radius. (C) Boundary conditions for the FE analyses of both the distal tibia and radius.
The standard patient evaluation protocol has been described, validated, and applied in several recent clinical studies.4, 8, 28, 29 Briefly, trabecular bone density (Dtrab) in mg HA/cm3 was calculated as the average mineral density within the trabecular region. The relative bone volume fraction (BV/TVd) was calculated from Dtrab, assuming a density of fully mineralized bone of 1200 mg/cm3 [BV/TVd = Dtrab (mg HA/cm3)/1200 mg HA/cm3].4, 5 To assess trabecular microstructure, 3D ridges (the centerpoints of trabeculae) were identified, and the spacing between them was assessed three‐dimensionally by the distance‐transformation method.5, 30, 31, 32 Trabecular number (Tb.N*) was defined as the inverse of the mean spacing of the 3D ridges. Trabecular thickness (Tb.Th) and spacing (Tb.Sp) were then derived from BV/TVd and Tb.N* [Tb.Thd = BV/TVd/Tb.N* and Tb.Spd = (1 – BV/TVd)/Tb.N*] by analogy to standard histomorphometry.33 For the cortical region, mean cortical thickness (Ct.Th) was assessed as the cortical volume divided by the outer bone surface, according to the manufacturer's standard patient evaluation protocol. Mean cross‐sectional area (CSA) including both cortical and trabecular bone regions was also derived.
Finite element analyses for HR‐pQCT images of the distal radius and tibia
Each thresholded HR‐pQCT image of the distal radius or tibia was converted to a patient‐specific µFE model.28 Briefly, bone tissue was modeled as an isotropic, linear elastic material with a Young's modulus (E s) of 15 GPa and a Poisson's ratio of 0.3.34 A uniaxial displacement equaling 1% of the bone segment height was applied perpendicularly to the distal surface of the radius or tibia for determining axial stiffness (Fig. 1). All µFE analyses were performed by using a customized element‐by‐element preconditioned conjugate gradient solver35 and implemented on a Dell XPS PC workstation (Dell, Inc., Round Rock, TX, USA).
cQCT images of the lumbar spine and proximal femur
Volumetric cQCT acquisitions of the L1–L2 vertebrae and the hips (80 kVp, 140 to 300 mAs, 0.937‐ × 0.937‐mm pixel size, 2.5‐mm slice thickness, pitch = 1, standard reconstruction algorithm) were carried out at Columbia University/New York Presbyterian Hospital (GE CTi and GE Light Speed VCT 64, General Electric Medical Systems, Milwaukee, WI, USA) and Creighton University (Siemens Somatom Plus 4, Siemens Medical Systems, Iselin, NJ, USA and GE LightSpeed DXi, General Electric Medical Systems, Milwaukee, WI, USA) according to a previously described protocol.15, 36, 37 In order to ensure the comparability of the data obtained on the different CT scanners, CT data were cross‐calibrated using the Image Analysis Torso Phantom. For simultaneous calibration of BMD during each scan, a calibration phantom (Image Analysis, Columbia, KY, USA) was placed under the subjects' spine and hips and scanned simultaneously. Then the scan data were archived to CD and forwarded to a central analysis site (University of California San Francisco, Department of Radiology) for scan quality assurance and analysis.
Lumbar spine cQCT scans were performed for 55 participants; 49 also had proximal femur scans. Spine and hip CT images were analyzed with the image analysis software described by Lang and colleagues.15, 36, 37 Hounsfield unit values of CT images were converted to an equivalent concentration of calcium hydroxyapatite according to the phantom calibration. Measures of L1–L2 included vBMD of an integral compartment (iBMD) containing the entire vertebra except for transverse elements, vBMD of a region containing almost all the trabecular bone (tBMD) in the vertebral centrum, and mean cross‐sectional area (CSA) of L1 and L2. Similarly, the left hip was evaluated to obtain iBMD, tBMD, and cortical BMD (coBMD) of the total femur (TF) regions and the minimum cross‐sectional area (min CSA) of the femoral neck.
Finite element analyses for cQCT images of the L1 vertebra and proximal femur
All the CT data sets of L1 and the proximal femur were returned to Columbia University for FE analyses. L1 (with posterior elements removed) and the left proximal femur of each scan were segmented, and the Hounsfield unit values were converted to equivalent mineral density values (g/cm3) of calcium hydroxyapatite using a linear regression of the calibration phantom images (Image Analysis). A continuum FE model was built for each vertebra and femur by converting each bone voxel to a 0.937 × 0.937 × 2.5 mm3 eight‐node brick element (Fig. 2), as previously described.38, 39, 40
Figure 2.
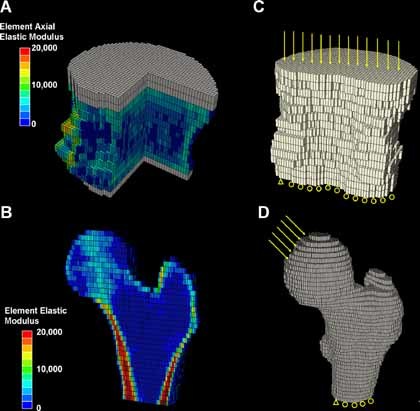
cQCT‐based FE models of human vertebral body L1 and proximal femur. (A, B) Distributions of elastic moduli of elements indicated by different colors. Gray elements indicate PMMA layers. A portion of the vertebral body and half the proximal femur were removed for illustration purposes. (C, D) Boundary conditions of FE analyses.
Vertebral bone tissue was assumed to be a transversely isotropic linear elastic material.38, 40 Material properties were assigned in an element‐specific fashion by mapping the cQCT mineral density value of each element to an axial elastic modulus based on a previously established density‐modulus relationship for vertebral bone38, 40 (Fig. 2 A). A thin layer of Poly(methyl methacrylate) (PMMA) (gray layer in Fig. 2 A; 2.5 to 5 mm thick, Young's modulus E = 2.5 GPa, and Poisson's ratio υ = 0.3) was added on top of the endplates of the vertebra to facilitate applications of uniform displacement boundary conditions.38, 40 A uniaxial compression displacement boundary condition was applied to each model, as shown in Fig. 2 B. Then the FE model of L1 was input into Abaqus 6.7 (SIMULIA, Providence, RI, USA) to determine axial stiffness, as described by Crawford and colleagues.38
Femoral bone tissue was assumed to be an isotropic linear elastic material.39 Material properties were assigned in an element‐specific fashion by mapping the cQCT mineral density value of each element to an elastic modulus based on a previously established density‐modulus relationship for femoral bone39 (Fig. 2 C). A boundary condition–simulating single‐leg stance was applied to each femur model,39 as shown in Fig. 2 D. The FE models of the proximal femur were input into Abaqus 6.7 (SIMULIA) to determine stiffness, as described by Keyak and colleagues.39
Statistical analysis
Statistical analyses were performed using NCSS software (NCSS 2007, NCSS Statistical Software, Kaysville, UT, USA). All data are expressed as mean ± SD. Correlation analyses were conducted to compare aBMD, vBMD, CSA, and stiffness between the lumbar spine, proximal femur, distal radius, and distal tibia and then to investigate the contributions of aBMD, vBMD, CSA, and microstructure to stiffness at the four skeletal sites. Pearson correlation coefficients are provided if both parameters were normally distributed, and Spearman correlation coefficients are provided if results of one or both parameters were not normally distributed based on a Shapiro‐Wilk test. Differences in age or study group had no significant effect on the observed relationships; therefore, unadjusted results are presented. The Fisher z transformation test41 with p < .05 as the standard of statistical significance was used to determine if the correlation coefficients were significantly different.
Results
Subjects included 35 premenopausal women with normal aBMD values and no fractures, 22 with a history of low‐trauma fractures, and 12 with low aBMD values but no fractures. The average age of the subjects was 37.5 ± 8.0 years, with a range of 20 to 48 years. All 69 participants had aBMD measured by DXA. HR‐pQCT scans were performed for 55 subjects at the distal radius and 54 subjects at the distal tibia. cQCT scans were performed for 55 subjects at the lumbar spine and 49 subjects at the proximal femur. The number of subjects who underwent HR‐pQCT or cQCT scans of two sites from the distal radius, distal tibia, lumbar spine, and the total hip are listed in Table 1. The mean values for all DXA, HR‐pQCT, and cQCT measurements and whole‐bone stiffness assessed by cQCT and HR‐pQCT image–based FE analyses are presented in Table 2.
Table 1.
Number of Subjects Who Underwent Scans of Two Sites from the Following: Distal Radius (DR), Distal Tibia (DT), Lumbar Spine L1–L2 (LS), and Total Hip (TH)
| No. of Subjects | cQCT of TH | HR‐pQCT of DR | HR‐pQCT of DT |
|---|---|---|---|
| cQCT of LS | 48 | 45 | 43 |
| cQCT of TH | 40 | 39 | |
| HR‐pQCT of DR | 54 |
Table 2.
Mean ± SD for the Analyzed Variables
| Variable | Mean ± SD | Range | |
|---|---|---|---|
| Age | Age (years) | 37.5 ± 8.0 | 20–48 |
| Areal bone mineral density by DXA | |||
| Lumbar spine, n = 69 | BMD (g/cm2) | 0.995 ± 0.157 | 0.721–1.382 |
| Z‐score | –0.25 ± 1.48 | –2.90–3.60 | |
| Total hip, n = 69 | BMD (g/cm2) | 0.890 ± 0.153 | 0.587–1.147 |
| Z‐score | –0.30 ± 1.24 | –2.80–1.80 | |
| 1/3 radius, n = 69 | BMD (g/cm2) | 0.707 ± 0.054 | 0.604–0.856 |
| Z‐score | 0.45 ± 0.94 | –1.10–2.86 | |
| cQCT measurements | |||
| Lumbar spine, n = 55 | Integral vBMD (g/cm3) | 0.247 ± 0.031 | 0.194–0.319 |
| Trabecular vBMD (g/cm3) | 0.163 ± 0.035 | 0.090–0.263 | |
| CSA (mm2) | 892 ± 125 | 565–1150 | |
| Total femur, n = 49 | Integral vBMD (g/cm3) | 0.272 ± 0.042 | 0.186–0.376 |
| Trabecular vBMD (g/cm3) | 0.144 ± 0.040 | 0.058–0.216 | |
| Cortical vBMD (g/cm3) | 0.472 ± 0.035 | 0.406–0.599 | |
| Min CSA of femoral neck (mm2) | 1008 ± 184 | 729–1688 | |
| HR‐pQCT measurements | |||
| Distal radius, n = 55 | Integral vBMD (g/cm3) | 0.312 ± 0.065 | 0.141–0.490 |
| Trabecular vBMD (g/cm3) | 0.137 ± 0.037 | 0.062–0.200 | |
| Cortical vBMD (g/cm3) | 0.900 ± 0.075 | 0.531–1.018 | |
| CSA (mm2) | 244 ± 40 | 160–328 | |
| BV/TV | 0.114 ± 0.031 | 0.052–0.167 | |
| Tb.N* (1/mm) | 1.85 ± 0.29 | 1.18–2.36 | |
| Tb.Th (mm) | 0.061 ± 0.011 | 0.042–0.087 | |
| Tb.Sp (mm) | 0.494 ± 0.100 | 0.364–0.804 | |
| Ct.Th (mm) | 0.77 ± 0.18 | 0.15–1.17 | |
| Distal tibia, n = 53 | Integral vBMD (g/cm3) | 0.276 ± 0.052 | 0.170–0.397 |
| Trabecular vBMD (g/cm3) | 0.141 ± 0.035 | 0.074–0.217 | |
| Cortical vBMD (g/cm3) | 0.907 ± 0.043 | 0.827–0.997 | |
| CSA (mm2) | 642 ± 89 | 425–812 | |
| BV/TV | 0.117 ± 0.029 | 0.061–0.180 | |
| Tb.N* (1/mm) | 1.77 ± 0.35 | 1.12–2.54 | |
| Tb.Th (mm) | 0.066 ± 0.012 | 0.049–0.109 | |
| Tb.Sp (mm) | 0.523 ± 0.121 | 0.329–0.834 | |
| Ct.Th (mm) | 1.10 ±0.21 | 0.71–1.49 | |
| Stiffness (kN/mm) | |||
| HR‐pQCT | Distal radius | 78.6 ± 19.6 | 32.2–118.1 |
| Distal tibia | 220.8 ± 52.4 | 116.5–321.8 | |
| cQCT | Lumbar spine L1 | 7.2 ± 1.3 | 4.1–10.2 |
| Proximal femur | 17.2 ± 3.6 | 9.6–27.3 | |
Positive and significant correlations were found between the stiffness of the distal radius, distal tibia, lumbar spine, and proximal femur, all p < .001 (Fig. 3). The correlation between the two peripheral sites, distal radius and tibia (r = 0.86), was significantly stronger than the correlations between the other sites. Correlations between the peripheral and central sites were also significant but not as strong (r = 0.56–0.70). Interestingly, the correlation between the two central sites, L1 and proximal femur (r = 0.49), was the weakest, although not statistically different from those between the peripheral and central sites.
Figure 3.
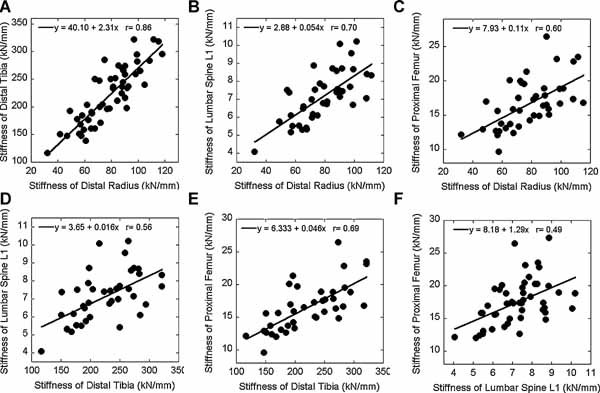
Correlations between the stiffness of the distal radius, distal tibia, lumbar spine L1, and proximal femur by linear regression.
Correlations between integral and trabecular vBMD were all significant (Table 3). The strongest correlations were between the distal tibia assessed by HR‐pQCT and the proximal femur assessed by cQCT (r = 0.78), the distal radius and distal tibia assessed by HR‐pQCT (r = 0.70 and 0.73), and L1 and the proximal femur assessed by cQCT (r = 0.68 and 0.72). For cortical vBMD, only the two peripheral sites, the distal radius and the tibia, correlated significantly (r = 0.40; Table 3).
Table 3.
Relationships Between Integral, Trabecular, and Cortical vBMD Measured by cQCT and HR‐pQCT
| Integral vBMD | Trabecular vBMD | Cortical vBMD | |
|---|---|---|---|
| HR‐pQCT DR versus cQCT LS | 0.36 ‡ | 0.58 * | |
| HR‐pQCT DR versus cQCT TH | 0.56 * | 0.67 * | 0.19 |
| HR‐pQCT DT versus cQCT LS | 0.59 * | 0.53 * | |
| HR‐pQCT DT versus cQCT TH | 0.78 * | 0.78 * | 0.31 |
| HR‐pQCT DR versus HR‐pQCT DT | 0.70 * | 0.73 * | 0.40 † |
| cQCT LS versus cQCT TH | 0.68 * | 0.72 * |
Note: The significant correlations are given in boldface: * p < .001; † p < .01; ‡ p < .05.
Correlations among aBMD values at three skeletal sites and between aBMD and vBMD values at four skeletal sites are shown in Table 4. There were moderate to strong correlations among aBMD measurements (r = 0.54–0.79), and aBMD correlated significantly with vBMD by cQCT and HR‐pQCT at all skeletal sites. aBMD and vBMD agreed well at the lumbar spine (r = 0.79) and proximal femur (r = 0.77). In contrast, aBMD of the 1/3 radius correlated weakly with vBMD at all sites (r = 0.33–0.45). Interestingly, the correlation between aBMD and vBMD of the radius was significantly lower than that of the lumbar spine or proximal femur. This is likely because the 1/3 radius region measured by DXA is more proximal than that measured by HR‐pQCT and is comprised of a much higher proportion of cortical bone.
Table 4.
(Above) Relationships Between aBMD Values at Different Skeletal Sites and (Below) Relationships Between aBMD Values Measured by DXA and vBMD Values Measured by cQCT and HR‐pQCT at Different Skeletal Sites
| LS aBMD | TH aBMD | 1/3 radius aBMD | |
|---|---|---|---|
| LS aBMD | 0.79* | 0.54* | |
| TH aBMD | 0.60* | ||
| HR‐pQCT DR vBMD | 0.39† | 0.54* | 0.33‡ |
| HR‐pQCT DT vBMD | 0.56* | 0.70* | 0.45* |
| cQCT LS vBMD | 0.79* | 0.69* | 0.34‡ |
| cQCT TH vBMD | 0.54* | 0.77* | 0.43† |
p < .001;
p < .01;
p < 0.05.
Geometry was assessed as mean CSA of the lumbar spine, distal radius, and distal tibia and minimum CSA of the femoral neck (Table 5). All CSA measurements correlated significantly, except the distal radius and lumbar spine. Relatively higher correlation coefficients were observed between the two central (r = 0.68) and two peripheral (r = 0.60) sites when compared with those found between the central and peripheral sites (r = 0.41–0.57).
Table 5.
Relationships Between the Mean Cross‐Sectional Area (CSA) of the Distal Radius (DR), Distal Tibia (DT), Lumbar Spine L1–L2 (LS) and the Minimum Cross‐Sectional Area (min CSA) of the Femoral Neck (FN) Measured by cQCT and HR‐pQCT
| CSA of DT | CSA of LS | Min CSA of FN | |
|---|---|---|---|
| CSA of DR | 0.60 * | 0.13 | 0.44 † |
| CSA of DT | 0.41 † | 0.57 * | |
| CSA of LS | 0.68 * |
Note: The significant correlations are given in boldface: * p < .001; † p < .01; ‡ p < .05.
Significant correlations were found between microstructural measurements at the distal radius and tibia: BV/TV (r = 0.73), Tb.N* (r = 0.58), Tb.Th (r = 0.49), Tb.Sp (r = 0.62), and Ct.Th (r = 0.60; all p < .001). The limited spatial resolution of cQCT images does not permit microstructural measurements of the lumbar spine and proximal femur.
The contributions of aBMD, vBMD, geometric, and microstructural measurements to whole‐bone stiffness of the lumbar spine, proximal femur, distal radius, and tibia are presented in Table 6. Stiffness of all four sites correlated significantly with aBMD of the lumbar spine (r = 0.55–0.78) and total hip (r = 0.69–0.81), and the correlations were significantly stronger than those between the stiffness and aBMD of the 1/3 radius (r = 0.38–0.47). In addition, integral and trabecular vBMD of the lumbar spine (r = 0.41–0.73) and proximal femur (r = 0.49–0.76) also correlated significantly with the stiffness of all four sites. In general, however, correlation coefficients were lower than those between the aBMD and stiffness of corresponding sites.
Table 6.
Relationships Between Bone Mineral Density and Structural Parameters Measured by DXA, cQCT, and HR‐pQCT and Stiffness Derived from cQCT and HR‐pQCT Image–Based FE Analyses
| Stiffness | L1 | Proximal femur | Distal radius | Distal tibia | |
|---|---|---|---|---|---|
| Areal bone mineral density by DXA | |||||
| Lumbar spine | aBMD | 0.78 * | 0.55 * | 0.76 * | 0.71 * |
| Total hip | aBMD | 0.69 * | 0.70 * | 0.78 * | 0.81 * |
| 1/3 radius | aBMD | 0.38 † | 0.45 * | 0.47 * | 0.46 * |
| Volumetric bone mineral density and CSA by cQCT | |||||
| Lumbar spine | Integral vBMD | 0.67 * | 0.47 * | 0.73 * | 0.67 * |
| Trabecular vBMD | 0.66 * | 0.41 † | 0.58 * | 0.61 * | |
| CSA | 0.35 ‡ | 0.39 † | 0.40 † | 0.29 | |
| Total femur | Integral vBMD | 0.49 † | 0.64 * | 0.61 * | 0.69 * |
| Trabecular vBMD | 0.57 * | 0.65 * | 0.68 * | 0.76 * | |
| Cortical vBMD | 0.21 | 0.61 * | 0.37 ‡ | 0.42 † | |
| Min CSA | 0.25 | 0.14 | 0.48 † | 0.46 † | |
| HR‐pQCT measurements | |||||
| Distal radius | Integral vBMD | 0.46 † | 0.46 † | 0.71 * | 0.48 * |
| Trabecular vBMD | 0.58 * | 0.47 † | 0.79 * | 0.62 * | |
| Cortical vBMD | 0.06 | 0.06 | 0.28 ‡ | 0.04 | |
| CSA | 0.25 | 0.19 | 0.32 ‡ | 0.48 * | |
| BV/TV | 0.58 * | 0.47 * | 0.79 * | 0.62 * | |
| Tb.N* | 0.56 * | 0.35 ‡ | 0.58 * | 0.57 * | |
| Tb.Th | 0.44 † | 0.55 * | 0.72 * | 0.54 * | |
| Tb.Sp | −0.58 * | −0.42 † | −0.65 * | −0.62 * | |
| Ct.Th | 0.38 ‡ | 0.34 ‡ | 0.65 * | 0.50 * | |
| Distal tibia | Integral vBMD | 0.49 † | 0.75 * | 0.75 * | 0.74 * |
| Trabecular vBMD | 0.47 † | 0.71 * | 0.81 * | 0.88 * | |
| Cortical vBMD | 0.51 * | 0.29 | 0.43 † | 0.32 ‡ | |
| CSA | 0.27 | 0.17 | 0.36 † | 0.51 * | |
| BV/TV | 0.46 † | 0.71 * | 0.81 * | 0.88 * | |
| Tb.N* | 0.55 * | 0.54 * | 0.69 * | 0.66 * | |
| Tb.Th | 0.13 | 0.54 * | 0.44 † | 0.58 * | |
| Tb.Sp | −0.60 * | −0.61 * | −0.72 * | −0.73 * | |
| Ct.Th | 0.41 † | 0.68 * | 0.66 * | 0.67 * | |
Note: The significant correlations are given in boldface: * p < .001; † p < .01; ‡ p < .05.
Most vBMD and microstructural measurements of HR‐pQCT images correlated significantly with the stiffness of all four sites (Table 6). Integral and trabecular vBMD of the distal radius correlated most strongly with stiffness of the distal radius (r = 0.71 and 0.79); correlation coefficients with the other sites were weaker (r = 0.46–0.62). Integral and trabecular vBMD of the distal tibia correlated strongly with the stiffness of the proximal femur, distal radius, and distal tibia (r = 0.71–0.88) and moderately with the stiffness of L1 (r = 0.47 and 0.49). All microstructural measurements of the distal radius and distal tibia correlated positively and significantly with stiffness of all four sites (BV/TV, Tb.N*, Tb.Th, and Ct.Th, r = 0.34–0.88) except for Tb.Sp, which correlated negatively (r = –0.42 to –0.73).
In summary, for prediction of femoral stiffness, integral vBMD (r = 0.75) and stiffness (r = 0.69) of the distal tibia by HR‐pQCT were similar to direct measurements of the proximal femur, aBMD of the hip by DXA (r = 0.70), and vBMD of the hip by cQCT (r = 0.64). For prediction of vertebral stiffness, trabecular vBMD (r = 0.58) and stiffness (r = 0.70) of the distal radius by HR‐pQCT were similar to direct measurements of the lumbar spine, aBMD by DXA (r = 0.78), and vBMD by cQCT (r = 0.67).
Discussion
In this study we compared measurements of aBMD, vBMD, geometry, and microstructure of two peripheral (radius and tibia) and two central (lumbar spine and proximal femur) sites in the same subjects by three clinical imaging modalities and two FE analysis techniques. To our knowledge, this is the first time that relationships among measurements of mechanical competence of multiple skeletal sites have been examined in vivo. Significant correlations were found between the stiffness of the two peripheral sites and the two central sites, as well as between the peripheral and central skeletal sites. Associations between the stiffness of multiple skeletal sites were explained in part by the significant correlations found among other measurements of bone mass and size, such as aBMD, vBMD, and CSA. This is also the first study to evaluate the extent to which trabecular and cortical vBMD, geometry, and microstructural and stiffness parameters measured by HR‐pQCT of the distal radius and tibia reflect stiffness of lumbar spine and proximal femur. Our results suggest that bone density, microstructure, and stiffness measured by HR‐pQCT of the distal radius and tibia reflect stiffness of the lumbar spine and proximal femur, the sites of the most serious osteoporotic fractures.
At the distal radius and tibia, cortical bone plays a critical role in load share.42 The only significant correlation of cortical vBMD among the four skeletal sites was between the two peripheral sites. Integral and trabecular vBMD of the distal radius and tibia also correlated highly with each other. Moreover, strong correlations were found for mean CSA and microstructural measurements between the distal radius and tibia. These factors combined contributed to the high correlation between the stiffness of the two peripheral sites. Furthermore, high correlations were also found for integral and trabecular vBMD and CSA between the distal tibia and the proximal femur, consistent with the strong correlation between the stiffness of the two sites. The moderate correlations between the stiffness of the distal tibia and lumbar spine and between the distal radius and proximal femur may be explained by the moderate correlations between these sites for aBMD, vBMD, and CSA. In contrast, although aBMD, integral and trabecular vBMD, and CSA of the lumbar spine and proximal femur correlated well, there was only moderate correlation between the stiffness of the two central sites. On the other hand, despite moderate correlations for aBMD and integral and trabecular vBMD between the distal radius and the lumbar spine and no correlation for CSA, we found a strong correlation for stiffness. These results indicate that correlations among aBMD, vBMD, and geometry only partially explain correlations for stiffness between different skeletal sites and suggest that other factors such as trabecular bone microstructure and cortical load share may influence differences in stiffness between different skeletal sites. Unfortunately, these measurements cannot be assessed in vivo by currently available imaging modalities for the lumbar spine and proximal femur.
To our knowledge, only two previously published studies have investigated the relationships of bone quality measurements among multiple skeletal sites. Cohen and colleagues compared microstructural and mechanical measurements made on iliac crest bone biopsies by 2D quantitative histomorphometry and micro–computed tomography (µCT) with those from the distal radius and tibia by HR‐pQCT; some of the women included in these analyses also contributed to that study. The authors found moderate and significant associations between the peripheral and axial (transiliac biopsy) measures of microstructure and mechanical competence.7 Eckstein and colleagues reported moderate to weak correlations of microstructural measurements of trabecular bone specimens between the distal radius, femoral neck, femoral trochanter, iliac crest, calcaneus, and lumbar vertebral body.21 The reported correlations were much lower than those found in this study. This may be related to the small dimensions of the bone sample analyzed by Eckstein and colleagues (6 mm in diameter and length). In addition, their subjects consisted of elderly men and women (∼80 years of age), whereas our subjects were premenopausal women; measurement of a bone sample of limited size may not represent properties at the whole‐bone level because of the increased inhomogeneity of trabecular structure with aging.43
Contributions of the microstructural measurements of the distal radius and tibia by HR‐pQCT to their estimated stiffness were significant and strong, consistent with previous studies.28, 42 Furthermore, density and microstructural measurements of the distal radius and tibia by HR‐pQCT were significantly associated with the stiffness of the proximal femur and lumbar spine. The vBMD and stiffness measurements of the distal tibia by HR‐pQCT were particularly strong indicators of femoral stiffness, whereas those of the distal radius by HR‐pQCT were strong indicators of vertebral stiffness. It is intriguing that aBMD of lumbar spine and total hip were strong indicators of the stiffness of all four skeletal sites. These results suggest that DXA measurements of the central skeleton and HR‐pQCT measurements of the peripheral skeleton are good indicators of the stiffness of both peripheral and central skeletal sites.
This study has several important strengths. To our knowledge, it is the only study to evaluate in the same human subjects the relationships among measurements of aBMD, vBMD, geometry, and stiffness of the lumbar spine and proximal femur assessed by DXA and cQCT and vBMD, geometry, microstructure, and stiffness of the distal radius and tibia assessed by HR‐pQCT. We employed state‐of‐the‐art technologies for assessing bone quality in vivo and for understanding both the similarities and differences between multiple skeletal sites. A second strength of the study is the relatively young subject population, including both normal and osteoporotic women, characterized by a broad range of aBMD, vBMD, geometry, microstructure, and stiffness values. Third, this is the first study to address the biologic relevance of HR‐pQCT images of the distal skeleton to the central skeleton.
This study also has several limitations. First, two different FE analysis techniques were used for the central and peripheral skeletal sites. Continuum FE models were built based on cQCT images of the lumbar spine and proximal femur. These models mechanically integrate all the anisotropic and inhomogeneous BMD information and complex geometry of the vertebra and proximal femur but not bone microstructure. In contrast, the microstructural FE models based on HR‐pQCT images of the distal radius and tibia mechanically integrated fine microstructure of cortical and trabecular bone but with the assumption of uniform bone mineralization. These technical differences between the two imaging modalities and FE modeling strategies may have introduced variability into the derived stiffness measurements across central and peripheral skeletal sites, affecting the observed relationships. Second, cortical and trabecular bone microstructure of the lumbar spine and proximal femur were not available owing to the limited spatial resolution of the cQCT device used in this study. With ongoing development of HR‐CT and µMRI techniques, images of central skeletal sites may ultimately have sufficient resolution for in vivo microstructural analyses in the future.16, 17, 18, 19, 20 Such advances will permit additional insights into associations between central and peripheral skeletal sites. Third, the study population consisted only of premenopausal women. Eckstein and colleagues found that relationships of microstructure between sites did not differ by gender.21 However, a study by Riggs and colleagues suggested different trabecular bone loss rates at the distal radius, distal tibia, and lumbar spine for both men and women after age 50.44 Differences in age‐related cortical and trabecular bone loss45 could also affect the observed associations between the measurements, especially those with aBMD. Therefore, it remains unclear whether the relationships observed in this study could be extended to men or to older populations with lower BMD values.
In conclusion, we found that the stiffness of central and peripheral skeletal sites were significantly associated with each other and were explained only partially by significant relationships between aBMD, vBMD, geometry, and microstructure. HR‐pQCT–based images and FE analyses of peripheral skeletal sites are good indicators of stiffness of the lumbar spine and proximal femur and have potential utility in the clinical investigation of osteoporosis.
Disclosures
All the authors state that they have no conflicts of interest.
Acknowledgements
This work was supported in part by grants from the NIH (AR051376, AR055647, AR052661, AR049896, and UL1 RR 024156) and by the Thomas L Kempner and Katheryn C Patterson Foundation.
References
- 1. Miller PD. Clinical use of bone mass measurements in adults for the assessment and management of osteoporosis In: Favus MJ, ed. Primer on the Metabolic Bone Disease and Disorders of Mineral Metabolism 6th ed Washington, DC: American Society for Bone and Mineral Research, 150–161. 2006. [Google Scholar]
- 2. Guo XE, Liu XS, Wehrli FW. Advanced structural assessment of bone using CT and MRI In: Orwoll E, Bilezikian JP, Vanderschueren D, eds. Osteoporosis in Men 2nd ed San Diego, CA: Academic Press, 547–564. 2009. [Google Scholar]
- 3. Kazakia GJ, Majumdar S. New imaging technologies in the diagnosis of osteoporosis. Rev Endocr Metab Disord. 2006; 7: 67–74. [DOI] [PubMed] [Google Scholar]
- 4. Boutroy S, Bouxsein ML, Munoz F, Delmas PD. In vivo assessment of trabecular bone microarchitecture by high‐resolution peripheral quantitative computed tomography. J Clin Endocrinol Metab. 2005; 90: 6508–6515. [DOI] [PubMed] [Google Scholar]
- 5. Laib A, Hauselmann HJ, Ruegsegger P. In vivo high resolution 3D‐QCT of the human forearm. Technol Health Care. 1998; 6: 329–337. [PubMed] [Google Scholar]
- 6. Boutroy S, van Rietbergen B, Sornay‐Rendu E, Munoz F, Bouxsein ML, Delmas PD. Finite Element Analyses Based on In Vivo HR‐pQCT Images of the Distal Radius is Associated with Wrist Fracture in Postmenopausal Women. J Bone Miner Res. 2008; 23: 392–399. [DOI] [PubMed] [Google Scholar]
- 7. Cohen A, Dempster DW, Muller R, et al. Assessment of trabecular and cortical architecture and mechanical competence of bone by high‐resolution peripheral computed tomography: comparison with transiliac bone biopsy. Osteoporos Int. 2010; 21: 263–273. [DOI] [PMC free article] [PubMed] [Google Scholar]
- 8. Cohen A, Liu XS, McMahon DJ, et al. Bone Microarchitecture and Stiffness in Premenopausal Women With Idiopathic Osteoporosis. J Clin Endocrinol Metab. 2009; 94: 4351–4360. [DOI] [PMC free article] [PubMed] [Google Scholar]
- 9. Liu XS, Cohen A, Shane E, et al. Individual Trabeculae Segmentation (ITS)‐Based Morphological Analyses of High Resolution Peripheral Quantitative Computed Tomography Images Detect Abnormal Trabecular Plate and Rod Microarchitecture in Premenopausal Women with Idiopathic Osteoporosis. J Bone Miner Res. 2010; 25: 1496–1505. [DOI] [PMC free article] [PubMed] [Google Scholar]
- 10. Melton LJ 3rd, Riggs BL, van Lenthe GH, et al. Contribution of in vivo structural measurements and load/strength ratios to the determination of forearm fracture risk in postmenopausal women. J Bone Miner Res. 2007; 22: 1442–1448. [DOI] [PubMed] [Google Scholar]
- 11. Sornay‐Rendu E, Boutroy S, Munoz F, Delmas PD. Alterations of cortical and trabecular architecture are associated with fractures in postmenopausal women, partially independent of decreased BMD measured by DXA: the OFELY study. J Bone Miner Res. 2007; 22: 425–433. [DOI] [PubMed] [Google Scholar]
- 12. Vico L, Zouch M, Amirouche A, et al. High‐resolution pQCT analysis at the distal radius and tibia discriminates patients with recent wrist and femoral neck fractures. J Bone Miner Res. 2008; 23: 1741–1750. [DOI] [PubMed] [Google Scholar]
- 13. Walker MD, McMahon DJ, Udesky J, Liu G, Bilezikian JP. Application of high resolution skeletal imaging to measurements of volumetric bone density and skeletal microarchitecture in Chinese American and Caucasian women: explanation of a paradox. J Bone Miner Res. 2009; 24: 1953–1959. [DOI] [PMC free article] [PubMed] [Google Scholar]
- 14. Lang TF, Guglielmi G, van Kuijk C, De Serio A, Cammisa M, Genant HK. Measurement of bone mineral density at the spine and proximal femur by volumetric quantitative computed tomography and dual‐energy X‐ray absorptiometry in elderly women with and without vertebral fractures. Bone. 2002; 30: 247–250. [DOI] [PubMed] [Google Scholar]
- 15. Lang TF, Li J, Harris ST, Genant HK. Assessment of vertebral bone mineral density using volumetric quantitative CT. J Comput Assist Tomogr. 1999; 23: 130–137. [DOI] [PubMed] [Google Scholar]
- 16. Bauer JS, Muller D, Ambekar A, et al. Detection of osteoporotic vertebral fractures using multidetector CT. Osteoporos Int. 2006; 17: 608–615. [DOI] [PubMed] [Google Scholar]
- 17. Gupta R, Cheung AC, Bartling SH, et al. Flat‐panel volume CT: fundamental principles, technology, and applications. Radiographics. 2008; 28: 2009–2022. [DOI] [PubMed] [Google Scholar]
- 18. Ito M, Ikeda K, Nishiguchi M, et al. Multi‐detector row CT imaging of vertebral microstructure for evaluation of fracture risk. J Bone Miner Res. 2005; 20: 1828–1836. [DOI] [PubMed] [Google Scholar]
- 19. Kubota T, Yamada K, Ito H, Kizu O, Nishimura T. High‐resolution imaging of the spine using multidetector‐row computed tomography: differentiation between benign and malignant vertebral compression fractures. J Comput Assist Tomogr. 2005; 29: 712–719. [DOI] [PubMed] [Google Scholar]
- 20. Krug R, Banerjee S, Han ET, Newitt DC, Link TM, Majumdar S. Feasibility of in vivo structural analysis of high‐resolution magnetic resonance images of the proximal femur. Osteoporos Int. 2005; 16: 1307–1314. [DOI] [PubMed] [Google Scholar]
- 21. Eckstein F, Matsuura M, Kuhn V, et al. Sex differences of human trabecular bone microstructure in aging are site‐dependent. J Bone Miner Res. 2007; 22: 817–824. [DOI] [PubMed] [Google Scholar]
- 22. Ladinsky GA, Vasilic B, Popescu AM, et al. Trabecular structure quantified with the MRI‐based virtual bone biopsy in postmenopausal women contributes to vertebral deformity burden independent of areal vertebral BMD. J Bone Miner Res. 2008; 23: 64–74. [DOI] [PMC free article] [PubMed] [Google Scholar]
- 23. Link TM, Bauer J, Kollstedt A, et al. Trabecular bone structure of the distal radius, the calcaneus, and the spine: which site predicts fracture status of the spine best? Invest Radiol. 2004; 39: 487–497. [DOI] [PubMed] [Google Scholar]
- 24. Majumdar S, Link TM, Augat P, et al. Trabecular bone architecture in the distal radius using magnetic resonance imaging in subjects with fractures of the proximal femur. Magnetic Resonance Science Center and Osteoporosis and Arthritis Research Group. Osteoporos Int. 1999; 10: 231–239. [DOI] [PubMed] [Google Scholar]
- 25. Patel PV, Prevrhal S, Bauer JS, et al. Trabecular bone structure obtained from multislice spiral computed tomography of the calcaneus predicts osteoporotic vertebral deformities. J Comput Assist Tomogr. 2005; 29: 246–253. [DOI] [PubMed] [Google Scholar]
- 26. Sornay‐Rendu E, Cabrera‐Bravo JL, Boutroy S, Munoz F, Delmas PD. Severity of vertebral fractures is associated with alterations of cortical architecture in postmenopausal women. J Bone Miner Res. 2009; 24: 737–743. [DOI] [PubMed] [Google Scholar]
- 27. Wehrli FW, Gomberg BR, Saha PK, Song HK, Hwang SN, Snyder PJ. Digital topological analysis of in vivo magnetic resonance microimages of trabecular bone reveals structural implications of osteoporosis. J Bone Miner Res. 2001; 16: 1520–1531. [DOI] [PubMed] [Google Scholar]
- 28. Liu XS, Zhang XH, Sekhon KK, et al. High‐resolution peripheral quantitative computed tomography can assess microstructural and mechanical properties of human distal tibial bone. J Bone Miner Res. 2010; 25: 746–756. [DOI] [PMC free article] [PubMed] [Google Scholar]
- 29. Macneil JA, Boyd SK. Accuracy of high‐resolution peripheral quantitative computed tomography for measurement of bone quality. Med Eng Phys. 2007; 29: 1096–1105. [DOI] [PubMed] [Google Scholar]
- 30. Laib A, Hildebrand T, Hauselmann HJ, Ruegsegger P. Ridge number density: a new parameter for in vivo bone structure analysis. Bone. 1997; 21: 541–546. [DOI] [PubMed] [Google Scholar]
- 31. Laib A, Ruegsegger P. Calibration of trabecular bone structure measurements of in vivo three‐dimensional peripheral quantitative computed tomography with 28‐microm‐resolution microcomputed tomography. Bone. 1999; 24: 35–39. [DOI] [PubMed] [Google Scholar]
- 32. Hildebrand T, Ruegsegger P. A new method for the model‐independent assessment of thickness in three‐dimensional images. J Microsc. 1997; 185: 67–75. [Google Scholar]
- 33. Parfitt AM, Mathews CH, Villanueva AR, Kleerekoper M, Frame B, Rao DS. Relationships between surface, volume, and thickness of iliac trabecular bone in aging and in osteoporosis. Implications for the microanatomic and cellular mechanisms of bone loss. J Clin Invest. 1983; 72: 1396–1409. [DOI] [PMC free article] [PubMed] [Google Scholar]
- 34. Guo XE, Goldstein SA. Is trabecular bone tissue different from cortical bone tissue? Forma. 1997; 12: 185–196. [Google Scholar]
- 35. Hollister SJ, Brennan JM, Kikuchi N. A homogenization sampling procedure for calculating trabecular bone effective stiffness and tissue level stress. J Biomech. 1994; 27: 433–444. [DOI] [PubMed] [Google Scholar]
- 36. Lang T, LeBlanc A, Evans H, Lu Y, Genant H, Yu A. Cortical and trabecular bone mineral loss from the spine and hip in long‐duration spaceflight. J Bone Miner Res. 2004; 19: 1006–1012. [DOI] [PubMed] [Google Scholar]
- 37. Lang TF, Keyak JH, Heitz MW, et al. Volumetric quantitative computed tomography of the proximal femur: precision and relation to bone strength. Bone. 1997; 21: 101–108. [DOI] [PubMed] [Google Scholar]
- 38. Crawford RP, Cann CE, Keaveny TM. Finite element models predict in vitro vertebral body compressive strength better than quantitative computed tomography. Bone. 2003; 33: 744–750. [DOI] [PubMed] [Google Scholar]
- 39. Keyak JH, Kaneko TS, Tehranzadeh J, Skinner HB. Predicting proximal femoral strength using structural engineering models. Clin Orthop Relat Res. 2005; 219–228. [DOI] [PubMed] [Google Scholar]
- 40. Kopperdahl DL, Morgan EF, Keaveny TM. Quantitative computed tomography estimates of the mechanical properties of human vertebral trabecular bone. J Orthop Res. 2002; 20: 801–805. [DOI] [PubMed] [Google Scholar]
- 41. Zar JH. Biostatistical Analysis 2nd ed Prentice Hall, Englewood Cliffs, NJ, USA: 1984. [Google Scholar]
- 42. MacNeil JA, Boyd SK. Load distribution and the predictive power of morphological indices in the distal radius and tibia by high resolution peripheral quantitative computed tomography. Bone. 2007; 41: 129–137. [DOI] [PubMed] [Google Scholar]
- 43. Sode M, Burghardt AJ, Kazakia GJ, Link TM, Majumdar S. Regional variations of gender‐specific and age‐related differences in trabecular bone structure of the distal radius and tibia. Bone. 2010; 25: 1652–1660. [DOI] [PMC free article] [PubMed] [Google Scholar]
- 44. Riggs BL, Melton LJ, Robb RA, et al. A population‐based assessment of rates of bone loss at multiple skeletal sites: evidence for substantial trabecular bone loss in young adult women and men. J Bone Miner Res. 2008; 23: 205–214. [DOI] [PMC free article] [PubMed] [Google Scholar]
- 45. Boonen S, Cheng XG, Nijs J, et al. Factors associated with cortical and trabecular bone loss as quantified by peripheral computed tomography (pQCT) at the ultradistal radius in aging women. Calcif Tissue Int. 1997; 60: 164–170. [DOI] [PubMed] [Google Scholar]