

Abstract
The polarized domains of myelinated axons are specifically organized to maximize the efficiency of saltatory conduction. The paranodal region is directly adjacent to the node of Ranvier and contains specialized septate-like junctions that provide adhesion between axons and glial cells and that pose a lateral diffusion barrier for nodal components. To complement and extend earlier studies on the peripheral nervous system, electron tomography was used to image paranodal regions from the central nervous system (CNS). Our three-dimensional reconstructions revealed short filamentous linkers running directly from the paranodal junctions to neurofilaments, micro-filaments and organelles within the axon. The intercellular spacing between axons and glia was measured to be 7.4 ± 0.6 nm, over twice the value previously reported in the literature (2.5–3 nm). Averaging of individual junctions revealed a bifurcated structure in the intercellular space that is consistent with a dimeric complex of cell adhesion molecules composing the paranodal junction. Taken together, these findings provide new insight into the structural organization of CNS paranodes and suggest that in addition to providing axo-glial adhesion, cytoskeletal linkage to the paranode may be required to maintain axonal domains and to regulate organelle transport in myelinated axons.
Keywords: Glial cells, Neurons, Cell adhesion molecules (CAMs), Electron microscopy, Central Nervous System, Paranode, Node of Ranvier
Introduction
Efficient propagation of action potentials along nerve fibers relies on axons from the central nervous system (CNS) and peripheral nervous system (PNS) being tightly wrapped with a specialized myelin sheath derived from oligodendrocytes and Schwann cells, respectively (Arroyo and Scherer 2000). The multiple layers composed of lipid- and protein-rich membranes serve to insulate the axons from the extracellular environment and thus to increase the speed with which electrical impulses travel along the axon. Specifically, the myelin sheath is periodically interrupted at the nodes of Ranvier, which produce action potentials that rapidly propagate to the next node by saltatory conduction.
Four distinct regions can be defined along the axonal membrane, each of which harbor a unique set of protein components: node, paranode, juxtaparanode, and internode (Arroyo and Scherer 2000; Peles and Salzer 2000; Salzer 2003). Voltage-gated Na+ channels are restricted to the node and appear to be held there by cytoskeletal scaffolding proteins ankyrinG and β-IV spectrin (Pan et al. 2006; Yang et al. 2007). In the axolemma, the cell-adhesion molecules (CAMs) Neurofascin(NF)186 and NrCAM are also tethered to this ankyrinG/β-IV spectrin scaffold via their cytoplasmic tails and contribute to node formation (Dzhashiashvili et al. 2007).
The paranode flanks both sides of the node and is characterized by septate-like junctions between the axon and the myelinating glial cells (Bhat 2003). These junctions serve to terminate the myelin sheath and are thought to be composed of a complex of three CAMs: Caspr (Paranodin) and contactin from the axolemma and NF155 from the glial cell membrane (Charles et al. 2002; Einheber et al. 1997; Menegoz et al. 1997). In addition to mediating intercellular adhesion and providing a diffusion barrier to ions, (Rosenbluth 2009), the paranodal junctions have recently been implicated in axonal transport and in maintaining the organization of the cytoskeleton. For example, ankyrinB, 4.1B, α-II spectrin, and actin are mislocalized in the Caspr knockout mouse, resulting in a swollen and disorganized cytoskeleton and axonal degeneration (Garcia-Fresco et al. 2006; Ogawa et al. 2006). Also, both these knockout mice and those carrying a β-IV spectrin mutation exhibit an abnormal accumulation of vesicles or mitochondria at the node (Lacas-Gervais et al. 2004; Uemoto et al. 2007; Yang et al. 2004) (Einheber et al. 2006).
Ultrastructural studies of peripheral nerves have employed conventional and three-dimensional high-voltage electron microscopy. Early studies showed filaments that appear to physically attach the junctions to the paranodal cytoskeletal network (Ichimura and Ellisman 1991). More recently, electron tomography of peripheral nerves revealed narrow cross-bridges running from the paranodal junctions to axoplasmic neurofilaments and glial cytoskeletal filaments. (Perkins et al. 2008). We have extended these studies to investigate the structure and cytoskeletal interactions of paranodal junctions in the CNS. We have used electron tomography to explorer the structure of paranodes in thin sections of the corpus callosum of adult mice. This imaging method combines numerous images of an object at a systematic series of tilt angles to generate a three-dimensional volume. The internal details of the volume can be visualized without the superposition that usually obscures fine cellular components like cytoskeletal filaments and intercellular junctions (for review, see Barcena and Koster 2009). With such tomograms, we show for the first time that septate-like junctions in paranodes from myelinated, CNS nerve fibers are physically anchored to cytoskeletal elements in the axoplasm (neurofilaments, microfilaments and microtubules) as well as to vesicles and mitochondria through short, filamentous linkers. We conclude that the association of paranodal junctions with the axonal cytoskeleton is likely to be important for strengthening the adhesion between axons and glia, for maintaining domain organization at the node of Ranvier, and for regulating organelle trafficking along the axon.
Materials and Methods
Sample Preparation
Adult mice (8–9 weeks) were anesthetized with pentobarbital and perfused transcardially with 4% paraformaldehyde and 2.5% glutaraldehyde in 0.1M phosphate buffer pH 7.4. The brains were removed and postfixed for 3 hours in the same fixative and then placed into phosphate buffer at 4°C. 80 μm thick coronal sections were cut on a vibratome and stored at 4°C in 0.1M phosphate buffer.
Samples were prepared for electron microscopy by high-pressure freezing and freeze substitution. To start, 1 mm diameter pieces of the corpus callosum were cut out of the fixed vibratome slices using a tissue punch. This tissue was placed between aluminum specimen carriers and the 100 μm-thick space was filled with 20% bovine serum albumin. Samples were rapidly frozen with a high pressure freezer (HPM 010, Bal-tec AG, Liechtenstein) and stored under liquid nitrogen. For freeze-substitution, specimen carriers containing frozen tissue were placed into anhydrous acetone containing 2% OsO4 and 0.1% uranyl acetate at −90°C for 24 hr. Using an automated freeze substitution machine (EM AFS, Leica Microsystems, Germany), the samples were slowly warmed (5°/hour) to −60°C and incubated for 12 hr, then to −30 °C for an additional 12 hr, to 0 °C for 4 hr, and finally to room temperature for 1 hr. Samples were rinsed in acetone and incubated in 70% acetone-30% LX112 epon resin (Ladd Research Industries, USA) for 30 min, followed by 50% acetone-50% epon for 1 hr and 30% acetone-70% epon for 1 hr. They were then incubated twice in 100% epon for 2 hr and then overnight before being polymerized at 60°C.
Thin sections (70 nm, Ultracut UCT microtome, Leica Microsystems, Germany) of longitudinally-oriented myelinated axons were collected on 200 mesh hexagonal copper grids (Ted Pella, Inc., USA) with a collodion support film (Electron Microscopy Sciences, USA). The sections were counterstained by incubation with 3% uranyl acetate in 30% methanol for 10 min, followed by washing in water, air drying, and incubation with Sato lead stain for 2 min (Sato 1968). A thin layer of carbon was evaporated on top of the sections to minimize beam-induced specimen shrinkage (Auto306 Evaporator, Edwards, UK).
Collection and Analysis of Tomograms
Samples were imaged with an electron microscope (CM200, Philips Electron Optics, Netherlands) equipped with a 1024 × 1024 CCD camera (MSC 1000, Gatan, USA) at 27,500 nominal magnification (corresponding to a 0.66 nm pixel size) and 1 μm defocus. Dual-axis tilt series were collected with a high-tilt tomography holder (Model 916, Gatan, USA) using a tilt range of ±70° and 2° increment (EM-Menu 3.0, TVIPS, Germany). To collect the tilt series about the second axis, the sample was removed from the microscope, rotated ~90° and reinserted. Fiducial-free alignment of projection images and calculation of 3-D volumes was carried out using Protomo software (Winkler and Taylor 2006) and creation of dual-axis volumes was done in IMOD (Kremer et al. 1996; Mastronarde 1997). Volumes were manually segmented in Amira (Mercury Computer Systems, San Diego, CA USA) after applying a 3×3×3 median filter. The intercellular cleft spacing and dimensions of paranodal junctions were measured in ImageJ by drawing a rectangle or square at well preserved areas of the membrane, integrating the enclosed region, and calculating the average width (Rasband, W.S., ImageJ, U. S. National Institutes of Health, Bethesda, Maryland, USA, http://rsb.info.nih.gov/ij/, 1997–2009).
Averaging of paranodal junctions was done by selecting 100 individual junctions from 8 dual-axis reconstructions. The junctions were selected from reconstructions that originated from the best-preserved tissue and was harvested from a single animal. The corresponding sub-volumes had dimensions of 40 × 40 × 80 pixels and were aligned and averaged using PEET (Particle Estimation for Electron Tomography) (Nicastro et al. 2006). This process involved iterative cycles of rotational and translational alignment in three dimensions; the initial reference was selected from the original group of subvolumes and was replaced with the global average of 67 sub-volumes with the highest cross-correlation coefficient after each round of refinement. After 7 rounds of refinement, 80 sub-volumes with the highest cross-correlation values were averaged to produce the final volume.
Results
Axon and glial cell cytoskeletons of the CNS associate with the paranodal septate-like junctions
To investigate the ultrastructure of the paranodal septate-like junctions and their putative associations with the cell cytoskeleton, we conducted electron tomography on thin sections (70 nm) of myelinated axons from the corpus callosum of adult wild-type mice. The corpus callosum was selected as the tissue source because coronal vibratome slices of the brain yields a parallel arrangement of myelinated axons that aided in finding paranodal regions cut in longitudinal orientation. To ensure optimal specimen preservation and specifically to minimize shrinkage and extraction that is associated with conventional preparation methods, we used high-pressure freezing and freeze substitution to preserve the tissue. These procedures result in smooth, continuous membranes and dense cytoplasm, indicating excellent preservation and lack of extraction. As expected, longitudinal sections through myelinated axons reveal loops projecting from the myelin sheath that wrap around the paranodal region of the axons (Fig 1A). In these regions, evenly spaced, transverse bands are seen connecting the glial membrane to the axolemma, which have been previously been identified as the paranodal junctions (Laatsch and Cowan 1966) (Fig. 1B, C).
Figure 1. Electron micrographs of myelinated axons from the corpus callosum.
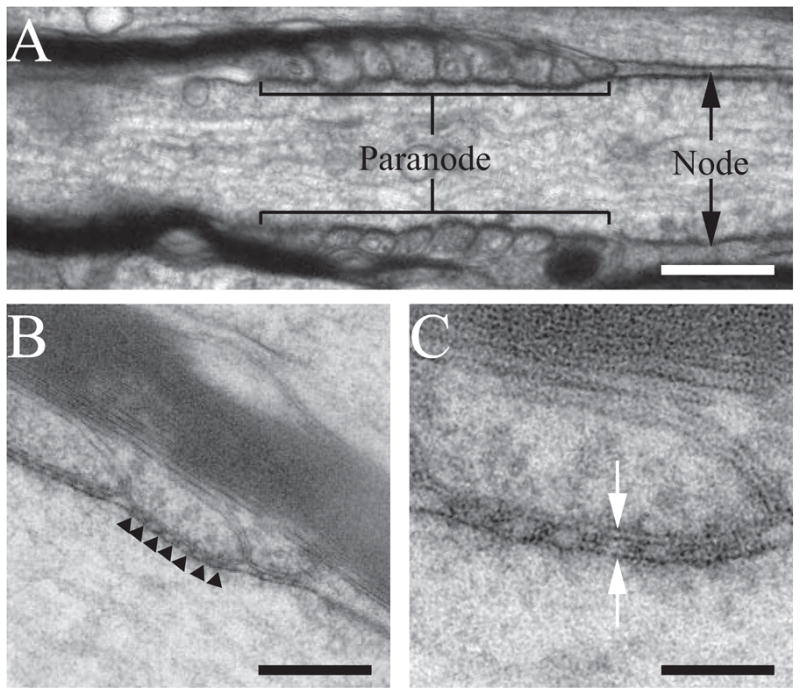
(A) Electron micrograph of a longitudinal section through a paranodal/nodal region of a myelinated axon in the corpus callosum of an adult wild type mouse. The paranodal and nodal regions are indicated. Samples were preserved using high-pressure freezing and freeze substitution. (B) Medium-magnification electron micrograph of two paranodal loops. Dense septate-like junctions are present between the glial membrane and axolemma (black arrowheads). (C) High-magnification electron micrograph of a single paranodal loop. Two leaflets of the lipid bilayer are clearly visible (white arrows), demonstrating fine sample preservation. Scale bars: A, 300 nm; B, 170 nm; C, 70 nm.
We collected twenty dual-axis tilt series of the paranodal region of myelinated axons from a total of seven thin sections containing comparable features and generated a three-dimensional tomographic reconstruction for each series. Examination of 0.66 nm thick slices from these reconstructions revealed thin filaments that linked paranodal junctions to various cytoplasmic components within the axons and glial cells. These thin filamentous linkers were indistinct in projection images due to superimposition of material throughout the 70-nm thickness of the section (e.g., compare Fig. 1C with 2A). In the tomographic sections, these linkers (light blue in Figs. 2–3) can also be seen attaching to 10-nm filaments, (yellow in Fig. 2), to 5-nm filaments (orange in Figs. 2 and 3) and to 25-nm filaments (green in Figs. 2 and 3), which are consistent with the size and shape of neurofilaments, microfilaments, and microtubules, respectively. Thus, these linkers appear to be part of an extensive, cytoskeletal meshwork that connects neurofilaments, microfilaments and microtubules to one another as well as to the transverse bands of the paranodal junctions, (Fig. 2B, G) (Supplementary movies 1 and 2).
Figure 2. Electron tomography of the paranode reveals distinct cytoskeletal linkers running from the dense septate-like junctions to the axon and glial cell cytoskeleton.

(A) 0.66 nm thick, tomographic slice from a reconstruction of one paranodal loop and the associated axon. Filamentous connections running between the paranodal septate-like junctions and the axon cytoskeleton are evident in the reconstruction (black arrows). Connections between the junctions and glial cytoplasm are also visible (white arrow-heads). A neurofilament (NF) and two microtubules (MT) are components of the axoplasm. (B) Surface-rendering of the volume depicted in (A). The glial membrane (red) invaginates into the glial cytoplasm (magenta). Thin and some-what regularly spaced connections (light blue) bridge the septate-like junctions (purple) to a 10 nm neurofilament (yellow) in the axoplasm. (C–D, F–G) Closeup views of (A) and (B) that show linkages between paranodal junctions and cytoskeletal network in the axon. (E, H) Closeup view of (A) and (B) that show a linkage between paranodal junctions and unstructured elements of the glial cytoplasm. Scale bars: A, B, 100 nm; C–H, 25 nm.
Figure 3. Cytoskeletal linkers bridge the paranodal septate-like junctions to microfilaments and microtubules in the axoplasm.

(A) 0.66 nm thick tomographic slice depicting thin (5–6 nm) microfilaments connecting to the dense junctions through short cytoskeletal linkers. (B–C) Surface-renderings of the volumes depicted in (A). For simplicity, glial and axonal membranes have been modeled to include any sublemmal densities (red). It is likely that the short cytoskeletal linkers (light blue) associate with sublemmal, axoplasmic densities and not directly with the membrane. Septate-like junctions (purple), microfilaments (orange), and vesicles (dark blue) are depicted in the surface reconstruction. (D) 0.66 nm thick tomographic slice depicting many microtubules running tangentially through the reconstruction. The one closest to the axolemma associates with the septate-like junctions through thin cytoplasmic linkers. (E–F) Surface-renderings of the volumes depicted in (D). Glial and axonal membranes (red), septate-like junctions (purple), cytoskeletal linkers (light blue), microtubules (green), neurofilaments (yellow), and vesicles (dark blue) are depicted in the surface reconstruction. Scale bars: Scale bars: A, B, 150 nm. C, 75 nm. D, E, 100 nm. F, 75 nm.
Portions of the glial cell cytoskeleton also associate with the transverse bands, though the network of connections is less extensive than in the axoplasm. In the particular cell shown in Fig. 2, these glial cell densities appear to link the transverse bands to an invaginated region of the glial membrane (Fig. 2E, H).
Paranodal septate-like junctions associate with membranous organelles in the axoplasm
We observed various membranous organelles within the paranodal region of the axon. Specifically, organelles in Fig 4A, D and G are in close proximity to the axolemma and, based on their appearance, they are consistent with transport vesicles, endoplasmic reticulum, vacuoles, and/or pre-lysosomal organelles. These organelles adopt circular and oval shapes, range in size from 30–100 nm in diameter, and are occasionally connected to the paranodal junctions via short filaments (Fig 4G–I, Supplementary movie 3). In addition, mitochondria with an electron-dense matrix were in close proximity to the axolemma and paranodal junctions which appeared to be linked through more diffuse, electron-dense material (Fig. 4J–L, Supplementary movie 4).
Figure 4. Septate-like junctions physically associate with membranous organelles in the axoplasm such as transport vesicles, smooth ER, and mitochondria.

(A, D, G, J) Gallery of 0.66 nm thick tomographic slices of various vesicular organelles at the paranode. (B, C, E, F, H, I, K, L) Surface renderings that correspond to the tomographic reconstructions. Vesicular structures vary in shape and size ranging from elongated shapes to circular and from 30 to 100 nm in diameter. (G–I) Cytoskeletal linkages (light blue) bridge the septate-like junctions (purple) to a vesicle (dark blue) (black arrows). Glial and axonal membranes, along with any sublemmal cytoplasmic densities are depicted in red. An elongated, dense mitochondrion is present with lipid bilayers of the double-membrane and cristae visible (dark blue) (J–L). Diffuse, axoplasmic material links the mitochondrion to the axolemma (black arrow). Scale bars: A, B, D, E, G, H, J, K, 120 nm. C, F, I, L, 60 nm.
Architecture and spatial arrangement of the paranodal junctions
To characterize the septate-like junctions that connect axons and glial cells at the paranode, we measured the center-to-center spacing and width of the transverse bands as well as the width of the intercellular cleft between the cells (Fig. 5). We found the transverse bands to be regularly arranged with an average center-to-center spacing of 31.0 ± 2.2 nm and an average width of 16.1 ± 3.0 nm. Of note, the average intercellular distance (measured between outer leaflets of the lipid bilayer) was 7.4 ± 0.6 nm.
Figure 5. Spatial dimensions of transverse bands that compose the paranodal junctions in the CNS.

(Left) Histogram of measurements collected from representative samples of well-preserved tissue. These values were consistent across multiple thin sections and tissue samples. All measurements were recorded from central slices of tomographic volumes. (Right) Representative examples demonstrating how measurements were collected. For center-to-center spacing and width of transverse bands, n = number of individual densities (measured from a total of 8 different reconstructions). For intercellular cleft, n = number of paranodal loops (measured from a total of 8 different reconstructions). To determine an accurate intercellular spacing, a rectangle that spanned 6–8 junctions was drawn between the outer leaflets of lipid bilayers and the area was used to calculate the average width. Scale bars: 50 nm.
In order to evaluate the 3D shape of individual septae, the 3-D volume was viewed from a direction normal to the membrane plane (compare Fig 6A to Fig. 6B, Supplementary movie 5). These images indicate that individual septae form a continuous belt running around the perimeter of the axon. To illustrate that the continuity of the septae normal to the plane of the section was not an artifact due to the limited number of views included in the tomogram (the so-called missing pyramid), Fig. 6C shows a comparable view of a vesicle within the axoplasm. The discrete border of this vesicle verifies that the dual-axis data collection scheme is able to resolve discrete features normal to the section plane.
Figure 6. Septate-like junctions are periodically arranged along the axon and form circumferential bands around the axolemma.

(A) Tomographic XY slice of a reconstruction showing periodic arrangement of septae between the glial membrane and axolemma. (B) Tomographic XZ slice of the area shown in (A). Junctions appear as a continuous strip of density throughout the volume. (C) XZ slice showing a vesicle (arrowhead). Elongation of features in the direction of the Z-axis is not significant, illustrating that elongation of junctions along Z is not an artifact of the tomographic reconstruction. Scale bars: A–C: 65 nm.
Arrangement of cell-adhesion molecules in intermembrane space
To elucidate the arrangement of the adhesion molecules within an individual septum, we calculated an averaged volume by extracting 100 subvolumes from the tomograms (each containing a single transverse band) (Fig 7A) and averaging them together after conducting rotational and translational alignment in three dimensions. As shown in Figure 7B, a central slice through the averaged volume reveals two major densities spanning the intercellular cleft (Supplementary movie 6). Density #1 continues past the plasma membrane and into the cytoplasmic side of the axon while Density #2 terminates at the extracellular face of the axolemma. Fig. 7C shows an isodensity surface of the entire averaged structure. As such, it represents an unbiased representation of the 3D shape of an individual septum. The red planes represent the membrane plane and were artificially placed in the voids of this structure.
Figure 7. Averaged subvolume of the transverse bands reveals bifurcated densities in the intermembrane space.

(A) Tomographic slice from a septate-like junction used for alignment averaging. Densities from individual sub-volumes have a high noise level. Scale bars: Left, 100 nm. Right, 7 nm.
(B) Central 0.66 nm slice through the averaged volume of the septate-like junction reveals a strong density #1 that continues into the axoplasm and a weaker density #2 on the left. Scale bars: 7 nm.
(C) (Left) Projection across the entire averaged tomographic volume. (Right) Isosurface-rendering of the averaged tomographic volume. Scale bars: 8 nm.
Discussion
Understanding the physical associations between the septate-like adhesive complex at the paranode and the underlying cytoskeletal network continues to be the focus of ongoing research (for review, see Susuki and Rasband 2008). In this study, we have used electron tomography to characterize the structure of paranodes from the CNS for the first time. This technique enhances the visibility of intracellular structures and we were thus able to show that the paranodal regions of myelinated axons are highly enriched in various cytoskeletal filaments and membranous organelles. Specifically, short linker filaments were seen connecting the regularly spaced septae of the paranodal junctions to microtubules, neurofilaments, microfilaments, and membranous organelles.
Role and Composition of Filamentous Linkers
Our observations generally support previous studies of sciatic nerve and spinal root axons from the PNS (Perkins et al. 2008). However, we observed some interesting differences between the systems. For the first time, we have revealed that in the CNS, membranous organelles such as mitochondria, transport vesicles and endoplasmic reticulum are tethered to the septate-like junctions through short filaments. In the PNS, linkers have only been described between cytoskeletal filaments and the junctions and are generally shorter, straighter and more homogeneous in appearance (Perkins et al. 2008). This suggests that filaments in the CNS are more flexible and that the septate-like junctions could play a role in regulating transport of vesicular cargoes along the axon. In particular, tethering via the short filaments could serve either to sequester specific membrane-protein components to the paranode or to guide these components through the dense cytoskeletal network within the narrower nerves of the CNS.
Spectrin is a logical candidate for the filamentous linkers observed in this study. Spectrin is a submembranous cytoskeletal scaffolding protein that is essential for membrane stability in many types of cells (for review see Bennett and Baines 2001). Spectrins are thin, flexible molecules composed of anti-parallel α and β chains that laterally associate to form heterodimers, which in turn assemble end-to-end to form tetramers (REF). There is an abundance of spectrin in the axon with ~80% located in the central axoplasm, and spectrin has been shown to physically associate with microtubules, neurofilaments, microfilaments, mitochondria, and endoplasmic reticulum (Glenney et al. 1982; Lasek et al. 1984; Zagon et al. 1986). Immunofluorescence has shown colocalization of spectrin with its binding partiners ankyrin and Band 4.1 specifically at the paranodal region. (REF) and immunoprecipitation suggests formation of a complex between actin, Band 4.1 and spectrin (REF).
An association between spectrin and the septate-like junctions is consistent with evidence for 4.1B binding to the cytoplasmic tail of Caspr (REF). Spectrin has distinct binding sites for Band 4.1 and for actin (REF) and could thus facilitate anchorage of these junctions to the actin cytoskeleton. The importance of 4.1B to the paranode was demonstrated by a recent study of mice lacking the 4.1B binding sequence in the cytoplasmic tail of Caspr, which failed to properly segregate juxtaparanodal K+ channels from the paranode. This result supports the idea that linking of septate-like junctions to the axonal cytoskeleton is indeed necessary for maintaining the domain organization of myelinated axons (Horresh et al. 2010). The precise supramolecular organization of these elements at the node of Ranvier Future studies will require further structural studies at higher resolution.
Axonal transport
Anterograde and retrograde transport of organelles along the microtubule network is an important and well studied phenomenon, which is necessitated by the large distances traversed by axons (Brown et al. 2005). Mitochondria display bidirectional movement with long pauses, thus giving rise to a wide range of average transport rates (Ligon and Steward 2000). This variable transport rate may reflect targeted delivery of mitochondria to regions of high metabolic demand (Hollenbeck and Saxton 2005). Keeping with this idea, the electron-dense mitochondrial matrix seen in many of our tomographic volumes may indicate an increased level of respiration in the cell along with a higher ATP content (Hackenbrock 1966). The diffuse densities bridging the paranodal junctions to mitochondria may represent the static tethers that have been hypothesized to tether mitochondria at the node (Hollenbeck and Saxton 2005) and which have been also described in a specialized pre-synaptic region of the calyx of Held (Rowland et al. 2000).
More discrete filamentous linkers were associated with endoplasmic reticulum and transport vesicles and the idea that they are composed of spectrin is consistent with its transport kinetics. Specifically, spectrin is the only protein transported with both major subcomponents of slow axonal transport (SCa and SCb) (Lasek et al. 1984) thus exhibiting transport kinetics similar to microfilaments, neurofilaments and microtubules (0.2–8.0 mm/day). In addition, a small amount of spectrin also associates with vesicular organelles and exhibits the much faster retrograde and anterograde transport kinetics of these cytoplasmic elements (50–100 mm/day) (Lasek et al. 1984; Levine and Willard 1981). Thus, the size, shape, ubiquitous nature and transport properties of spectrin are all consistent with our observations of filamentous linkers attached to a variety of organelles and cytoskeletal elements at the paranode.
Spatial Arrangement and Architecture of the Septate-like junctions
The average center-to-center spacing and width of the septate-like junctions of our samples were 31.0 ± 2.2 nm and 16.1 ± 3.0 nm respectively. These measurements agree well with previously published values of 30–40 nm (Laatsch and Cowan 1966) and 25–30 nm (Livingston et al. 1973; Schnapp et al. 1976) for the center-to-center distance and 10–15 nm (Elfvin 1961; Hirano and Dembitzer 1967; Laatsch and Cowan 1966), 14–19 nm (Dermietzel 1974), and 15 nm (Perkins et al. 2008) for the width. The mechanism for maintaining the regular spacing of these junctions is currently unknown, but it may depend on physical restraints imposed by the cytoskeletal linkers described above. The average intercellular distance between axons and the apposing glial cell was measured to be 7.4 ± 0.6 nm, which is more than twice the value previously reported in the literature (2.5–3 nm) (Dermietzel 1974; Livingston et al. 1973; Schnapp et al. 1976). This difference may reflect better sample preservation by the high-pressure freezing and freeze substitution methods used in this study, which generally minimize membrane collapse (McDonald and Auer 2006). Furthermore, measurements from tomographic slices are less susceptible to artifacts caused by an oblique angle of sectioning, which will reduce the apparent intercellular distance measured in the projection images used for the above-referenced studies. Interestingly, our measurement of the spacing is one-half of the intercellular spacing of invertebrate septate junctions (15–17 nm) (Lane and Swales 1982; Tepass et al. 2001).
We observed evenly-spaced belts of density when the paranodal loops are viewed from a direction normal to the plane of the membrane (Figure 6B). This observation is consistent with previous studies showing continuous rows of cell-adhesion molecules at the paranode (Dermietzel 1974; Hirano and Dembitzer 1982; Livingston et al. 1973; Rosenbluth 1976; Schnapp et al. 1976; Wiley and Ellisman 1980). This organization may be optimal for creating a strong intercellular adhesion as well as a physical barrier for diffusion of components across the axolemma. Averaging of tomographic sub-volumes revealed an asymmetric, bifurcated structure for the individual septum that composes the paranodal junction. A prominent sublemmal axoplasmic density may represent cytoplasmic domains of transmembrane proteins, or may represent axoplasmic proteins associated with the transverse bands (e.g. 4.1B). It is possible that filamentous linkers attach to this axoplasmic density, thus limiting the flexibility of one arm of the complex, thus producing stronger density on one side of the individual septum. The two resolved arms of the septum suggest a dimer of adhesion molecules, which is also consistent with the distribution of densities on the axolemmal side of the membrane in freeze-fracture studies (Wiley and Ellisman 1980). Plausible elements for this dimer are the Caspr/contactin complex and NF155. Although higher resolution or specific labeling of these components will be necessary to confirm these assignments. In the meantime, this tentative assignment suggests that the width of each transverse band is determined by the dimensions of these adhesion molecules and that these complexes associate to form a linear array that runs circumferentially around the axon. The narrow distance between the cell membranes (7.4 nm) suggests that these relatively long, multidomain proteins are folded up in the extracellular space, in contrast to the extended structure adopted by the cadherins in adhesive junctions (He et al. 2003).
Other major classes of adhesive junctions, such as desmosomes and adherens junctions, derive their mechanical strength from coupling the relevant transmembrane proteins to the cytoskeleton via a dense protein scaffold at the cytoplasmic surface of the membrane (Getsios et al. 2004). Although axons are not required to resist high levels of shear force, it may be desirable to anchor the membrane to cytoskeletal elements in order to maintain, for example, the width of the node and the distance between nodes along the axon. Indeed, knockout of Caspr or glial ceramide galactosyltransferase lead to dramatic disruption of the cytoskeleton at the node and consequent swelling of the axons in this region (Einheber et al. 2006; Garcia-Fresco et al. 2006).
Conclusion
The observations presented in this study provide new insight into the ultrastructure of neuronal cells from the CNS and suggest that linkage of the septate-like junctions to the cytoskeleton are important for the maintenance of cell-cell adhesion, conduction of organelle transport, and organization of the paranode. These observations may be of particular clinical importance for human demyelinating diseases such as multiple sclerosis (MS); MS is characterized by inflammation of the brain, destruction of myelin and oligodendrocytes, and axonal degeneration (Compston and Coles 2002) and it is notable that Caspr and NF155 are mislocalized near these lesions (Howell et al. 2006; Wolswijk and Balesar 2003). Thus, the stability of the membrane-cytoskeletal link at the paranode may be an early determinant of axonal integrity by being responsible for the initial organization and segregation of the various domains composing the node of Ranvier.
Supplementary Material
The following movies display slices through the tomographic reconstruction and the corresponding segmented volumes.
SM1: Axon cytoskeleton and the associations with the paranodal septate-like junctions
SM2: Microfilaments connecting to the junctions
SM3: Axoplasmic vesicles connecting to the junctions
SM4: Mitochondria and the paranodal axolemma
SM5: Rotating the paranodal loop 90 degrees to view the septate-like junctions from a view normal to the plane of the membrane,
SM6: Isosurface of the volume generated from subvolume averaging of individual junctions
Acknowledgments
We would like to thank Jeff Ault of the Wadsworth Center Laboratory of the New York State Department of Health for use their high-pressure freezer. We would like to thank Dr. Teresa A. Milner (Weill Cornell Medical College) for technical assistance. Support was provided by NIH Grant R01NS043474 to J.L.S. and F31NS056467 to A.N.
References
- Arroyo EJ, Scherer SS. On the molecular architecture of myelinated fibers. Histochem Cell Biol. 2000;113(1):1–18. doi: 10.1007/s004180050001. [DOI] [PubMed] [Google Scholar]
- Barcena M, Koster AJ. Electron tomography in life science. Semin Cell Dev Biol. 2009;20(8):920–930. doi: 10.1016/j.semcdb.2009.07.008. [DOI] [PMC free article] [PubMed] [Google Scholar]
- Bennett V, Baines AJ. Spectrin and ankyrin-based pathways: metazoan inventions for integrating cells into tissues. Physiol Rev. 2001;81(3):1353–1392. doi: 10.1152/physrev.2001.81.3.1353. [DOI] [PubMed] [Google Scholar]
- Bhat MA. Molecular organization of axo-glial junctions. Curr Opin Neurobiol. 2003;13(5):552–559. doi: 10.1016/j.conb.2003.09.004. [DOI] [PubMed] [Google Scholar]
- Brown A, Wang L, Jung P. Stochastic simulation of neurofilament transport in axons: the “stop-and-go” hypothesis. Mol Biol Cell. 2005;16(9):4243–4255. doi: 10.1091/mbc.E05-02-0141. [DOI] [PMC free article] [PubMed] [Google Scholar]
- Charles P, Tait S, Faivre-Sarrailh C, Barbin G, Gunn-Moore F, Denisenko-Nehrbass N, Guennoc AM, Girault JA, Brophy PJ, Lubetzki C. Neurofascin is a glial receptor for the paranodin/Caspr-contactin axonal complex at the axoglial junction. Curr Biol. 2002;12(3):217–220. doi: 10.1016/s0960-9822(01)00680-7. [DOI] [PubMed] [Google Scholar]
- Compston A, Coles A. Multiple sclerosis. Lancet. 2002;359(9313):1221–1231. doi: 10.1016/S0140-6736(02)08220-X. [DOI] [PubMed] [Google Scholar]
- Dermietzel R. Junctions in the central nervous system of the cat. II. A contribution to the tertiary structure of the axonal-glial junctions in the paranodal region of the node of Ranvier. Cell Tissue Res. 1974;148(4):577–586. doi: 10.1007/BF00221941. [DOI] [PubMed] [Google Scholar]
- Dzhashiashvili Y, Zhang Y, Galinska J, Lam I, Grumet M, Salzer JL. Nodes of Ranvier and axon initial segments are ankyrin G-dependent domains that assemble by distinct mechanisms. J Cell Biol. 2007;177(5):857–870. doi: 10.1083/jcb.200612012. [DOI] [PMC free article] [PubMed] [Google Scholar]
- Einheber S, Bhat MA, Salzer JL. Disrupted Axo-Glial Junctions Result in Accumulation of Abnormal Mitochondria at Nodes of Ranvier. Neuron Glia Biol. 2006;2(3):165–174. doi: 10.1017/S1740925X06000275. [DOI] [PMC free article] [PubMed] [Google Scholar]
- Einheber S, Zanazzi G, Ching W, Scherer S, Milner TA, Peles E, Salzer JL. The axonal membrane protein Caspr, a homologue of neurexin IV, is a component of the septate-like paranodal junctions that assemble during myelination. J Cell Biol. 1997;139(6):1495–1506. doi: 10.1083/jcb.139.6.1495. [DOI] [PMC free article] [PubMed] [Google Scholar]
- Elfvin LG. The ultrastructure of the nodes of Ranvier in cat sympathetic nerve fibers. J Ultrastruct Res. 1961;5:374–387. doi: 10.1016/s0022-5320(61)80014-2. [DOI] [PubMed] [Google Scholar]
- Garcia-Fresco GP, Sousa AD, Pillai AM, Moy SS, Crawley JN, Tessarollo L, Dupree JL, Bhat M. Disruption of axo-glial junctions causes cytoskeletal disorganization and degeneration of Purkinje neuron axons. Proc Natl Acad Sci U S A. 2006;103(13):5137–5142. doi: 10.1073/pnas.0601082103. [DOI] [PMC free article] [PubMed] [Google Scholar]
- Getsios S, Huen AC, Green KJ. Working out the strength and flexibility of desmosomes. Nat Rev Mol Cell Biol. 2004;5(4):271–281. doi: 10.1038/nrm1356. [DOI] [PubMed] [Google Scholar]
- Glenney JR, Jr, Glenney P, Weber K. F-actin-binding and cross-linking properties of porcine brain fodrin, a spectrin-related molecule. J Biol Chem. 1982;257(16):9781–9787. [PubMed] [Google Scholar]
- Hackenbrock CR. Ultrastructural bases for metabolically linked mechanical activity in mitochondria. I. Reversible ultrastructural changes with change in metabolic steady state in isolated liver mitochondria. J Cell Biol. 1966;30(2):269–297. doi: 10.1083/jcb.30.2.269. [DOI] [PMC free article] [PubMed] [Google Scholar]
- He W, Cowin P, Stokes DL. Untangling desmosomal knots with electron tomography. Science. 2003;302:109–113. doi: 10.1126/science.1086957. [DOI] [PubMed] [Google Scholar]
- Hirano A, Dembitzer HM. A structural analysis of the myelin sheath in the central nervous system. J Cell Biol. 1967;34(2):555–567. doi: 10.1083/jcb.34.2.555. [DOI] [PMC free article] [PubMed] [Google Scholar]
- Hirano A, Dembitzer HM. Further studies on the transverse bands. J Neurocytol. 1982;11:861–866. doi: 10.1007/BF01148304. [DOI] [PubMed] [Google Scholar]
- Hollenbeck PJ, Saxton WM. The axonal transport of mitochondria. J Cell Sci. 2005;118(Pt 23):5411–5419. doi: 10.1242/jcs.02745. [DOI] [PMC free article] [PubMed] [Google Scholar]
- Horresh I, Bar V, Kissil JL, Peles E. Organization of myelinated axons by Caspr and Caspr2 requires the cytoskeletal adapter protein 4.1B. J Neurosci. 2010;30(7):2480–2489. doi: 10.1523/JNEUROSCI.5225-09.2010. [DOI] [PMC free article] [PubMed] [Google Scholar]
- Howell OW, Palser A, Polito A, Melrose S, Zonta B, Scheiermann C, Vora AJ, Brophy PJ, Reynolds R. Disruption of neurofascin localization reveals early changes preceding demyelination and remyelination in multiple sclerosis. Brain. 2006;129(Pt 12):3173–3185. doi: 10.1093/brain/awl290. [DOI] [PubMed] [Google Scholar]
- Ichimura T, Ellisman MH. Three-dimensional fine structure of cytoskeletal-membrane interactions at nodes of Ranvier. J Neurocytol. 1991;20:667–681. doi: 10.1007/BF01187068. [DOI] [PubMed] [Google Scholar]
- Kremer JR, Mastronarde DN, McIntosh JR. Computer visualization of three-dimensional image data using IMOD. J Struct Biol. 1996;116(1):71–76. doi: 10.1006/jsbi.1996.0013. [DOI] [PubMed] [Google Scholar]
- Laatsch RH, Cowan WM. A structural specialization at nodes of Ranvier in the central nervous system. Nature. 1966;210(5037):757–758. doi: 10.1038/210757a0. [DOI] [PubMed] [Google Scholar]
- Lacas-Gervais S, Guo J, Strenzke N, Scarfone E, Kolpe M, Jahkel M, De Camilli P, Moser T, Rasband MN, Solimena M. BetaIVSigma1 spectrin stabilizes the nodes of Ranvier and axon initial segments. J Cell Biol. 2004;166(7):983–990. doi: 10.1083/jcb.200408007. [DOI] [PMC free article] [PubMed] [Google Scholar]
- Lane NJ, Swales LS. Stages in the assembly of pleated and smooth septate junctions in developing insect embryos. J Cell Sci. 1982;56:245–262. doi: 10.1242/jcs.56.1.245. [DOI] [PubMed] [Google Scholar]
- Lasek RJ, Garner JA, Brady ST. Axonal transport of the cytoplasmic matrix. J Cell Biol. 1984;99(1 Pt 2):212s–221s. doi: 10.1083/jcb.99.1.212s. [DOI] [PMC free article] [PubMed] [Google Scholar]
- Levine J, Willard M. Fodrin: axonally transported polypeptides associated with the internal periphery of many cells. J Cell Biol. 1981;90(3):631–642. doi: 10.1083/jcb.90.3.631. [DOI] [PMC free article] [PubMed] [Google Scholar]
- Ligon LA, Steward O. Movement of mitochondria in the axons and dendrites of cultured hippocampal neurons. J Comp Neurol. 2000;427(3):340–350. doi: 10.1002/1096-9861(20001120)427:3<340::aid-cne2>3.0.co;2-y. [DOI] [PubMed] [Google Scholar]
- Livingston RB, Pfenniger K, Moor H, Akert K. Specialized paranodal and interparanodal glial-axonal junctions in the peripheral and central nervous system: a freeze-etching study. Brain Res. 1973;58(1):1–24. doi: 10.1016/0006-8993(73)90820-2. [DOI] [PubMed] [Google Scholar]
- Mastronarde DN. Dual-axis tomography: an approach with alignment methods that preserve resolution. J Struct Biol. 1997;120(3):343–352. doi: 10.1006/jsbi.1997.3919. [DOI] [PubMed] [Google Scholar]
- McDonald KL, Auer M. High-pressure freezing, cellular tomography, and structural cell biology. Biotechniques. 2006;41(2):137, 139–141. doi: 10.2144/000112226. passim. [DOI] [PubMed] [Google Scholar]
- Menegoz M, Gaspar P, Le Bert M, Galvez T, Burgaya F, Palfrey C, Ezan P, Arnos F, Girault JA. Paranodin, a glycoprotein of neuronal paranodal membranes. Neuron. 1997;19(2):319–331. doi: 10.1016/s0896-6273(00)80942-3. [DOI] [PubMed] [Google Scholar]
- Nicastro D, Schwartz C, Pierson J, Gaudette R, Porter ME, McIntosh JR. The molecular architecture of axonemes revealed by cryoelectron tomography. Science. 2006;313(5789):944–948. doi: 10.1126/science.1128618. [DOI] [PubMed] [Google Scholar]
- Ogawa Y, Schafer DP, Horresh I, Bar V, Hales K, Yang Y, Susuki K, Peles E, Stankewich MC, Rasband MN. Spectrins and ankyrinB constitute a specialized paranodal cytoskeleton. J Neurosci. 2006;26(19):5230–5239. doi: 10.1523/JNEUROSCI.0425-06.2006. [DOI] [PMC free article] [PubMed] [Google Scholar]
- Pan Z, Kao T, Horvath Z, Lemos J, Sul JY, Cranstoun SD, Bennett V, Scherer SS, Cooper EC. A common ankyrin-G-based mechanism retains KCNQ and NaV channels at electrically active domains of the axon. J Neurosci. 2006;26(10):2599–2613. doi: 10.1523/JNEUROSCI.4314-05.2006. [DOI] [PMC free article] [PubMed] [Google Scholar]
- Peles E, Salzer JL. Molecular domains of myelinated axons. Curr Opin Neurobiol. 2000;10(5):558–565. doi: 10.1016/s0959-4388(00)00122-7. [DOI] [PubMed] [Google Scholar]
- Perkins GA, Sosinsky GE, Ghassemzadeh S, Perez A, Jones Y, Ellisman MH. Electron tomographic analysis of cytoskeletal cross-bridges in the paranodal region of the node of Ranvier in peripheral nerves. J Struct Biol. 2008;161(3):469–480. doi: 10.1016/j.jsb.2007.10.005. [DOI] [PMC free article] [PubMed] [Google Scholar]
- Rosenbluth J. Intramembranous particle distribution at the node of Ranvier and adjacent axolemma in myelinated axons of the frog brain. J Neurocytol. 1976;5(6):731–745. doi: 10.1007/BF01181584. [DOI] [PubMed] [Google Scholar]
- Rosenbluth J. Multiple functions of the paranodal junction of myelinated nerve fibers. J Neurosci Res. 2009;87(15):3250–3258. doi: 10.1002/jnr.22013. [DOI] [PubMed] [Google Scholar]
- Rowland KC, Irby NK, Spirou GA. Specialized synapse-associated structures within the calyx of Held. J Neurosci. 2000;20(24):9135–9144. doi: 10.1523/JNEUROSCI.20-24-09135.2000. [DOI] [PMC free article] [PubMed] [Google Scholar]
- Salzer JL. Polarized domains of myelinated axons. Neuron. 2003;40(2):297–318. doi: 10.1016/s0896-6273(03)00628-7. [DOI] [PubMed] [Google Scholar]
- Sato T. A modified method for lead staining of thin sections. J Electron Microsc. 1968;17(2):158–159. [PubMed] [Google Scholar]
- Schnapp B, Peracchia C, Mugnaini E. The paranodal axo-glial junction in the central nervous system studied with thin sections and freeze-fracture. Neuroscience. 1976;1(3):181–190. doi: 10.1016/0306-4522(76)90075-0. [DOI] [PubMed] [Google Scholar]
- Susuki K, Rasband MN. Spectrin and ankyrin-based cytoskeletons at polarized domains in myelinated axons. Exp Biol Med (Maywood) 2008;233(4):394–400. doi: 10.3181/0709-MR-243. [DOI] [PubMed] [Google Scholar]
- Tepass U, Tanentzapf G, Ward R, Fehon R. Epithelial cell polarity and cell junctions in Drosophila. Annu Rev Genet. 2001;35:747–784. doi: 10.1146/annurev.genet.35.102401.091415. [DOI] [PubMed] [Google Scholar]
- Uemoto Y, Suzuki S, Terada N, Ohno N, Ohno S, Yamanaka S, Komada M. Specific role of the truncated betaIV-spectrin Sigma6 in sodium channel clustering at axon initial segments and nodes of ranvier. J Biol Chem. 2007;282(9):6548–6555. doi: 10.1074/jbc.M609223200. [DOI] [PubMed] [Google Scholar]
- Wiley CA, Ellisman MH. Rows of dimeric-particles within the axolemma and juxtaposed particles within the glia, incorporated into a new model for the paranodal glial-axonal junction at the node of Ranvier. J Cell Biol. 1980;84:261–280. doi: 10.1083/jcb.84.2.261. [DOI] [PMC free article] [PubMed] [Google Scholar]
- Winkler H, Taylor KA. Accurate marker-free alignment with simultaneous geometry determination and reconstruction of tilt series in electron tomography. Ultramicroscopy. 2006;106:240–254. doi: 10.1016/j.ultramic.2005.07.007. [DOI] [PubMed] [Google Scholar]
- Wolswijk G, Balesar R. Changes in the expression and localization of the paranodal protein Caspr on axons in chronic multiple sclerosis. Brain. 2003;126(Pt 7):1638–1649. doi: 10.1093/brain/awg151. [DOI] [PubMed] [Google Scholar]
- Yang Y, Lacas-Gervais S, Morest DK, Solimena M, Rasband MN. BetaIV spectrins are essential for membrane stability and the molecular organization of nodes of Ranvier. J Neurosci. 2004;24(33):7230–7240. doi: 10.1523/JNEUROSCI.2125-04.2004. [DOI] [PMC free article] [PubMed] [Google Scholar]
- Yang Y, Ogawa Y, Hedstrom KL, Rasband MN. betaIV spectrin is recruited to axon initial segments and nodes of Ranvier by ankyrinG. J Cell Biol. 2007;176(4):509–519. doi: 10.1083/jcb.200610128. [DOI] [PMC free article] [PubMed] [Google Scholar]
- Zagon IS, Higbee R, Riederer BM, Goodman SR. Spectrin subtypes in mammalian brain: an immunoelectron microscopic study. J Neurosci. 1986;6(10):2977–2986. doi: 10.1523/JNEUROSCI.06-10-02977.1986. [DOI] [PMC free article] [PubMed] [Google Scholar]
Associated Data
This section collects any data citations, data availability statements, or supplementary materials included in this article.
Supplementary Materials
The following movies display slices through the tomographic reconstruction and the corresponding segmented volumes.
SM1: Axon cytoskeleton and the associations with the paranodal septate-like junctions
SM2: Microfilaments connecting to the junctions
SM3: Axoplasmic vesicles connecting to the junctions
SM4: Mitochondria and the paranodal axolemma
SM5: Rotating the paranodal loop 90 degrees to view the septate-like junctions from a view normal to the plane of the membrane,
SM6: Isosurface of the volume generated from subvolume averaging of individual junctions