Abstract
Chemerin is an adipocyte-secreted protein that regulates adipogenesis and the metabolic function of mature adipocytes via activation of chemokine-like receptor 1 (CMKLR1). Herein we report the interaction of peroxisome proliferator-activated receptor γ (PPARγ) and chemerin in the context of adipogenesis. Knockdown of chemerin or CMKLR1 expression or antibody neutralization of secreted chemerin protein arrested adipogenic clonal expansion of bone marrow mesenchymal stem cells (BMSCs) by inducing a loss of G2/M cyclins (cyclin A2/B2) but not the G1/S cyclin D2. Forced expression of PPARγ in BMSCs did not completely rescue this loss of clonal expansion and adipogenesis following chemerin or CMKLR1 knockdown. However, forced expression and/or activation of PPARγ in BMSCs as well as non-adipogenic cell types such as NIH-3T3 embryonic fibroblasts and MCA38 colon carcinoma cells significantly induced chemerin expression and secretion. Sequence analysis revealed a putative PPARγ response element (PPRE) sequence within the chemerin promoter. This PPRE was able to confer PPARγ responsiveness on a heterologous promoter, and mutation of this sequence abolished activation of the chemerin promoter by PPARγ. Chromatin immunoprecipitation confirmed the direct association of PPARγ with this PPRE. Treatment of mice with rosiglitazone elevated chemerin mRNA levels in adipose tissue and bone marrow coincident with an increase in circulating chemerin levels. Together, these findings support a fundamental role for chemerin/CMKLR1 signaling in clonal expansion during adipocyte differentiation as well as a role for PPARγ in regulating chemerin expression.
Keywords: Adipocyte, Adipose Tissue, Metabolism, Obesity, PPAR, Stem Cell, CMKLR1, ChemR23, Adipokine, Chemerin
Introduction
Peroxisome proliferator-activated receptor γ (PPARγ)3 is a ligand-activated transcription factor belonging to the nuclear hormone receptor gene superfamily (1, 2). This nuclear receptor is generally considered as a master regulator of adipogenesis as no other single factor is known to induce adipocyte differentiation in the absence of PPARγ (1–4). PPARγ has also been implicated in the regulation of numerous genes in the mature adipocyte, including those encoding adipocyte-derived signaling proteins (adipokines), which have a variety of hormone-like actions to regulate diverse physiological processes (5–9). Altered synthesis and secretion of adipokines have been implicated as a factor contributing to an increased risk for the development of a number of obesity-related comorbidities, including type 2 diabetes, inflammation, and cardiovascular disease (10). For example, adiponectin is a key adipokine with anti-inflammatory, antiatherogenic, and insulin-sensitizing properties (11, 12). Circulating adiponectin levels are commonly decreased with obesity and insulin resistance (11, 13, 14). PPARγ is a positive regulator of adiponectin gene expression, and promotion of adiponectin synthesis and secretion by PPARγ agonists such as thiazolidinediones is believed to be an important aspect of the clinical benefit of this class of insulin-sensitizing drugs (5).
Chemerin is a secreted protein that is most highly expressed in adipose tissue and liver (15–17). Most evidence indicates that chemerin is secreted as 18-kDa prochemerin, an inactive precursor protein that is subsequently activated by proteolytic cleavage of 6 amino acids from the C-terminal end. Early studies established that chemerin has proinflammatory chemoattractant properties elicited through interaction with the G protein-coupled receptor chemokine-like receptor 1 (CMKLR1) (16, 18). Chemerin has also been identified as an adipokine that regulates adipogenesis and adipocyte metabolism (15). Chemerin synthesis and secretion increase dramatically with adipocyte differentiation, and chemerin functions in an autocrine/paracrine fashion to promote adipogenesis through activation of CMKLR1 (15, 19). Adipose tissue has the ability to increase in mass through the expansion of both adipocyte size (hypertrophy) and number (hyperplasia) (20). Experimental evidence indicates that at least 10% of total body adipocytes are regenerated every year throughout adult life from precursor cell types that are capable of replication and differentiation (20, 21). Thus, mechanisms regulating the formation of adipocytes from precursor cells, including chemerin/CMKLR1 signaling, may contribute to the expansion of adipose tissue in obese individuals. Beyond this, circulating levels of chemerin are elevated in obesity and correlate with markers of inflammation and metabolic syndrome (15, 22–29). Thus, altered chemerin secretion may be of pathological relevance to various disorders associated with adipose dysfunction, including obesity, dyslipidemia, diabetes, inflammation, insulin resistance, and atherosclerosis (22–24, 26, 27, 29–33). Moreover, increased local chemerin levels in adipose tissue may directly contribute to the inflammation and metabolic dysfunction of this tissue that commonly occur in the obese (34, 35). Therefore, an increased understanding of factors that regulate chemerin expression will provide a better appreciation of the pathogenic mechanisms underlying obesity and associated comorbidities as well as the possibility of new therapeutic approaches to treat these disorders. In the present study, we examined the association between PPARγ and chemerin signaling throughout different phases of adipogenesis. Using various complementary models and experimental approaches, we provide evidence for functional interactions between PPARγ and chemerin/CMKLR1 signaling in both an adipogenic and non-adipogenic context.
EXPERIMENTAL PROCEDURES
Animals
All experiments were approved by the Dalhousie University Committee on Laboratory Animals and were performed according to the guidelines of the Canadian Council on Animal Care. The mice (C57BL/6J; 8–10 weeks of age) had free access to a standard rodent chow and water and were maintained at an ambient temperature of 20–22 °C, a relative humidity of 18–22%, and a 12-h light/dark cycle. Mice were treated with rosiglitazone (3 mg/kg, intraperitoneal; Cayman Chemical Co.) once daily for 5 days. Three hours after the final injection of rosiglitazone or the vehicle (DMSO) control, the animals were euthanized with pentobarbital (90 mg/kg, intraperitoneal), and blood samples were immediately collected by cardiac puncture. Unless otherwise noted, tissues were collected and snap frozen for mRNA and protein expression analysis.
Adipose Tissue Fractionation
Freshly isolated inguinal (subcutaneous) fat pads were minced using scissors to a homogeneous consistency in a total volume of 2 ml of HEPES buffer. The minced tissue was incubated with 2500 units of collagenase I (Sigma-Aldrich) for 60 min at 37 °C in a 5% CO2 incubator with intermittent pipetting. The resulting suspension was added to 30 ml of DMEM/F-12 and passed through a 100-μm mesh filter to remove undigested tissue. The filtrate was centrifuged (50 × g, 5 min), and the adipocyte fraction that collected as a cloudy white layer on the top was carefully removed with a pipette and transferred to a new tube for RNA isolation. The remaining supernatant beneath the adipocyte layer was transferred to a sterile tube and centrifuged (200 × g, 10 min). The resulting pellet was resuspended in DMEM/F-12, red blood cells were lysed using RBC lysis buffer, and the resulting cell suspension was filtered through a sterile 20-μm mesh filter. The final filtrate was centrifuged (200 × g, 10 min), and the pellet was used for stromal vascular fraction RNA isolation.
Generation and Transduction of Adenovirus
For chemerin (NM_027852), CMKLR1 (NM_008153), or PPARγ (NM_011146) overexpression, a cDNA encoding the complete murine coding sequence of the respective gene was synthesized by RT-PCR using mRNA prepared from mouse adipose tissue as a template and the primers given in supplemental Table S1 (restriction sites are underlined). The cDNA product was inserted directionally using the restriction sites into the pENTR4 entry vector (Invitrogen). For knockdown of gene expression, shRNA vectors were constructed using the pENT/U6 entry vector (Invitrogen) as described previously (19). The target sequences used to achieve knockdown of the respective mRNAs are given in supplemental Table S1. A loop sequence of CGAA was used for generating all the shRNAs. The entry vectors for knockdown or overexpression of target genes were recombined with the pAD/BLOCK-IT-DEST vector or pAD/CMV/V5-DEST vector, respectively. HEK-293A cells were transfected with positive adenoviral clones (pAD-chemerin-shRNA, pAD-CMKLR1-shRNA, pAD-PPARγ-shRNA, pAD-CMV-chemerin, pAD-CMV-CMKLR1, and pAD-CMV-PPARγ) to generate crude viral lysates that were subsequently used to produce amplified stocks by transduction of large scale HEK-293A cultures. A ViraBind Adenovirus Purification kit (Cell Biolabs, Inc., San Diego, CA) was used to purify the amplified viral lysates, and the QuickTiter Adenovirus Titer ELISA kit (Cell Biolabs, Inc.) was used to determine the titers according to the manufacturer's instructions. For all cell types, cells were seeded at a density of 1.5 × 10⁴ cells/cm2 in 12-well plates with a minimum period of 12 h before initiating transduction. For knockdown or overexpression of target sequences, viral transduction was carried out at an optimal dose of 20 multiplicity of infection (viruses/cell) in 0.5 ml of transduction medium (serum-free α-minimum Eagle's medium containing 6 μg/ml Polybrene). For the rescue experiments, cells were transduced with each virus at a multiplicity of infection of 10. After 24 h, the transduction medium was replaced with complete medium, and the cells were allowed to grow for an additional 24 h prior to initiating further experimentation.
Induction of Adipogenic Differentiation
Isolation, culture, and adipocyte differentiation of BMSCs was achieved as described previously (19). For analysis of adipogenesis, the cells were fixed in 4% paraformaldehyde and then stained using a filtered solution of 0.3% oil red O in 60% isopropanol for 15 min. Microscopy images were taken using an inverted light microscope. The lipid droplets were observed as red-stained droplets within the cells, and the amount of stain in each well was quantified after extraction in isopropanol and measuring the absorbance at 520 nm. In some experiments, chemerin activity was neutralized as described previously (26) by adding an anti-chemerin antibody (catalogue number AF2325, R&D Systems Inc., Minneapolis, MN) to the samples of media at a final concentration of 100 μg/ml. Goat IgG (R&D Systems Inc.) was used as a control in all the experiments using the chemerin-neutralizing antibody.
Thymidine Incorporation Assay
Thymidine incorporation assays were performed as described previously (19) using [methyl-3H]thymidine (Amersham Biosciences) at a final concentration of 1 μCi/ml and a pulse time of 15 min.
Gene Expression Analysis
Total RNA was isolated from frozen tissue samples using TRIzol® reagent (Invitrogen) and from cultured cells using an RNeasy Plus minikit (Qiagen) according to the respective manufacturer's procedures. Reverse transcription and quantitative PCR detection of genes were performed as described previously (15, 19, 26). The Ct values for cyclophilin A were used to normalize the expression level of the gene of interest using the ΔΔCt method (36). Exon-spanning primers were designed using the PrimerBank web application and are listed in supplemental Table S1.
Analysis of Bioactive Chemerin
A cell-based Tango assay for CMKLR1 activation was used as described previously (26) to determine the apparent concentrations of biologically active chemerin in mouse serum and plasma samples as well as supernatants from cultured cells.
Immunoblotting
For cell lysate preparation, medium was aspirated, and the cells were washed with ice-cold PBS followed by incubation for 15 min in lysis buffer (10 mm HEPES, pH 7.4, 200 mm NaCl, 2.5 mm MgCl2, 2 mm CaCl2, 0.1% Triton X-100) containing the protease inhibitor mixture (1:100). The cells were scraped and transferred to centrifuge tubes for further incubation on ice for 30 min. The final cell lysates were cleared by centrifugation for 10 min at 4 °C. Tissue culture medium was collected for the assessment of the amount of chemerin and adiponectin protein secreted into the medium during a period of 24 h. The protein concentrations were determined with the Bio-Rad D/C protein assay. Equal amounts (20 μg of total protein from the cell lysates or 20 μl of tissue culture medium) were separated by 15% sodium dodecyl sulfate-polyacrylamide gel electrophoresis and blotted onto nitrocellulose membranes. Immunostaining of the blots was performed using goat anti-chemerin (1:1000) (catalogue number AF2325, R&D Systems) or mouse anti-adiponectin (1:5000) (catalogue number MAB3604, Chemicon), mouse anti-cyclin A2 (1:1000) (catalogue number AF5999, R&D Systems), mouse anti-cyclin B2 (1:1000) (catalogue number AF6004, R&D Systems), mouse anti-cyclin D2 (1:1000) (catalogue number AF4196, R&D Systems), mouse anti-PPARγ (1:1000) (catalogue number PP-K8450B-00, R&D Systems), and mouse anti-β-actin (1:1000) (catalogue number ab8226, Abcam). The appropriate secondary antibodies conjugated with a 680 nm infrared fluorophore (LI-COR Biosciences, Lincoln, NE) were used at 1:10,000 dilution. The immunoreactive bands were detected by scanning at 700 nm using a LI-COR Odyssey (LI-COR Biosciences) infrared scanner.
Luciferase Reporter Constructs
DNA sequences containing the proximal −4459/+38 or −600/+38 region of the mouse chemerin promoter were amplified by PCR using genomic DNA from C57BL/6J mouse liver as a template. The PCR products were directionally cloned into pGL3-Basic (Promega Madison, WI). DNA regions containing the proximal (pDR1; −61/−49) and distal direct repeat-1 (dDR1; −472/−460) putative PPARγ response elements were generated by PCR and inserted into pGL4.27 (Promega), a luciferase reporter vector containing a minimal promoter sequence. The putative PPARγ response elements (PPREs) were individually mutated to reduce the homology with the consensus sequence using site-directed mutagenesis. Complementary primers were designed to decrease the homology to 50% of the native DR1 and simultaneously introduce a KpnI recognition site for restriction mapping analysis. Mutant constructs were generated by Phusion (New England Biolabs) PCR using a 0.5 μm concentration of each primer, 26 ng of the pGL3-Chem(−600/+38) as template, 0.04 units/μl Phusion polymerase, 3% DMSO, 1× Phusion HF buffer. The recommended cycling conditions were adapted as follows to permit amplification of the full plasmid containing the desired mutation: denaturation at 98 °C for 30 s; 25 cycles of 98 °C for 10 s, 58 °C for 30 s, and 72 °C for 3 min; and final extension at 72 °C for 10 min. A DpnI digestion was performed prior to bacterial transformation of the plasmid DNA to eliminate the parent promoter plasmid. All oligonucleotides used for these procedures are given in supplemental Table S2 (restriction sites or mutations are underlined).
For functional analysis, MCA38 cells were plated at a cell density of 20,000 cells/well in a 48-well plate and were transiently transfected with 75 ng of the indicated reporter vectors along with 50 ng of PPARγ expression plasmid or empty vector (pSG5), 115 ng of pBSK (a carrier plasmid), and 0.2 μl of polyethyleneimine transfection reagent (Sigma-Aldrich) per well. 10 ng of the Renilla luciferase expression plasmid (pHRL-TK) was used to normalize for transfection efficiency. After 48 h, the transfection medium was removed and was replaced with either fresh medium containing 1 μm rosiglitazone or an equal volume of vehicle (0.01% DMSO) control for a subsequent period of 72 h after which the cells were harvested using Reporter Lysis Buffer (Promega) according to the manufacturer's instructions. The Dual Luciferase Assay System (Promega) was used to assess the luciferase activity in the cell lysates using a Luminoskan Ascent (Thermo Labsystems, Franklin, MA). The -fold stimulation of the promoter activity was calculated after normalizing the reporter firefly luciferase values to the Renilla luciferase values that were measured on the Luminoskan Ascent.
Chromatin Immunoprecipitation (ChIP) Analysis
ChIP analysis was performed using a ChampionChIP One-Day kit (SABiosciences Corp.) according to the manufacturer's protocol. The cells were fixed with 1% formaldehyde, harvested by scraping, lysed, and sonicated to shear DNA into less than 2.0-kb fragments, and cellular debris were removed by centrifugation (14,000 × g, 10 min, 4 °C). The resultant solution was precleared with protein A beads. Samples were then incubated with anti-PPARγ antibody (catalogue number PP-K8450B-00, R&D Systems), mouse IgG (control), or no antibody (mock) overnight at 4 °C with rotation. After the incubation period, protein A beads were added to each ChIP fraction and incubated at 4 °C for 1 h with rotation. Beads were then collected by centrifugation, and the chromatin cross-links were reversed by incubation at 95 °C for 10 min in elution buffer. The samples were centrifuged, and the supernatant was collected. The DNA from the supernatants was purified using DNA spin columns, and the final DNA was eluted in an elution buffer. Each sample was then subjected to both end point PCR analysis using Taq DNA polymerase (Invitrogen) (25 cycles) and also to real time PCR analysis (Stratagene). The primers used for PCR analysis are given in supplemental Table S2.
Statistical Analyses
Statistical analysis was performed using the Student's t test (two-tailed) in all experiments except for experiments in Fig. 5 where a two-way analysis of variance with Bonferroni post hoc analysis was used. The difference in mean values between groups was considered to be significant when p was <0.05.
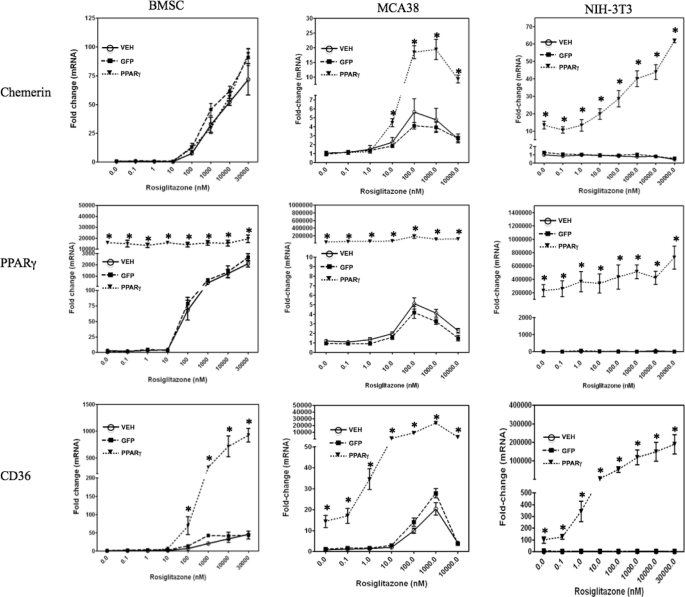
FIGURE 5.
Induction of chemerin expression by forced expression and/or activation of PPARγ. BMSCs, MCA38 cells, or NIH-3T3 cells were treated with the indicated concentrations of rosiglitazone concomitant with VEH (Polybrene; 6 μg/ml in PBS) or transduction with adenovirus expressing GFP or PPARγ. Chemerin, PPARγ, and CD36 mRNA levels were quantified using qPCR and expressed relative to VEH control. Error bars represent S.E. (n = 6). *, p < 0.05 versus VEH control.
RESULTS
Parallel Expression and Function of Chemerin and PPARγ during Adipogenic Differentiation
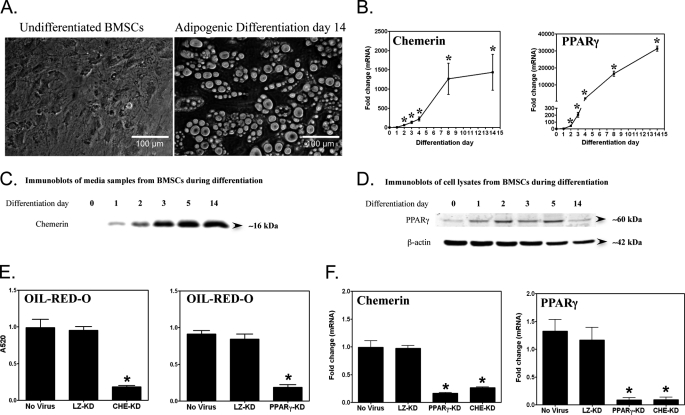
To investigate functional interactions between chemerin and PPARγ, we used a multipotent murine primary BMSC model. Following 14 days of adipogenic stimulation, the majority of cells adopted a rounded appearance and contained large oil red O-stained lipid droplets indicative of robust adipocyte differentiation (Fig. 1A). Both mRNA and protein levels of chemerin and PPARγ exhibited a profound differentiation-dependent increase beginning 24 h after adipogenic stimulus with maximal levels after 14 days (Fig. 1, B–D). The early (1–3-day) induction of chemerin and PPARγ mRNA levels corresponded with the adipogenic clonal expansion phase, a period during which lipid accumulation was not yet evident (data not shown). To examine the interdependence of chemerin and PPARγ expression, we determined the effect of knockdown of each gene on the expression of the other. Consistent with previous results obtained with a 3T3-L1 fibroblast model, chemerin knockdown resulted in an 80% reduction of lipid accumulation in the BMSC model (Fig. 1E) compared with the no virus and LacZ shRNA controls. This effect was similar in degree to the reduction of lipid accumulation produced by knockdown of PPARγ. Knockdown of PPARγ also abrogated the increase in chemerin expression that is characteristic of adipocyte differentiation. Likewise, knockdown of chemerin abrogated the differentiation-dependent induction of PPARγ (Fig. 1F). Transduction with the control LacZ shRNA adenovirus did not affect the mRNA levels of either gene. Taken together, these data demonstrate the interdependence of chemerin and PPARγ expression that is required both for BMSC adipogenesis and the adipogenic induction of these genes.
FIGURE 1.
Association between PPARγ and chemerin during adipogenesis of bone marrow-derived mesenchymal stem cells. Differentiation of BMSCs into mature adipocytes (day 14) was associated with the intracellular accumulation of lipid droplets (A) and an induction of chemerin and PPARγ gene expression (B). Chemerin and PPARγ mRNA levels were measured using qPCR and expressed relative to undifferentiated BMSCs (day 0). Immunoblots of BMSCs during adipogenesis showed an induction of chemerin (C) and PPARγ (D) protein expression in a differentiation-dependent manner. Knockdown of either chemerin (CHE-KD) or PPARγ (PPARγ-KD) gene expression using adenovirally delivered shRNAs markedly reduced adipogenesis as assessed by the quantification of oil red O staining (E) and expression of chemerin and PPARγ (F). Error bars represent S.E. (n = 3). *, p < 0.05 versus day 0 (B); *, p < 0.05 versus the no virus and LacZ knockdown (LZ-KD) controls (E and F).
Differential Effects of Chemerin/CMKLR1 and PPARγ on Mitotic Clonal Expansion
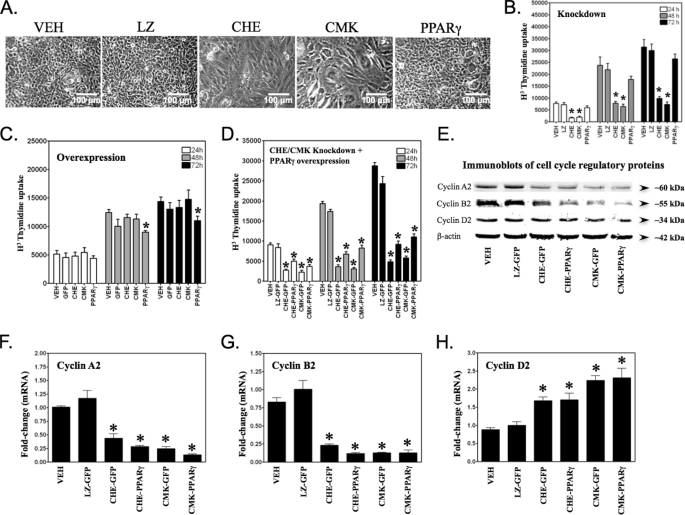
To determine any role for chemerin and PPARγ signaling in the mitotic clonal expansion phase of the adipogenic program, we used shRNA to knock down chemerin, CMKLR1, or PPARγ expression and subsequently assessed cell proliferation. At 72 h, the BMSCs formed a dense monolayer of cells (Fig. 2A). Knockdown of chemerin or CMKLR1 expression, but not PPARγ nor the LacZ control, prevented the formation of this dense monolayer compared with the no virus (vehicle (VEH)) control (Fig. 2A). Consistent with the microscopy examination, there was a significant loss of cell proliferation (∼70%) following chemerin or CMKLR1, but not PPARγ, knockdown compared with the LacZ and VEH controls (Fig. 2B). When we took the gain-of-function approach, there was no significant change in clonal expansion caused by increasing chemerin or CMKLR1 expression in the cells (Fig. 2C). However, there was a significant decrease in the proliferation of cells during clonal expansion when PPARγ was overexpressed (Fig. 2C) consistent with a role for this protein in growth arrest. Considering the importance of PPARγ as a master regulator of adipogenesis, we examined whether forced expression of this transcription factor could restore clonal expansion in chemerin or CMKLR1 shRNA-treated BMSCs. Although PPARγ overexpression rescued 20–30% of the proliferation deficit, it failed to fully restore the impaired clonal expansion caused by chemerin or CMKLR1 knockdown (Fig. 2D). To further investigate this, we examined the expression of key cell cycle regulators in response to loss of chemerin/CMKLR1 signaling. Chemerin or CMKLR1 knockdown caused a >50% loss of cyclins A2 and B2 (mRNA and protein), key drivers of the mitotic phase of the cell cycle (Fig. 2, E–G). A modest increase in the mRNA levels of cyclin D2, a cyclin driving the DNA synthesis phase, was also observed; however, this was not reflected in the levels of protein (Fig. 2, E and H). Overexpression of PPARγ did not modify the effects of chemerin or CMKLR1 knockdown on these cell cycle proteins.
FIGURE 2.
Role of chemerin/CMKLR1 signaling in adipogenic mitotic clonal expansion. Compared with cells treated with the adenoviral transduction VEH (Polybrene; 6 μg/ml in PBS), chemerin (CHE) or CMKLR1 (CMK) knockdown, but not PPARγ knockdown or LacZ transduction control (LZ), resulted in reduced cell density when grown under an adipogenic stimulus for a period of 72 h (A). Cell proliferation over the indicated times in the presence of adipogenic medium was measured using a thymidine incorporation assay following knockdown of LacZ (LZ), chemerin (CHE), CMKLR1 (CMK), or PPARγ (B) or following forced adenoviral expression of GFP, chemerin, CMKLR1, or PPARγ (C). For assessment of rescue effects of PPARγ, BMSCs were treated with VEH, adenovirus expressing GFP, or adenovirus expressing PPARγ concomitant with adenovirus expressing LacZ (LZ), chemerin (CHE), or CMKLR1 (CMK) shRNA (D). Immunoblot analysis of cell cycle proteins revealed a loss of cyclins A2 and B2 with chemerin or CMKLR1 knockdown that was not rescued by PPARγ overexpression (E). Analysis of mRNA levels for each of these cyclins by qPCR revealed largely consistent results (F–H). Error bars represent S.E. (n = 3). *, p < 0.05 versus VEH.
PPARγ Partially Restores Adipocyte Differentiation in the Context of Chemerin/CMKLR1 Deficiency
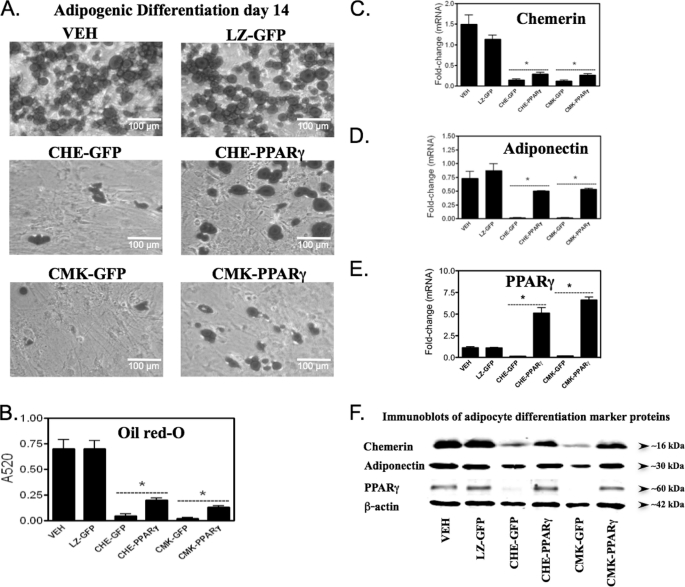
The next goal was to establish whether PPARγ could restore adipogenesis to cells in which CMKLR1 or chemerin had been knocked down. Untreated cells (VEH) or cells transduced with control adenoviruses (LZ-GFP) exhibited normal adipocyte differentiation as assessed by oil red O staining (Fig. 3, A and B) and by the expression of both mRNA and protein of adipogenic markers, chemerin, adiponectin, and PPARγ (Fig. 3, C–F). Knockdown of chemerin or CMKLR1 expression resulted in >90% loss of lipid accumulation compared with the controls (Fig. 3, A and B). Consistent with inhibition of adipogenesis, knockdown of each target was associated with an ∼90% loss of chemerin, adiponectin, and PPARγ mRNA expression levels (Fig. 3, C–E) and a >50% reduction in their corresponding protein levels (Fig. 3F). Overexpression of PPARγ, as compared with GFP in chemerin or CMKLR1 knockdown cells, showed the expected increase in the expression of mRNA (>50-fold) and protein (>5-fold) levels of PPARγ as long as 14 days after transduction (Fig. 3, E and F). Overexpression of PPARγ in chemerin or CMKLR1 knockdown cells (CHE-PPARγ or CMK-PPARγ) also resulted in a >2-fold increase in the amount of lipid accumulation within the cells as compared with CHE-GFP or CMK-GFP, respectively (Fig. 3, A and B). However, PPARγ failed to restore the amount of lipid accumulation within the cells to the levels seen in the VEH or LZ-GFP control groups (Fig. 3, A and B). Consistent with the partial rescue effect of PPARγ, both mRNA and protein levels for the adipogenic markers chemerin and adiponectin were also rescued by PPARγ (CHE-PPARγ or CMK-PPARγ) albeit not to levels observed for cells with intact chemerin or CMKLR1 expression (Fig. 3, C, D, and F).
FIGURE 3.
PPARγ overexpression partially rescues the loss of adipogenesis with chemerin or CMKLR1 knockdown. Prior to initiating adipogenesis, BMSCs were treated with the adenoviral transduction VEH (Polybrene; 6 μg/ml) or transduced with GFP- or PPARγ-overexpressing adenovirus concomitant with knockdown of LacZ (LZ), chemerin (CHE), or CMKLR1 (CMK) expression using adenovirally delivered shRNAs. Oil red O phase-contrast images (A) and quantitation of this staining (B) revealed the inability of PPARγ to fully rescue adipogenesis in cells lacking chemerin or CMKLR1 expression. Chemerin, adiponectin, and PPARγ mRNA levels were quantified after a 14-day differentiation period using qPCR and are expressed relative to VEH control (C–E). Chemerin and adiponectin protein levels were measured by immunoblot of equal volumes of the adipocyte medium after 14 days of differentiation (F). Total lysates of the same cells were used to quantify PPARγ and β-actin (loading control) protein levels by immunoblot (F). Error bars represent S.E. (n = 4). *, p < 0.05 versus respective GFP control.
Chemerin Neutralization Affects Early Events in Adipocyte Differentiation
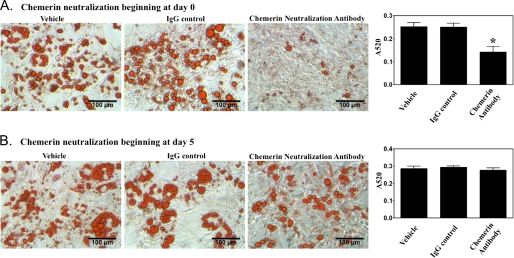
The combined results from clonal expansion and adipocyte differentiation studies confirmed a role for chemerin/CMKLR1 signaling in the adipogenic differentiation program. However, it was not clear whether the defect in adipogenesis observed with loss of chemerin/CMKLR1 signaling was solely a consequence of effects on the clonal expansion phase or whether it also resulted from an effect on later stages of adipogenic differentiation. To assess this, a blocking antibody was used to neutralize extracellular chemerin activity. When chemerin neutralization was initiated prior to clonal expansion, a substantial reduction of lipid accumulation was observed (Fig. 4A). However, when chemerin neutralization was applied after the clonal expansion phase (starting from day 5), there was no significant effect on lipid accumulation (Fig. 4B). These data confirm a key paracrine/autocrine proadipogenic role for chemerin during the clonal expansion phase of BMSCs.
FIGURE 4.
Major impact of chemerin is on adipogenic clonal expansion. Chemerin was neutralized using an anti-chemerin IgG at a final concentration of 100 μg/ml either beginning prior to application of adipogenic medium (day 0; A) or after completion of the clonal expansion phase (day 5; B). Lipid accumulation was visualized using oil red O staining and quantitated using absorption spectrophotometry. Error bars represent S.E. (n = 3). *, p < 0.05 versus VEH control.
PPARγ Induces Chemerin Gene Expression Independent of Adipogenesis
Given the well established role of PPARγ to regulate the expression of many adipogenic genes, we examined the impact of this transcription factor on chemerin expression. BMSCs were transduced with PPARγ- or GFP-expressing adenovirus in conjunction with treatment with the PPARγ agonist rosiglitazone. Rosiglitazone treatment caused a dose-dependent induction of chemerin mRNA levels in GFP-expressing cells that reached a maximal value of 80-fold compared with untreated control (Fig. 5). Overexpression of PPARγ did not result in a further increase of chemerin gene expression, suggesting that levels of PPARγ expression in BMSCs were not limiting the magnitude of chemerin induction by rosiglitazone. The BMSCs exhibited robust induction (>2000-fold) of PPARγ expression with activation by rosiglitazone alone, indicating a dual effect of rosiglitazone to mediate both PPARγ induction and activation in these cells (Fig. 5). In the VEH- and adenoviral GFP-transduced cells, the magnitude of chemerin induction in response to rosiglitazone treatment was similar to that observed for the known PPARγ target gene CD36. However, a further 10-fold increase of CD36 mRNA levels was observed when adenoviral PPARγ overexpression was combined with rosiglitazone treatment, suggesting that the response of this gene was limited by the amount of endogenous PPARγ in these cells.
Given that PPARγ expression/activation was observed to induce some degree of adipocyte differentiation in the absence of other adipogenic stimuli (data not shown), it was important to determine whether chemerin gene expression was regulated by PPARγ independently of adipogenesis. To test this, murine colon adenocarcinoma MCA38 cells and murine embryonic mesenchymal NIH-3T3 stem cells were utilized as additional experimental models. These lines express very low levels of endogenous PPARγ and importantly do not exhibit an adipogenic response upon exposure to PPARγ ligands and/or forced expression of PPARγ. Treatment with rosiglitazone alone or in combination with PPARγ overexpression significantly increased chemerin mRNA levels in MCA38 cells (Fig. 5). Chemerin expression was maximal (5- and 20-fold induction in non-transduced and adenoviral PPARγ-transduced cells, respectively) at 100–1000 nm concentrations of rosiglitazone, whereas higher concentrations produced a submaximal response. Consistent with BMSCs, rosiglitazone treatment of MCA38 cells also resulted in a significant induction of PPARγ and CD36 (Fig. 5). Chemerin mRNA levels were increased to more than 10-fold when PPARγ was overexpressed in NIH-3T3 cells in the absence of rosiglitazone treatment (Fig. 5). This response was unique to this cell type and was consistent with the extremely low basal level of endogenous PPARγ in NIH-3T3 cells. This was also consistent with a lack of any effect of rosiglitazone on chemerin or CD36 gene expression in the NIH-3T3 cells in the absence of PPARγ overexpression (Fig. 5). Similar to MCA38 cells, the combination of PPARγ overexpression and rosiglitazone activation further increased the induction of chemerin gene expression to more than 60-fold higher than basal levels (Fig. 5).
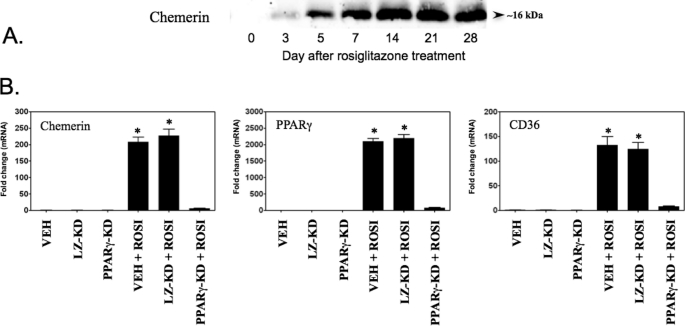
Consistent with the effect on mRNA levels, treatment with rosiglitazone alone induced chemerin protein secretion from BMSCs in a time-dependent fashion (Fig. 6A). Given the relatively high endogenous PPARγ level in these cells, we used a loss-of-function approach to determine whether the response to rosiglitazone was dependent upon this transcription factor. VEH- and LacZ shRNA-transduced cells showed the expected increase in chemerin gene expression with rosiglitazone treatment (Fig. 6B). In contrast, transduction of adenoviral vectors expressing shRNA targeting PPARγ resulted in a nearly complete (>95%) loss of rosiglitazone-induced chemerin gene expression in BMSCs (Fig. 6B), further confirming that the rosiglitazone-induced chemerin gene expression was mediated through PPARγ signaling. Consistent with the data shown in Fig. 5, robust induction (>2000-fold) of PPARγ expression was observed with activation by rosiglitazone alone, and knockdown of PPARγ completely abolished this effect (Fig. 6B). Induction of the established PPARγ target gene CD36 by rosiglitazone was also abrogated by knockdown of PPARγ (Fig. 6B). Together, these results support a role for PPARγ in the regulation of chemerin expression that is independent of a generalized effect on adipocyte differentiation.
FIGURE 6.
PPARγ-dependent induction of chemerin expression by rosiglitazone in BMSCs. PPARγ activation by rosiglitazone (1 μm) induced a time-dependent increase of chemerin protein secretion as assessed by immunoblotting analysis (A). Knockdown (KD) of PPARγ expression abrogated the induction of chemerin and CD36 mRNA levels as assessed by qPCR analysis in BMSCs in response to rosiglitazone (ROSI) treatment (B). Error bars represent S.E. (n = 4) and are expressed relative to the VEH control. *, p < 0.05 versus VEH. LZ, LacZ.
Rosiglitazone Does Not Activate Chemerin Expression in Mature Adipocytes
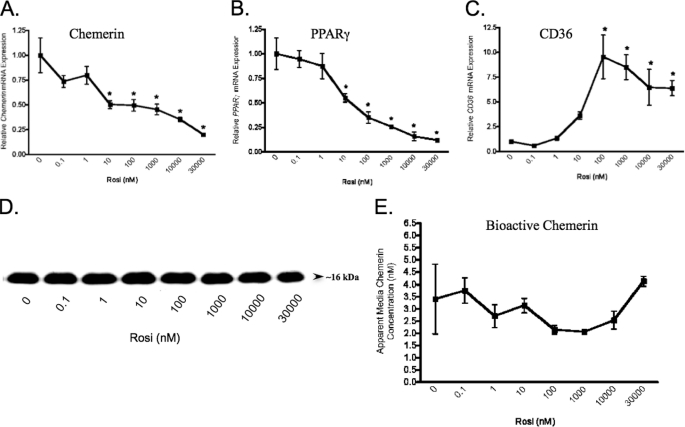
To explore the significance of PPARγ signaling in chemerin expression in mature adipocytes, fully differentiated (14 days) mature adipocytes were treated with rosiglitazone. Unlike the BMSCs, the mature adipocytes exhibited a dose-dependent reduction of chemerin mRNA levels in response to treatment with rosiglitazone (Fig. 7A). These results coincided with a similar marked dose-dependent decrease of PPARγ mRNA levels in response to rosiglitazone (Fig. 7B). By comparison, CD36 mRNA expression was induced (≈10-fold) in the adipocytes (Fig. 7C) but to a lesser extent than that for BMSCs (≈1000-fold; Fig. 5). Total chemerin protein (by immunoblot analyses) and bioactive chemerin (by Tango assay) secreted from mature adipocytes was not significantly affected even at the highest concentration of rosiglitazone (Fig. 7, D and E). Together, these results indicate that PPARγ activation induces chemerin expression selectively in adipocyte precursor cells but not in mature adipocytes.
FIGURE 7.
Repression of chemerin gene expression by rosiglitazone in mature adipocytes. BMSCs were treated with the indicated concentrations of rosiglitazone (Rosi) 14 days after the initiation of adipocyte differentiation. Chemerin (A) and PPARγ (B) mRNA levels were measured by qPCR analysis and found to be decreased in a dose-dependent manner. In contrast, CD36 mRNA levels were increased (C). Rosiglitazone had no effect on total immunodetectable chemerin (D) or bioactive levels of chemerin measured using a Tango assay (E). Values for mRNA are expressed relative to 0 nm rosiglitazone control. Error bars represent S.E. (n = 3). *, p < 0.05 versus 0 nm rosiglitazone.
PPARγ Regulates Chemerin Expression in Vivo
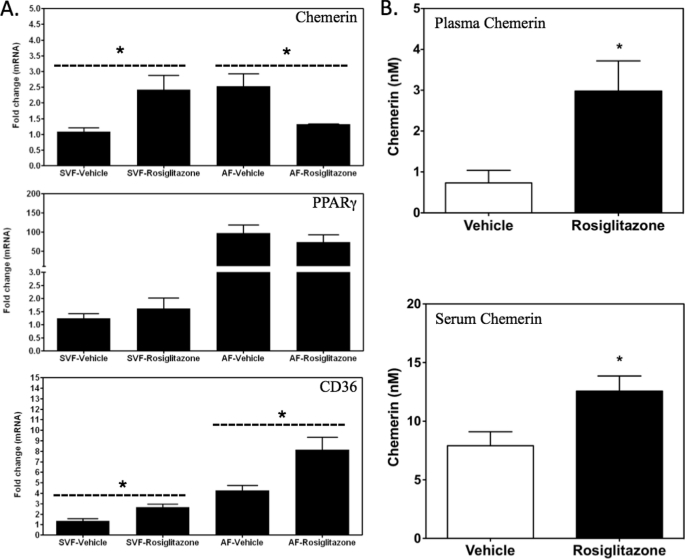
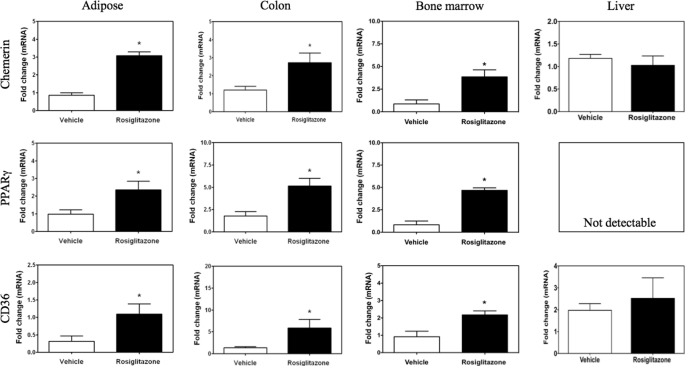
To determine the effects of rosiglitazone on chemerin expression in vivo, mice were treated with rosiglitazone for 5 days. Adipose tissue was fractionated to permit differential analysis of chemerin expression in the preadipocyte-rich stromal vascular fraction (SVF) and mature adipocyte-rich adipocyte fraction. Consistent with the results from the BMSC cell culture experiments, rosiglitazone increased chemerin mRNA levels in the SVF fraction but decreased transcript levels of this gene in the adipocyte fraction (Fig. 8A). In contrast, this treatment did not alter PPARγ mRNA levels in either fraction (Fig. 8A). CD36 expression was increased both in the SVF and adipocyte fraction of subcutaneous adipose tissue from animals treated with rosiglitazone (Fig. 8A). Bioactive chemerin levels were elevated in both plasma and serum samples collected from rosiglitazone-treated animals as compared with vehicle-treated controls (Fig. 8B). To better understand the overall contribution of different tissues to the increase in circulating chemerin, adipose tissue, colon, crude bone marrow, and liver were analyzed for chemerin mRNA levels. A significant induction of chemerin, PPARγ, and CD36 expression was observed for adipose tissue, colon, and bone marrow (Fig. 9). In contrast, the liver, which lacked detectable expression of PPARγ mRNA, exhibited no change in chemerin or CD36 expression with rosiglitazone treatment in vivo (Fig. 9).
FIGURE 8.
Modulation of chemerin expression by rosiglitazone in white adipose tissue. Chemerin, PPARγ, and CD36 mRNA levels were measured by qPCR in the SVF and adipocyte fraction (AF) of subcutaneous adipose tissue of C57BL/6J mice treated with daily injections of rosiglitazone (3 mg/kg, intraperitoneal) for 5 days (A). All values are expressed relative to vehicle control and represent the mean ± S.E. (n = 3). *, p < 0.05 versus vehicle. Both plasma (B, top) and serum (B, bottom) chemerin levels were elevated in the animals treated with rosiglitazone as detected using a Tango assay. Error bars represent S.E. (n = 5). *, p < 0.05 versus vehicle.
FIGURE 9.
Tissue-selective regulation of chemerin by rosiglitazone. Chemerin, PPARγ, and CD36 mRNA levels were measured by qPCR in the indicated tissues of C57BL/6J mice treated with daily injections of rosiglitazone (3 mg/kg, intraperitoneal) for 5 days. All values are expressed relative to the vehicle control and Error bars represent S.E. (n = 5). *, p < 0.05 compared with vehicle control.
Activation of Chemerin Promoter by PPARγ
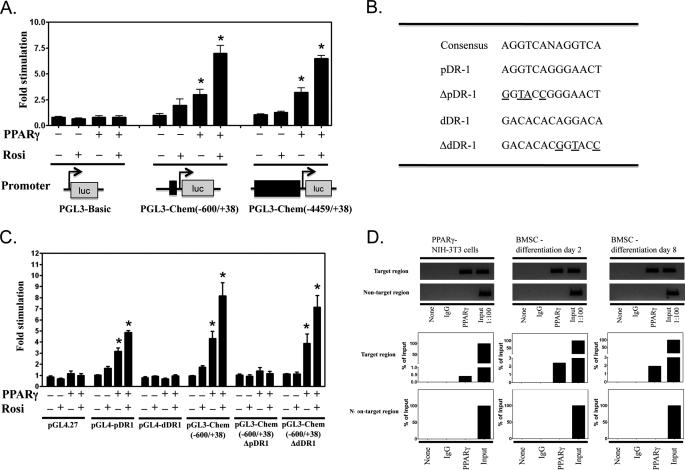
To determine whether the observed PPARγ-dependent changes in chemerin gene expression were a consequence of direct modulation of gene promoter activity, a series of luciferase reporter constructs were developed. To eliminate the impact of any adipogenic effects associated with PPARγ expression/activation, MCA38 cells were used as an experimental model. Consistent with a direct regulatory role of PPARγ on chemerin expression, PPARγ expression alone or in combination with rosiglitazone increased the activity of a luciferase reporter construct containing either 0.6 (−600/+38) or ∼4.5 kb (−4459/+38) of the murine chemerin promoter to a similar extent (Fig. 10A). Sequencing of the mouse chemerin promoter between −600 and +38 revealed the presence of two potential DR1 hormone response elements, one between −61 and −49 (pDR1) and another between −472 and −460 (dDR1; Fig. 10B). When DNA fragments containing each of these putative PPREs were inserted into pGL4.27, pDR1, but not dDR1, conferred PPARγ responsiveness upon the minimal reporter contained in this luciferase reporter vector (Fig. 10C). Conversely, mutation of pDR1 in the pGL3-Chem(−600/+38) abolished PPARγ stimulation of this reporter gene construct (Fig. 10C). In contrast, mutation of the dDR1 element was without effect.
FIGURE 10.
Direct activation of chemerin promoter by PPARγ. PPARγ expression alone or in combination with rosiglitazone (Rosi; 1 μm) induced the activity of a luciferase (luc) reporter construct containing either ∼4.5 (−4459/+38) or 0.6 kb (−600/+38) of the murine chemerin promoter to a similar extent (A). Sequencing of the murine chemerin promoter between −600 and +38 revealed the presence of two potential DR1 hormone response elements, one located proximally between −61 and −49 (pDR1) and another located distally between −472 and −460 (dDR1) (B). When these two PPREs were tested for PPARγ responsiveness, pDR1, but not dDR1, conferred PPARγ responsiveness upon the minimal promoter of the pGL4.27 luciferase reporter construct (C). Conversely, site-directed mutagenesis of the chemerin promoter luciferase reporter (−600/+38) revealed that the mutation of pDR1, but not dDR1, abolished PPARγ stimulation of this reporter gene construct (C). The mutated residues are shown underlined in B. ChIP analysis (D) confirmed the direct binding of PPARγ to the pDR1 PPRE. Chromatin fractions isolated from NIH-3T3 cells transduced with PPARγ or from BMSCs 2 or 8 days after the initiation of adipocyte differentiation were examined for the association of PPARγ with the pDR1 PPRE fragment of the chemerin gene promoter. Anti-PPARγ antibody was used to immunoprecipitate PPARγ-bound chromatin fractions. Equal amounts of the chromatin fractions were also aliquoted and used as no antibody control and mouse IgG control. The immunoprecipitated chromatin fractions were amplified by PCR/qPCR to verify the identity and quantify the extent of PPARγ binding to PPRE. The results are expressed as percentage of input DNA. The identity of PCR products was also verified by agarose gel electrophoresis (D). Error bars represent S.E.
To determine whether PPARγ bound directly to the pDR1 element in the native chemerin promoter in the context of chromosomal DNA, ChIP was used. Lysates were prepared from NIH-3T3 cells transduced with PPARγ-expressing adenovirus as well as BMSCs during the clonal expansion (day 2) and differentiation (day 8) phases of adipogenesis. Fig. 10D demonstrates that ∼0.5% of the input DNA containing the pDR1 target sequence was specifically bound to PPARγ in PPARγ-NIH-3T3 cells, suggestive of a direct binding of PPARγ with this putative PPRE even in the absence of ligand activation. A similar but higher magnitude (>2%) of PPARγ binding to the pDR1 was observed for samples prepared from BMSCs (Fig. 10D). Taken together, these results support a direct activation of chemerin gene expression through interaction with a DR1 element present between −61 and −49 of the chemerin promoter.
DISCUSSION
Adipogenesis is a multistep process driven by a complex of signaling pathways that is well orchestrated by a temporally regulated transcriptional cascade (2, 4). Among several transcription factors that regulate adipogenic commitment and/or differentiation, PPARγ is regarded as the master regulator of adipogenesis as no other factor has yet been identified to induce adipogenesis in the absence of PPARγ (1, 2, 4). During adipogenesis, the increased expression and activation of PPARγ drive the expression of many genes that are essential determinants of adipocyte phenotype and function (2). In BMSCs, an increase in PPARγ and chemerin expression was detected within 24 h after adipogenic stimulation and increased with the progression of adipogenesis to maximal levels in fully differentiated, lipid-laden cells. The temporal relationship of PPARγ and chemerin induction indicated that the latter may be one of the essential adipogenic target genes for PPARγ that is activated during adipocyte differentiation. This idea is supported by the observation that knockdown of PPARγ expression abrogated both adipocyte differentiation and the induction of chemerin gene expression that is characteristic of adipogenesis. In contrast, the loss of PPARγ induction with the knockdown of chemerin expression likely reflected a generalized inhibition of adipocyte differentiation.
Many cellular models of adipogenesis exhibit an early period of mitotic clonal expansion during the determination phase. At this time, the cells undergo one or two rounds of cell division prior to entering the terminal differentiation phase (37, 38). The suppression of clonal expansion by chemerin/CMKLR1, but not PPARγ, knockdown observed in the present study indicated that although chemerin and CMKLR1 promote this process in BMSCs PPARγ does not. Moreover, the lack of effect of chemerin or CMKLR1 overexpression on clonal expansion or subsequent growth arrest indicated that endogenous expression levels of those genes were not limiting to these processes. Forced expression of PPARγ coincident with chemerin knockdown produced only a partial rescue of proliferation and adipogenesis, suggesting that chemerin/CMKLR1 signaling may affect transcription factors such as C/EBPβ and C/EBPδ that are upstream of PPARγ and required for full progression through the adipogenic program (39, 40). PPARγ overexpression alone caused a mild but significant suppression of cell proliferation during clonal expansion, a finding consistent with that from other models (41). This generalized role for PPARγ to inhibit clonal expansion as cells become terminally differentiated is well established (41–46) and may have also contributed to the failure to achieve a full rescue of adipogenesis in the face of chemerin or CMKLR1 knockdown.
It is well established that adipogenic clonal expansion is regulated by a variety of cell cycle proteins (42, 45, 47–53). Consistent with a role for chemerin/CMKLR1 signaling in driving the proliferative phase of adipogenic clonal expansion in BMSCs, there was a marked loss of cyclin A2/B2 mRNA and protein expression with chemerin or CMKLR1 knockdown. The lack of any substantial effect on cyclin D2 suggests that the predominant impact of chemerin/CMKLR1 signaling is on the G2/M phase of the cell cycle where cyclins A2/B2 play an essential role rather than the G1/S phase, which is more affected by cyclin D2 expression and activity. Moreover, consistent with the lack of complete rescue of clonal expansion by PPARγ, the loss of cyclins A2 and B2 with chemerin/CMKLR1 knockdown was not rescued by PPARγ overexpression, suggesting a PPARγ-independent role for chemerin signaling in clonal expansion.
Our experiments demonstrated that neutralization of secreted chemerin has the greatest impact upon BMSC adipogenesis when initiated prior to the clonal expansion phase. These data are consistent with our previous findings with 3T3-L1 cells where we found that when knockdown of chemerin or CMKLR1 was initiated 4 days after the application of the adipogenic stimulus the effects on subsequent adipocyte formation were minimal (15). In contrast, when chemerin or CMKLR1 knockdown was initiated prior to exposure to the adipogenic stimulus, adipogenesis was abrogated. Taken together, this indicates that autocrine/paracrine effects of chemerin to promote adipogenesis are most important at the earliest stage but are largely dispensable after clonal expansion is complete and commitment to the adipocyte lineage has occurred. Thus, it appears that in mature adipocytes chemerin/CMKLR1 signaling is most important in the context of regulating key metabolic functions such as lipolysis and glucose uptake (15, 22, 24, 29).
The induction of chemerin mRNA levels in both adipogenic BMSCs and non-adipogenic MCA38 or NIH-3T3 cells with PPARγ agonism and/or forced expression of PPARγ demonstrated that this response was not a generalized consequence of adipocyte differentiation but rather regulation of the chemerin promoter by PPARγ. This was further supported by our identification and characterization of a functional DR1-type PPRE present within the chemerin promoter. Thus, our data provide the first experimental evidence of a direct role for PPARγ in regulating the expression of chemerin at the level of gene transcription. Unexpectedly, this effect was cell type-dependent as evidenced by finding that chemerin gene expression was decreased by PPARγ activation in mature BMSC-derived adipocytes. Although rosiglitazone increased the expression of this gene in vivo in total subcutaneous white adipose tissue, cell type selectivity was also preserved as chemerin mRNA levels were increased in the preadipocyte-containing SVF but decreased in the adipocyte fraction. These data are consistent with recent findings by Vernochet et al. (54) who reported that troglitazone treatment repressed chemerin mRNA levels in Swiss 3T3-derived adipocytes and increased chemerin mRNA levels in subcutaneous white adipose tissue in vivo. Also consistent with our data was their finding that troglitazone markedly increased chemerin mRNA levels in a non-adipogenic variant Swiss 3T3 line. To explain these findings, Vernochet et al. (54) provided evidence for a PPARγ-stimulated C/EBPα-CTB1/2 transcriptional co-repressor complex that interacted directly with the promoter regions of genes that exhibited reduced expression in response to troglitazone treatment of mature adipocytes. It is certainly plausible that a similar mechanism could account at least in part for the findings in the present study. A further possible explanation for the lack of chemerin induction is a plateau effect whereby expression levels were already maximal in mature adipocytes as a consequence of the extremely high levels of PPARγ expression and activation in this cell type. Our in vivo results further demonstrated that PPARγ activation increased chemerin expression in white adipose tissue but not liver. Both liver and adipose tissue are large organs that express comparatively high levels of chemerin (15, 28); however, it is likely that the latter was the major contributor to the observed changes in plasma/serum chemerin outside of what were likely small contributions from other tissues such as colon and bone marrow.
Our results have provided important new information not only regarding the role of chemerin in adipocyte differentiation but also the role of this adipokine in adipose tissue physiology and pathophysiology. In tissue culture, chemerin functions as a paracrine/autocrine factor to promote adipocyte differentiation primarily through effects on the clonal expansion phase of adipogenesis. In the context of adipose tissue in vivo, it is likely that chemerin secretion from mature adipocytes exerts a proadipogenic drive on precursor cells and thereby may contribute to the expansion of adipose mass that is characteristic of obesity. Increased secretion of chemerin with increased adiposity has been implicated as a factor that may contribute to the undesirable systemic metabolic alterations that are common with obesity (22–24, 28, 31). Moreover, given that chemerin is a proinflammatory chemokine, a further potential implication of increased secretion of this adipokine is the initiation or promotion of adipose tissue inflammation, a condition that is believed to contribute substantially to the dysfunction of adipose tissue with obesity (55). PPARγ agonism by thiazolidinediones such as rosiglitazone has been established as an effective strategy for the treatment of hyperglycemia associated with type 2 diabetes mellitus, a disorder particularly prevalent in the obese (56, 57). The beneficial effects of these drugs have been attributed in part to the “normalization” of secretion of adipokines such as adiponectin (58–60). Given our finding that rosiglitazone reduces the expression of chemerin selectively in mature adipocytes both in vitro and in vivo, it is tempting to speculate that the therapeutic benefit of this drug may be elicited at least in part through a normalization of chemerin secretion akin to that for other adipokines. However, although chemerin expression was reduced in mature adipocytes, the overall expression in adipose tissue increases along with the plasma and serum levels of chemerin. This suggests that chemerin could also be contributing to the adverse effects of rosiglitazone such as weight gain and the increased risk for cardiac effects (61). Further research will help to clarify the pathological significance of PPARγ regulation of chemerin gene expression in precursor cells and mature adipocytes.
Supplementary Material
This work was supported in part by grants from the Canadian Institutes of Health Research and the Canadian Foundation for Innovation.

The on-line version of this article (available at http://www.jbc.org) contains supplemental Tables S1 and S2.
- PPARγ
- peroxisome proliferator-activated receptor γ
- CMKLR1
- chemokine-like receptor 1
- BMSC
- bone marrow mesenchymal stem cell
- PPRE
- PPARγ response element
- VEH
- vehicle
- SVF
- stromal vascular fraction
- DR1
- direct repeat-1
- pDR1
- proximal DR1
- dDR1
- distal DR1
- C/EBP
- CCAAT/enhancer-binding protein
- qPCR
- quantitative PCR.
REFERENCES
- 1. Gurnell M. (2005) Best Pract. Res. Clin. Endocrinol. Metab. 19, 501–523 [DOI] [PubMed] [Google Scholar]
- 2. Muruganandan S., Roman A. A., Sinal C. J. (2009) Cell. Mol. Life Sci. 66, 236–253 [DOI] [PMC free article] [PubMed] [Google Scholar]
- 3. Spiegelman B. M. (1998) Diabetes 47, 507–514 [DOI] [PubMed] [Google Scholar]
- 4. Rosen E. D., MacDougald O. A. (2006) Nat. Rev. Mol. Cell Biol. 7, 885–896 [DOI] [PubMed] [Google Scholar]
- 5. Maeda N., Takahashi M., Funahashi T., Kihara S., Nishizawa H., Kishida K., Nagaretani H., Matsuda M., Komuro R., Ouchi N., Kuriyama H., Hotta K., Nakamura T., Shimomura I., Matsuzawa Y. (2001) Diabetes 50, 2094–2099 [DOI] [PubMed] [Google Scholar]
- 6. De Vos P., Lefebvre A. M., Miller S. G., Guerre-Millo M., Wong K., Saladin R., Hamann L. G., Staels B., Briggs M. R., Auwerx J. (1996) J. Clin. Investig. 98, 1004–1009 [DOI] [PMC free article] [PubMed] [Google Scholar]
- 7. Tomaru T., Steger D. J., Lefterova M. I., Schupp M., Lazar M. A. (2009) J. Biol. Chem. 284, 6116–6125 [DOI] [PMC free article] [PubMed] [Google Scholar]
- 8. Banga A., Unal R., Tripathi P., Pokrovskaya I., Owens R. J., Kern P. A., Ranganathan G. (2009) Am. J. Physiol. Endocrinol. Metab. 296, E480–E489 [DOI] [PMC free article] [PubMed] [Google Scholar]
- 9. Long Q., Lei T., Feng B., Yin C., Jin D., Wu Y., Zhu X., Chen X., Gan L., Yang Z. (2010) Endocrinology 151, 3195–3203 [DOI] [PubMed] [Google Scholar]
- 10. Goralski K. B., Sinal C. J. (2007) Can. J. Physiol. Pharmacol. 85, 113–132 [DOI] [PubMed] [Google Scholar]
- 11. Duncan B. B., Schmidt M. I., Pankow J. S., Bang H., Couper D., Ballantyne C. M., Hoogeveen R. C., Heiss G. (2004) Diabetes 53, 2473–2478 [DOI] [PubMed] [Google Scholar]
- 12. Haluzik M. (2005) Curr. Opin. Investig. Drugs 6, 988–993 [PubMed] [Google Scholar]
- 13. Bullen J. W., Jr., Bluher S., Kelesidis T., Mantzoros C. S. (2007) Am. J. Physiol. Endocrinol. Metab. 292, E1079–E1086 [DOI] [PubMed] [Google Scholar]
- 14. Kantartzis K., Fritsche A., Tschritter O., Thamer C., Haap M., Schäfer S., Stumvoll M., Häring H. U., Stefan N. (2005) Obes. Res. 13, 1683–1691 [DOI] [PubMed] [Google Scholar]
- 15. Goralski K. B., McCarthy T. C., Hanniman E. A., Zabel B. A., Butcher E. C., Parlee S. D., Muruganandan S., Sinal C. J. (2007) J. Biol. Chem. 282, 28175–28188 [DOI] [PubMed] [Google Scholar]
- 16. Wittamer V., Franssen J. D., Vulcano M., Mirjolet J. F., Le Poul E., Migeotte I., Brézillon S., Tyldesley R., Blanpain C., Detheux M., Mantovani A., Sozzani S., Vassart G., Parmentier M., Communi D. (2003) J. Exp. Med. 198, 977–985 [DOI] [PMC free article] [PubMed] [Google Scholar]
- 17. Meder W., Wendland M., Busmann A., Kutzleb C., Spodsberg N., John H., Richter R., Schleuder D., Meyer M., Forssmann W. G. (2003) FEBS Lett. 555, 495–499 [DOI] [PubMed] [Google Scholar]
- 18. Zabel B. A., Silverio A. M., Butcher E. C. (2005) J. Immunol. 174, 244–251 [DOI] [PubMed] [Google Scholar]
- 19. Muruganandan S., Roman A. A., Sinal C. J. (2010) J. Bone Miner. Res. 25, 222–234 [DOI] [PubMed] [Google Scholar]
- 20. Park K. W., Halperin D. S., Tontonoz P. (2008) Cell Metab. 8, 454–457 [DOI] [PubMed] [Google Scholar]
- 21. Spalding K. L., Arner E., Westermark P. O., Bernard S., Buchholz B. A., Bergmann O., Blomqvist L., Hoffstedt J., Näslund E., Britton T., Concha H., Hassan M., Rydén M., Frisén J., Arner P. (2008) Nature 453, 783–787 [DOI] [PubMed] [Google Scholar]
- 22. Ernst M. C., Issa M., Goralski K. B., Sinal C. J. (2010) Endocrinology 151, 1998–2007 [DOI] [PubMed] [Google Scholar]
- 23. Bozaoglu K., Segal D., Shields K. A., Cummings N., Curran J. E., Comuzzie A. G., Mahaney M. C., Rainwater D. L., VandeBerg J. L., MacCluer J. W., Collier G., Blangero J., Walder K., Jowett J. B. (2009) J. Clin. Endocrinol. Metab. 94, 3085–3088 [DOI] [PMC free article] [PubMed] [Google Scholar]
- 24. Bozaoglu K., Bolton K., McMillan J., Zimmet P., Jowett J., Collier G., Walder K., Segal D. (2007) Endocrinology 148, 4687–4694 [DOI] [PubMed] [Google Scholar]
- 25. Lehrke M., Becker A., Greif M., Stark R., Laubender R. P., von Ziegler F., Lebherz C., Tittus J., Reiser M., Becker C., Göke B., Leber A. W., Parhofer K. G., Broedl U. C. (2009) Eur. J. Endocrinol. 161, 339–344 [DOI] [PubMed] [Google Scholar]
- 26. Parlee S. D., Ernst M. C., Muruganandan S., Sinal C. J., Goralski K. B. (2010) Endocrinology 151, 2590–2602 [DOI] [PubMed] [Google Scholar]
- 27. Sell H., Laurencikiene J., Taube A., Eckardt K., Cramer A., Horrighs A., Arner P., Eckel J. (2009) Diabetes 58, 2731–2740 [DOI] [PMC free article] [PubMed] [Google Scholar]
- 28. Weigert J., Neumeier M., Wanninger J., Filarsky M., Bauer S., Wiest R., Farkas S., Scherer M. N., Schäffler A., Aslanidis C., Schölmerich J., Buechler C. (2010) Clin. Endocrinol. 72, 342–348 [DOI] [PubMed] [Google Scholar]
- 29. Yang M., Yang G., Dong J., Liu Y., Zong H., Liu H., Boden G., Li L. (2010) J. Investig. Med. 58, 883–886 [DOI] [PubMed] [Google Scholar]
- 30. Becker M., Rabe K., Lebherz C., Zugwurst J., Göke B., Parhofer K. G., Lehrke M., Broedl U. C. (2010) Diabetes 59, 2898–2903 [DOI] [PMC free article] [PubMed] [Google Scholar]
- 31. Stejskal D., Karpisek M., Hanulova Z., Svestak M. (2008) Biomed. Pap. Med. Fac. Univ. Palacky Olomouc Czech Repub. 152, 217–221 [DOI] [PubMed] [Google Scholar]
- 32. Spiroglou S. G., Kostopoulos C. G., Varakis J. N., Papadaki H. H. (2010) J. Atheroscler. Thromb. 17, 115–130 [DOI] [PubMed] [Google Scholar]
- 33. Ernst M. C., Sinal C. J. (2010) Trends Endocrinol. Metab. 21, 660–667 [DOI] [PubMed] [Google Scholar]
- 34. Nishimura S., Manabe I., Nagai R. (2009) Discov. Med. 8, 55–60 [PubMed] [Google Scholar]
- 35. O'Rourke R. W. (2009) Surgery 145, 255–259 [DOI] [PMC free article] [PubMed] [Google Scholar]
- 36. Schmittgen T. D., Livak K. J. (2008) Nat. Protoc. 3, 1101–1108 [DOI] [PubMed] [Google Scholar]
- 37. Fajas L., Debril M. B., Auwerx J. (2001) J. Mol. Endocrinol. 27, 1–9 [DOI] [PubMed] [Google Scholar]
- 38. Gregoire F. M., Smas C. M., Sul H. S. (1998) Physiol. Rev. 78, 783–809 [DOI] [PubMed] [Google Scholar]
- 39. Tang Q. Q., Otto T. C., Lane M. D. (2003) Proc. Natl. Acad. Sci. U.S.A. 100, 850–855 [DOI] [PMC free article] [PubMed] [Google Scholar]
- 40. Tang Q. Q., Lane M. D. (1999) Genes Dev. 13, 2231–2241 [DOI] [PMC free article] [PubMed] [Google Scholar]
- 41. Altiok S., Xu M., Spiegelman B. M. (1997) Genes Dev. 11, 1987–1998 [DOI] [PMC free article] [PubMed] [Google Scholar]
- 42. Fajas L., Landsberg R. L., Huss-Garcia Y., Sardet C., Lees J. A., Auwerx J. (2002) Dev. Cell 3, 39–49 [DOI] [PubMed] [Google Scholar]
- 43. Cho Y. C., Jefcoate C. R. (2004) J. Cell. Biochem. 91, 336–353 [DOI] [PubMed] [Google Scholar]
- 44. Jefcoate C. R., Wang S., Liu X. (2008) Methods Mol. Biol. 456, 173–193 [DOI] [PubMed] [Google Scholar]
- 45. Miard S., Fajas L. (2005) Int. J. Obes. 29, Suppl. 1, S10–S12 [DOI] [PubMed] [Google Scholar]
- 46. Morrison R. F., Farmer S. R. (1999) J. Biol. Chem. 274, 17088–17097 [DOI] [PubMed] [Google Scholar]
- 47. Mundle S. D., Saberwal G. (2003) FASEB J. 17, 569–574 [DOI] [PubMed] [Google Scholar]
- 48. Sarruf D. A., Iankova I., Abella A., Assou S., Miard S., Fajas L. (2005) Mol. Cell. Biol. 25, 9985–9995 [DOI] [PMC free article] [PubMed] [Google Scholar]
- 49. Aguilar V., Annicotte J. S., Escote X., Vendrell J., Langin D., Fajas L. (2010) Endocrinology 151, 5247–5254 [DOI] [PMC free article] [PubMed] [Google Scholar]
- 50. Tang Q. Q., Otto T. C., Lane M. D. (2003) Proc. Natl. Acad. Sci. U.S.A. 100, 44–49 [DOI] [PMC free article] [PubMed] [Google Scholar]
- 51. Abella A., Dubus P., Malumbres M., Rane S. G., Kiyokawa H., Sicard A., Vignon F., Langin D., Barbacid M., Fajas L. (2005) Cell Metab. 2, 239–249 [DOI] [PubMed] [Google Scholar]
- 52. Wang C., Pattabiraman N., Zhou J. N., Fu M., Sakamaki T., Albanese C., Li Z., Wu K., Hulit J., Neumeister P., Novikoff P. M., Brownlee M., Scherer P. E., Jones J. G., Whitney K. D., Donehower L. A., Harris E. L., Rohan T., Johns D. C., Pestell R. G. (2003) Mol. Cell. Biol. 23, 6159–6173 [DOI] [PMC free article] [PubMed] [Google Scholar]
- 53. Hishida T., Naito K., Osada S., Nishizuka M., Imagawa M. (2008) Biochem. Biophys. Res. Commun. 370, 289–294 [DOI] [PubMed] [Google Scholar]
- 54. Vernochet C., Peres S. B., Davis K. E., McDonald M. E., Qiang L., Wang H., Scherer P. E., Farmer S. R. (2009) Mol. Cell. Biol. 29, 4714–4728 [DOI] [PMC free article] [PubMed] [Google Scholar]
- 55. Qatanani M., Szwergold N. R., Greaves D. R., Ahima R. S., Lazar M. A. (2009) J. Clin. Investig. 119, 531–539 [DOI] [PMC free article] [PubMed] [Google Scholar]
- 56. Zhu H. L., Yu R. M., Huang X. Z., Huang W. (2008) Nan Fang Yi Ke Da Xue Xue Bao 28, 1050–1051 [PubMed] [Google Scholar]
- 57. Mensink M., Hesselink M. K., Russell A. P., Schaart G., Sels J. P., Schrauwen P. (2007) Int. J. Obes. 31, 1302–1310 [DOI] [PubMed] [Google Scholar]
- 58. Ghanim H., Dhindsa S., Aljada A., Chaudhuri A., Viswanathan P., Dandona P. (2006) J. Clin. Endocrinol. Metab. 91, 3553–3558 [DOI] [PubMed] [Google Scholar]
- 59. Bahia L., Aguiar L. G., Villela N., Bottino D., Godoy-Matos A. F., Geloneze B., Tambascia M., Bouskela E. (2007) Atherosclerosis 195, 138–146 [DOI] [PubMed] [Google Scholar]
- 60. Liu Y., Chewchuk S., Lavigne C., Brûlé S., Pilon G., Houde V., Xu A., Marette A., Sweeney G. (2009) Am. J. Physiol. Endocrinol. Metab. 297, E657–E664 [DOI] [PubMed] [Google Scholar]
- 61. Kaul S., Diamond G. A. (2010) Nat. Rev. Cardiol. 7, 670–672 [DOI] [PubMed] [Google Scholar]
Associated Data
This section collects any data citations, data availability statements, or supplementary materials included in this article.


