Abstract
Flavodiiron (Flv) proteins are involved in detoxification of O2 and NO in anaerobic bacteria and archaea. Cyanobacterial Flv proteins, on the contrary, function in oxygenic environment and possess an extra NAD(P)H:flavin oxidoreductase module. Synechocystis sp. PCC 6803 has four genes (sll1521, sll0219, sll0550, and sll0217) encoding Flv proteins (Flv1, Flv2, Flv3, and Flv4). Previous in vitro studies with recombinant Flv3 protein from Synechocystis provided evidence that it functions as a NAD(P)H:oxygen oxidoreductase, and subsequent in vivo studies with Synechocystis confirmed the role of Flv1 and Flv3 proteins in the Mehler reaction (photoreduction of O2 to H2O). Interestingly, homologous proteins to Flv1 and Flv3 can be found also in green algae, mosses, and Selaginella. Here, we addressed the function of Flv1 and Flv3 in Synechocystis using the Δflv1, Δflv3, and Δflv1/Δflv3 mutants and applying inorganic carbon (Ci)-deprivation conditions. We propose that only the Flv1/Flv3 heterodimer form is functional in the Mehler reaction in vivo. 18O2 labeling was used to discriminate between O2 evolution in photosynthetic water splitting and O2 consumption. In wild type, ∼20% of electrons originated from water was targeted to O2 under air level CO2 conditions but increased up to 60% in severe limitation of Ci. Gas exchange experiments with Δflv1, Δflv3, and Δflv1/Δflv3 mutants demonstrated that a considerable amount of electrons in these mutants is directed to photorespiration under Ci deprivation. This assumption is in line with increased transcript abundance of photorespiratory genes and accumulation of photorespiratory intermediates in the WT and to a higher extent in mutant cells under Ci deprivation.
Keywords: Bioenergetics, Electron Transfer, Electron Transport, Flavoproteins, Photosynthesis, Cyanobacteria, Photorespiration
Introduction
Flavodiiron proteins (or A-type flavoproteins, Flv)3 are involved in the detoxification of O2 or NO in strict and facultative anaerobic prokaryotes (1). A similar type of Flv proteins, however, with strict selectivity toward O2, was recently identified also in some eukaryotic pathogenic protozoa (2). All of these Flv proteins contain two redox centers: a flavin mononucleotide, functioning as an electron acceptor, and a non-heme Fe-Fe center as an active site (1). Available crystal structures of the Flv proteins from prokaryotic and eukaryotic organisms contain two monomers in a “head-to-tail” arrangement, bringing the flavin mononucleotide and Fe-Fe centers of opposing monomers into close proximity (3, 4).
The genome sequence of the cyanobacterium Synechocystis has revealed four genes (sll1521, sll0219, sll0550, and sll0217) encoding Flv proteins (Flv1, Flv2, Flv3, and Flv4, respectively). Unlike the organisms mentioned above, cyanobacterial Flv proteins possess an additional NAD(P)H:flavin oxidoreductase module fused at the C terminus (1, 5). Two Flv proteins in Synechocystis, Flv2 and Flv4, are unique for cyanobacteria. Interestingly, homologous proteins to Flv1 and Flv3 can be found also in green algae, mosses, and Selaginella (6), whereas only one protein with very low similarity to Flv proteins has been found in plant genomes (7). We have recently demonstrated an essential role of Flv2 and Flv4 in photoprotection of the photosystem (PS) II complex under ambient CO2 conditions (6). Nevertheless, the exact mechanism underlying this photoprotective effect and the localization of the Flv2 and Flv4 proteins still remain to be elucidated.
In vitro studies with recombinant Flv protein from Synechocystis provided evidence that Flv3 functions as a NAD(P)H:oxygen oxidoreductase (5), and subsequent in vivo studies with Synechocystis confirmed the role of Flv1 and Flv3 proteins in photoreduction of O2 (7). Photoreduction of O2 to hydrogen peroxide (H2O2) at the reducing side of PSI complex was discovered 60 years ago by Mehler in spinach chloroplasts and therefore is called a Mehler reaction (8). Subsequently, it has been reported that the primary product of the Mehler reaction is superoxide anion (O2−), and its disproportionation produces H2O2 and O2 (9). It is important to note that reactive oxygen species (ROS) produced during photoreduction of O2 do not accumulate in intact chloroplasts due to efficient ROS-scavenging enzymes in near proximity to the photosynthetic electron transport chain (10). Contrary to the Mehler reaction in plants, the cyanobacterial Mehler reaction driven by Flv1 and Flv3 does not produce ROS (7).
In addition to the Mehler reaction and dark respiration, photorespiration consumes O2 in oxygenic photosynthetic organisms (11) but, in this case, also liberates CO2. Photorespiration is based on the dual function of Rubisco, the key enzyme of photosynthetic carbon assimilation, which binds either CO2 or O2 to the active site depending on the partial pressure of these gases. Oxygenation of ribulose-1,5-bisphosphate by Rubisco produces toxic 2-phosphoglycolate (2PG), which is metabolized by the photorespiratory pathway. Photorespiration is often described as one of the most wasteful reactions due to loss of photosynthetically fixed carbon and energy (12). Cyanobacteria have evolved sophisticated CO2-concentrating mechanisms that operate to increase the CO2 concentration around Rubisco, inside of the subcellular compartment called the carboxysome (13–16). The presence of efficient CO2 concentrating mechanisms suggested that the photorespiratory pathway is probably not essential in cyanobacteria (17). Nevertheless, more recent studies on Synechocystis mutants defective in all three predicted photorespiratory pathways, the plant-like C2 cycle and the bacterial-type glycerate and decarboxylation pathways, demonstrated a high CO2-requiring phenotype comparable with plant photorespiratory mutants and thus supported the existence and essential function of photorespiratory 2PG metabolism in cyanobacteria (18, 19). In addition to 2PG detoxification, the photorespiratory 2PG metabolism together with the Mehler reaction supports the acclimation of cyanobacteria to high light stress because a double mutant Δflv3/ΔgcvT defective in both the Flv3 protein and the glycine decarboxylase complex, which is involved in plant-like C2 photorespiratory pathway, could not segregate completely, and the mutant demonstrated a high light-sensitive phenotype (20).
However, despite the well defined routes for 2PG metabolism, the experimental evidence for photorespiratory gas exchange in cyanobacteria is still missing. Here, for the first time to the knowledge of the authors, we report photorespiratory oxygen uptake by Rubisco under Ci deprivation conditions in Synechocystis mutant strains deficient in the flv1 and/or flv3 genes.
EXPERIMENTAL PROCEDURES
Strain and Culture Conditions
Synechocystis sp. PCC 6803 (WT) and mutant strains were grown in BG-11 medium buffered with 20 mm N-[Tris(hydroxymethyl)methyl]-2-aminoethanesulfonic acid-KOH, pH 8.2, with gentle agitation under continuous light (50 μmol photons m−2 s−1) at 30 °C and 3% CO2. Three days before the experiments, the cells were shifted to air level CO2 atmosphere. For measurements, the cells were harvested and resuspended in a fresh BG-11 medium without NaHCO3 at chlorophyll (Chl) concentration of 10–20 μg ml−1. Only when indicated, NaHCO3 was added. For Ci deprivation experiments, the cells were incubated under the light in an air-tight Eppendorf tube for 4 h.
Mutants
The construction of the single mutants Δflv1 (containing a chloramphenicol-resistant cassette) and Δflv3 (containing a spectinomycin-resistant cassette) was described previously (7). The double mutant of Δflv1/Δflv3 was generated by second transformation of the Δflv3 mutant with the mutated flv1 construct. The genotype of all mutants was verified by PCR using total chromosomal DNA and gene-specific primers for flv1 and flv3 (20), respectively (supplemental Fig. S1).
Oxygen Evolution
Steady-state oxygen evolution rates were measured with a Clark type oxygen electrode (DW1, Hansatech) at a saturating light intensity. To measure the net photosynthesis, the cells were suspended in BG-11 medium supplemented with 10 mm NaHCO3, and for the PSII activity measurements, 2 mm 2,5-dimethyl-p-benzoquinone was added to cell suspension as an artificial electron acceptor.
P700 Light Curve Measurements
P700 measurements were performed by DUAL-PAM-100 (Walz, Germany). The yield of non-photochemical energy dissipation in the PSI centers occurring due to the acceptor side limitation of PSI, Y(NA), were calculated as Y(NA) = (Pm − Pm ′)/Pm. For determination of Pm, a saturating pulse (6000 μmol photons m−2 s−1, 300 ms) was applied on cell samples preilluminated with far-red light (75 watts m−2, 10 s). Thus, Pm was defined as a maximal change of the P700 signal upon transformation of P700 from the fully reduced to the fully oxidized state. Pm ′ represents the maximal change of the P700 signal upon application of a saturating pulses at different increasing light intensities duration of 30 s.
Membrane Inlet Mass Spectrometry
Measurements of 16O2 (mass 32), 18O2 (mass 36) and CO2 (mass 44) exchange were performed by membrane inlet mass spectrometry directly on culture suspensions. For analyses, 1.5-ml samples were introduced into the measuring chamber that is connected to the vacuum line of a mass spectrometer (model Prima-B, Thermo Fisher Scientific) by a Teflon membrane located at the bottom of the chamber. With this setup, gases dissolved in the liquid above the membrane diffuse through the thin Teflon layer and are directly introduced into the ion source of the mass spectrometer. The measuring chamber was thermostated (30 °C) using a water jacket, and the suspension was continuously mixed by a magnetic stirrer. Actinic light (500 μmol photons m−2 s−1) was applied by a LED-powered fiber optic illuminator (PerkinElmer Life Sciences) when needed. Calculation of light-induced oxygen uptake is based on the fact that by photosynthetic activity the cells produce essentially 16O2 from water, whereas if the heavy isotope 18O2 is present in the suspension, its consumption reflects O2 uptake. Using a mixture of isotopes, photosynthetic and respiratory activity of cells can then be calculated simultaneously upon illumination using simple isotope ratio expressed either as exchange rates (uptake or production flow rates) or as cumulative O2 exchange (amounts that have been produced or consumed as a function of time) as detailed in Ref. 21. In our experiments, 18O2 (99% 18O2 isotope content, Euriso-Top) was injected by bubbling at the top of the suspension just before vessel closure and gas exchange measurements.
Real-time Quantitative RT-PCR (RT-q-PCR)
Total RNA was extracted by TRIsure (Bioline) treatment and purified with 1 unit of DNase (Ambion Turbo DNase kit) to remove genomic DNA. Purified RNA (1 μg) was used for cDNA synthesis. Reverse transcription was performed with random hexamers (Promega) and SuperScript III Reverse Transcriptase (Invitrogen) according to the manufacturer's protocol. Synthesized cDNA was diluted 5-fold and used as a template for RT-q-PCR.
The RT-q-PCR was performed on a Bio-Rad IQ5 system using iQ SYBR Green Supermix (Bio-Rad) with 40 cycles of amplification. Relative changes in gene expression were calculated as described previously (6) using the constitutively expressed rnpB gene as a control. The primers used in this study are summarized in supplemental Table S1.
Quantification of Gly and Ser
Free amino acids were extracted from fresh cyanobacterial cell pellets of 2 ml of culture with 80% ethanol at 65 °C for 3 h. After centrifugation, the supernatants were dried by lyophilization and redissolved in 8 mm Na2HPO4, pH 6.8. The content of Gly and Ser were determined by HPLC as described in Ref. 22.
Protein Analysis
A soluble fraction of proteins was isolated as described (6). Protein complexes were separated using 6–13% gradient blue native PAGE followed by immunoblotting with the Flv3 protein-specific antibody.
RESULTS
Phenotype and Photosynthetic Properties of Synechocystis Δflv1, Δflv3, and Δflv1/Δflv3 Mutant Cells
Comparative growth characteristics of the WT and the Δflv1, Δflv3, and Δflv1/Δflv3 mutant strains were tested in BG11 medium at ambient air. There was no difference between the WT and the single Δflv1 and Δflv3 or the double mutant Δflv1/Δflv3 strains in their growth characteristics under the conditions described above under “Experimental Procedures” (data not shown).
To compare the electron transfer capacities of the WT, Δflv1, Δflv3, and Δflv1/Δflv3 strains, the whole chain photosynthetic electron transfer activity and the PSII activity were monitored. In line with our previous report (6), the Δflv1 and Δflv3 single mutants demonstrated slightly higher PSII activity in the presence of an artificial electron acceptor, but the net photosynthesis rate was 8% lower as compared with the WT (Table 1). The Δflv1/Δflv3 double mutant demonstrated only 89% of the activity from water to NaHCO3 measured for the WT (Table 1). Furthermore, the PSII activity of the Δflv1/Δflv3 mutant was slightly lower, 95% of that in the WT (Table 1).
TABLE 1.
Photosynthetic activities of Synechocystis WT and the mutant cells
The activity of PSII and the net photosynthetic rate were measured as the steady-state oxygen evolution rate in the presence of 2 mm 2,5-dimethyl-p-benzoquinone and 10 mm NaHCO3, respectively. Values are given as a mean ± S.D. from three independent experiments. Dark respiration was monitored by membrane inlet mass spectrometry, and values are given as μmol O2 mg Chl−1 h−1.
| PSII activity | Net photosynthetic activity | Dark respiration | |
|---|---|---|---|
| % | % | ||
| WT | 100 ± 2.4 | 100 ± 1.7 | 10.4 ± 0.6 |
| Δflv1 | 110 ± 3.2 | 92 ± 2.1 | 17.5 ± 1.2 |
| Δflv3 | 105 ± 1.8 | 92 ± 1.5 | 16.1 ± 1.2 |
| Δflv1/Δflv3 | 95 ± 2.4 | 89 ± 1.2 | 13.7 ± 0.7 |
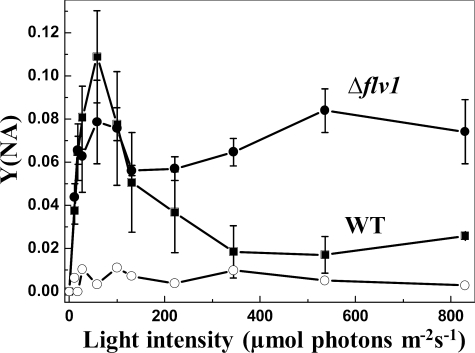
Because Flv1 and Flv3 proteins function in accepting electrons beyond PSI, we next measured the yield of non-photochemical energy dissipation in PSI reaction centers Y(NA) under high CO2 conditions. Fig. 1 demonstrates a typical light response curve for WT with a sharp increase in Y(NA) at very low light intensities, indicating a high acceptor side limitation of PSI due to an incomplete activation of Calvin-Benson cycle, the main terminal electron acceptor. Activation of CO2 fixation with time and increasing light intensity is reflected in a decline in Y(NA). The Δflv1 (Fig. 1), Δflv3 and Δflv1/Δflv3 (data not shown) mutants demonstrated significantly higher Y(NA) parameter with increasing actinic light intensities compared with the WT.
FIGURE 1.
Light response of the acceptor side limitation of PSI, Y(NA). The acceptor side limitation of PSI was recorded from the WT (■) and Δflv1 (●) mutant strain. 0.1 mm methyl viologen (○) was added to Δflv1 cell suspension before the measurement. Values are the mean ± S.D. from three independent experiments.
The results described above to demonstrate the acceptor side limitation of PSI were verified by using methyl viologen as an artificial acceptor of electrons. Addition of methyl viologen to Synechocystis cell suspension before Y(NA) measurements completely eliminated the acceptor side limitation of PSI in the Δflv1 mutant cells (Fig. 1).
Respiration, Photoreduction of O2 and CO2 Uptake in Flv Mutants
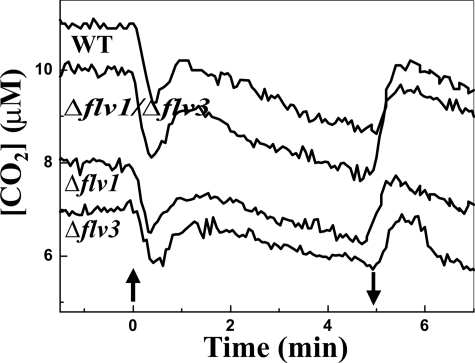
Y(NA) measurements demonstrated an important role for the Flv1 and Flv3 proteins in alleviation of the acceptor side electron pressure in PSI. This could be assigned to the function of the Flv1 and Flv3 proteins in donation of electrons to molecular oxygen in the Mehler reaction. This process might be strongly regulated also by other electron transfer routes. To verify this, the WT and the Flv mutants were subjected to detailed gas exchange measurements. The respiratory O2 uptake was monitored during the dark period, and the photoreduction of O2 as well as the CO2 uptake were measured during the dark-light transition by applying the membrane inlet mass spectrometry gas exchange analysis system (21). All Flv mutants, the Δflv1 (17.5 μmol O2 mg Chl−1 h−1) and Δflv3 (16.1 μmol O2 mg Chl−1 h−1) single mutants as well as the Δflv1/Δflv3 (13.7 μmol O2 mg Chl−1 h−1) double mutant demonstrated increased dark respiration rate as compared with the WT (10.4 μmol O2 mg Chl−1 h−1, Table 1). On the other hand, the WT cells and all of the Flv mutants, Δflv1, Δflv3, and Δflv1/Δflv3, showed very similar CO2 uptake after switching on the actinic light (Fig. 2).
FIGURE 2.
Mass spectrometric measurements of CO2 uptake during dark-light transition. During measurement, the cells were first kept in darkness for 5 min, and thereafter the white light of 500 μmol photons m−2 s−1 was turned on (upward arrow) and off again (downward arrow).
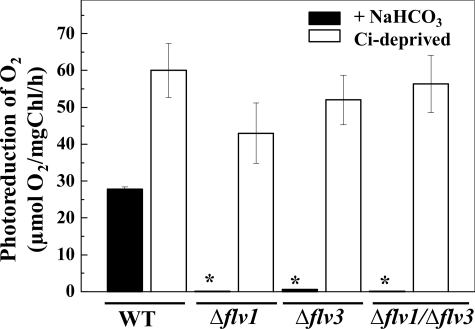
18O2 labeling of the cells was then used to separately analyze the evolution and uptake of O2 during illumination of the cells. In the WT cells, illumination strongly stimulated O2 uptake (28 μmol O2 mg Chl−1 h−1) in the presence of 5 mm NaHCO3 (Fig. 3). Under the same conditions, the Δflv1 and Δflv3 single mutant cells did not show any photoreduction of O2, which is in line with previous studies (Fig. 3) (7). Likewise, the double mutant Δflv1/Δflv3 was not able to consume O2 during illumination in the presence of NaHCO3.
FIGURE 3.
Mass spectrometric measurements of O2 consumption during dark-light transition in the WT, Δflv1, Δflv3, and Δflv1/Δflv3 mutants of Synechocystis. The cells were kept in darkness for 5 min and then illuminated with white light of 500 μmol photons m−2 s−1 for 5 min to measure the uptake of O2. The asterisk represents cells demonstrated only trace amount of 18O2 consumption. White bars, 5 mm NaHCO3 was present in the medium. Black bars, measurements were performed with the cells exposed to Ci deprivation. Values are the mean ± S.D. from three independent experiments.
The above experiments confirmed the involvement of both the Flv1 and Flv3 proteins in the Mehler reaction of Synechocystis. The next question to be addressed was whether there is a competition between electrons from water oxidation to the Mehler reaction, photorespiration, and CO2 fixation. To this end, the cell culture was depleted of CO2, the main terminal electron acceptor of the photosynthetic electron transfer chain. For this purpose, the cells were kept in tightly closed Eppendorf tubes for 4 h. In the absence of dissolved CO2 and without exogenously added bicarbonate (Ci deprivation), the WT cells demonstrated enhanced light-induced O2 uptake compared with that measured in control conditions in the presence of bicarbonate (Fig. 3). Surprisingly, such severe Ci deprivation conditions were found to stimulate the photoreduction of O2 also in the Δflv1 and Δflv3 single mutants. These data were first understood to indicate that the Flv1 or Flv3 protein can function in the Mehler reaction as a homodimer under specific conditions such as Ci deprivation. To test this assumption, we generated the double mutant Δflv1/Δflv3. Intriguingly, the Δflv1/Δflv3 double mutant also demonstrated a similar O2 photoreduction rate under Ci deprivation conditions as the single mutants (Fig. 3), thus excluding the possibility of functional Flv1 or Flv3 homodimers. The similar behavior of both the Flv mutants as well as the WT provided evidence that the O2 photoreduction under Ci deprivation conditions could have an origin different from the Flv1- and Flv3-mediated Mehler reaction.
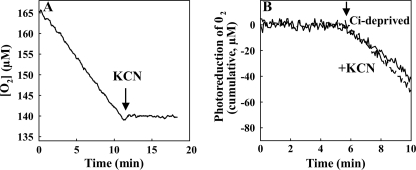
Because the enhancement of O2 photoreduction upon Ci deprivation can, in principle, originate from enhanced function of respiratory terminal oxidases, photorespiration, or electron flux from PSI or stromal components directly to O2 (classical plant-type Mehler reaction), the origin of the O2 photoreduction was further studied by applying specific inhibitors. The addition of KCN, an inhibitor of terminal oxidases, completely abolished dark respiration (Fig. 4A) but did not significantly affect the photoreduction of O2 in the Δflv1/Δflv3 mutant cells (Fig. 4B).
FIGURE 4.
Effect of KCN on dark respiration and photoreduction of O2. Dark respiration (A) and O2 photoreduction (B) were monitored after addition of KCN (final concentration, 1 mm) (dashed line in B) to Ci-deprived Δflv1/Δflv3 cells. Arrays indicate the addition of inhibitor (A) and switching on the actinic light (B). In B, the cumulative O2 uptake curve is calculated from 18O2/16O2 exchange measurements and is presented here after subtraction of the dark O2 uptake rate for better legibility.
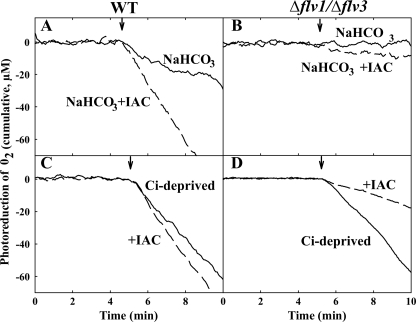
Photoreduction of O2 was next measured in the presence of iodoacetamide (IAC), a widely used inhibitor of CO2 fixation and photorespiration (7, 23). Measurements with cell suspensions supplemented with IAC were first performed in the presence of bicarbonate. In such conditions, the addition of IAC strongly stimulated the rate of O2 photoreduction in WT (Fig. 5A), whereas in the Δflv1 (supplemental Fig. S2A) and Δflv3 (supplemental Fig. S2B) single mutants as well as in the Δflv1/Δflv3 double mutant (Fig. 5B) the stimulation of O2 photoreduction was only modest.
FIGURE 5.
Effect of IAC on photoreduction of O2 in the WT and Δflv1/Δflv3 cells. O2 photoreduction was monitored in the presence of 5 mm NaHCO3 (solid line) and in the presence of both 5 mm NaHCO3 and 8 mm IAC (dashed line) from the WT (A) and Δflv1/Δflv3 mutant cells (B). Similar measurements were performed from the WT (C) and Δflv1/Δflv3 (D) cells after Ci deprivation. Arrays indicate switching on the light. Cumulative O2 uptake curve was calculated from 18O2/16O2 exchange measurements and is presented here after subtraction of dark O2 uptake rate for better legibility.
We next proceeded to compare the effect of IAC on photoreduction of O2 at Ci deprivation conditions. As demonstrated previously in Fig. 3, the WT as well as all the Flv mutant cells showed strong O2 photoreduction at Ci deprivation (Fig. 5, C and D, for WT and Δflv1/Δflv3, respectively). It is conceivable that the Ci deprivation favors the oxygenation of RuBP and thus photorespiratory 2PG metabolism. The addition of IAC to the Ci-deprived WT cell suspension to inhibit the CO2 fixation and photorespiration did not significantly change O2 photoreduction (Fig. 5C). In sharp contrast to the WT, addition of IAC to the Δflv1, Δflv3 (supplemental Fig. S2, C and D, respectively), and Δflv1/Δflv3 double mutant cells abolished ∼75% of O2 photoreduction (Fig. 5D). High sensitivity of O2 photoreduction to IAC, the Calvin-Benson cycle inhibitor, during Ci deprivation, led us to conclude that the Ci-sensitive O2 photoreduction in the Δflv1 and Δflv3 mutants as well as in the Δflv1/Δflv3 double mutant is mainly due to photorespiration, i.e. oxygenase function of Rubisco. Similar results were obtained when cell suspension was supplemented with glycolaldehyde (supplemental Fig. S4), another effective inhibitor of the photosynthetic carbon reduction cycle (24). About 25% of O2 photoreduction in the Δflv1, Δflv3, and Δflv1/Δflv3 mutant cells was insensitive to IAC (Fig. 5D), and this might originate from the electron flux from the PSI complex directly to O2 or from a fraction of Rubisco that was not fully inhibited by the inhibitor. It was also tested that IAC has no effect on the function of terminal oxidases in the dark (Fig. S3).
Photorespiratory Pathway
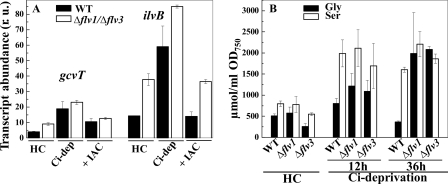
To support the assumption of an activated photorespiratory 2PG cycle in Ci-limited WT and Flv mutant cells, the relative expression level of two genes, gcvT (sll0171) and ilvB (sll1981), encoding the Gly decarboxylase complex T protein and glyoxylate carboligase, involved in the plant-like C2 cycle and bacterial-type glycerate photorespiratory pathways, respectively, were analyzed by RT-q-PCR. The relative transcript abundance of these genes was studied in the WT and Δflv1/Δflv3 mutant cells from three different conditions: (i) high CO2 grown cells where the occurrence of photorespiratory pathway is minimal, (ii) after Ci deprivation treatment where enhanced photorespiratory metabolism is expected, and (iii) after addition of IAC to Ci-deprived cells. Under Ci deprivation conditions, the transcript levels of the gcvT and ilvB genes were ∼2–3-fold higher in both the WT and Δflv1/Δflv3 mutant cells as compared with high CO2 grown cells (Fig. 6A). On the contrary, addition of IAC significantly decreased the transcript level of both genes. It is important to note that even in high CO2 grown cells, the transcripts of gcvT and especially of ilvB genes were much more abundant in the Δflv1/Δflv3 mutant cells as compared with the WT.
FIGURE 6.
Effect of Ci deprivation on photorespiratory markers. A, transcript abundance of the gcvT and ilvB genes in the WT (black bars) and Δflv1/Δflv3 (white bars) cells. Samples were taken from the cells grown in the presence of 3% CO2 (HC), after 12 h shift from HC to Ci deprivation conditions (Ci -dep) and after 4 h treatment with IAC of the samples incubated at Ci deprivation for 8 h (+IAC). r.u., relative units. B, accumulation of Gly and Ser in the WT, Δflv1, and Δflv3 cells. Samples were taken from the cells grown in the presence of 3% CO2, after a 12- and 36-h shift from HC to Ci deprivation conditions.
Gly and Ser, the photorespiratory intermediates, were also monitored in the WT and mutant cells. After 12 h of incubation under Ci deprivation conditions, all cells showed a clear accumulation of Gly and Ser, indicating an enhanced flux into the plant-like C2 photorespiratory cycle. Although WT cells acclimate after longer times, resulting in a decrease in Gly content, the Δflv1 and Δflv3 mutant cells still demonstrated a high accumulation of both amino acids (Fig. 6B). Obviously, severe Ci deprivation does lead to the accumulation of intermediates of the plant-like 2PG pathway despite the slight increase in transcript level of some photorespiratory genes during the active photorespiration.
Dimerization of Flv Proteins
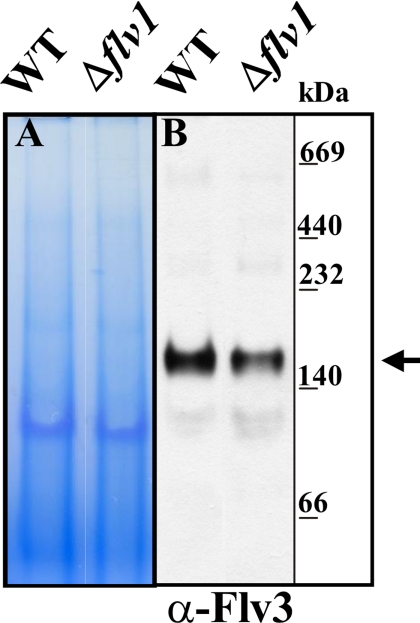
Because the Flv proteins from different organisms have demonstrated a homodimer or homotetramer organization in vitro (3–5), we addressed the question about dimerization of Synechocystis Flv proteins. Both Flv1 and Flv3 are soluble proteins in the cytoplasm (6). To determine whether the Flv1 and Flv3 proteins are dimerized in vivo, the soluble protein fraction was isolated from the WT and Δflv1 mutant cells, subjected to blue native PAGE, and immunoblotted with the Flv3 antibody. As shown in Fig. 7B, the Flv3 antibody in the WT cells recognized a major band above the 140-kDa marker, suggesting that most of the Flv3 proteins are present as a homo- or heterodimer. However, the Flv1 antibody did not recognize the protein in Synechocystis cell extracts but only when overexpressed in Synechocystis or Escherichia coli, thus being in accordance with a very low transcript level of the flv1 gene in the cells (6). Accordingly, this antibody could not be used to analyze the 140-kDa band. The presence of a protein band with similar molecular mass also in the Δflv1 mutant cells indicated that the Flv3 protein is capable of forming homodimers as well. However, the similar behavior of the Δflv1/Δflv3 double mutant and both of the Flv single mutants in the photoreduction of O2 in the presence of bicarbonate and in Ci deprivation, suggested that the Flv3 or Flv1 homodimers are not active in the Mehler reaction in vivo. In line with functional significance of the heterodimer, the accumulation of the Flv3 protein was dependent on the presence of the Flv1 protein, as the amount of the Flv3 protein was significantly down-regulated in the Δflv1 mutant cells (Fig 7B).
FIGURE 7.
Dimerization of the Flv1 and Flv3 proteins in the WT and mutant cells. Soluble fraction of cellular proteins was isolated as described (6). Protein complexes were separated using 6–13% gradient blue native PAGE electrophoresis (A) and immunodetected with Flv3 antibody (B). The arrow indicates the location of the Flv3 protein where it is present as a dimer with molecular mass of ∼140 kDa. The molecular mass of the Flv monomer is 70 kDa. Gels were loaded on a protein basis.
DISCUSSION
Mehler Reaction Is a Strong Sink of Electrons in Cyanobacteria
In plant chloroplasts, the Mehler reaction plays a protective role acting as a sink for excess electrons under severe stress conditions, for example when CO2 fixation is impaired (25). This reaction leads to the production of ROS. As a consequence, plants have during the evolution developed a strong ROS-scavenging system (26). It is intriguing to note that cyanobacteria, the progenitors of chloroplasts, employ a completely different strategy for performing Mehler reactions. The Flv1 and Flv3 proteins, performing the Mehler reaction in cyanobacteria (Fig. 3), can reduce O2 to water without generation any ROS. It has been proposed that the Mehler reaction in cyanobacteria is evolutionarily related to the response of anaerobic bacteria to O2 (7).
Assuming that the O2 photoreduction in the WT Synechocystis cells in the presence of saturated amount of Ci is mainly due to the Mehler reaction operated via Flv1 and Flv3, the cells pass ∼20% of electrons originating from PSI to O2 via the Flv1/Flv3 heterodimer. At Ci deprivation conditions, the O2 photoreduction rate was 50–60% of gross photosynthetic O2 evolution in the WT Synechocystis cells. Because IAC, the inhibitor of CO2 fixation and photorespiration, was found to have a stimulatory effect on photoreduction of O2, to a larger extent in the presence of Ci than in Ci deprivation, the capacity of the Mehler reaction is likely to be very high. This is deduced from the fact that IAC, by inhibiting the CO2 uptake in the presence of Ci and suppressing possible electron flux via photorespiration under the Ci deprivation, stimulates Mehler reaction to a larger extent in the WT. Thus, the Mehler reaction seems to function as an efficient sink of electrons and thereby dissipates excess energy in the photosynthetic apparatus of Synechocystis. Nevertheless, it is likely that cyanobacteria with efficient CO2 concentrating mechanism only seldom use their Mehler reaction in its full capacity.
Even though dimerization is a general feature of Synechocystis Flv proteins, only the Flv1/Flv3 heterodimer was found to be a physiologically functional form in the Mehler reaction in vivo. A significant decrease in the amount of Flv3 in the Δflv1 mutant also suggests that the stability of the Flv1 and Flv3 proteins is co-regulated. We do not, however, exclude the possibility that homodimers of Flv1 and Flv3 might be formed at least in the mutant background that could have another, still unknown function in cells.
Evidence for Functional Photorespiratory Gas Exchange in Cyanobacteria
In addition to the Mehler reaction in WT cells, it was intriguing to note that the Flv mutants are also capable to direct 40–60% of electrons from the photosynthetic electron transfer chain to photoreduction of O2. At first glance, these results are striking and even contradictory. It should be noted, however, that such strong photoreduction of O2 was recorded only at severe limitation of Ci under conditions where the WT efficiently directs electrons mainly to the Mehler reaction. Indeed, there is compelling evidence that the mutant strains with inactivated flv1 and/or flv3 gene do not perform light-induced O2 uptake when Ci is present as a terminal electron acceptor (Fig. 3) (7). Therefore, significant O2 photoreduction under severe Ci deprivation in both the Δflv1 and Δflv3 mutant cells as well as in the double mutant must have a different origin.
In all cyanobacteria, two partially overlapping photorespiratory pathways, one similar to plant photorespiratory metabolism and the other similar to bacterial glycerate pathway, have been predicted from in silico analyses (19). A third metabolic route, the decarboxylation pathway, was suggested recently by Eisenhut et al. (18). It was hypothesized that the photorespiratory 2PG metabolism is important for distribution of the crucial intermediate glyoxylate for the synthesis of metabolic precursors and biomass. Recent computational simulations of the Synechocystis primary metabolism demonstrated that the majority of Gly and Ser originate from photorespiratory 2PG metabolism at photoautotrophic growth. Only under dark conditions, the much lower glyoxylate demand may be alternatively fulfilled by proline catabolism (27).
Cyanobacteria are evolutionarily the first prokaryotes performing water oxidation, which resulted in high intracellular O2 level. A strong focus during evolution of oxygenic photosynthetic organisms has been on preventing the damages of self-generated oxidative environment. Additionally, in nature cyanobacteria are often exposed to Ci limitation (28) conditions (for instance, acidic water, low mixing, cyanobacterial mats, etc.), and this would favor the cells to perform photorespiration at higher rates. It is conceivable that the efficient function of the Flv1 and Flv3 proteins in the Mehler reaction in cyanobacteria reduces but does not eliminate the importance of photorespiration in dissipation of excess energy under low Ci conditions. The application of 18O2 labeling and the Ci deprivation conditions to the mutant cells without Mehler background clearly demonstrated that the Flv-based Mehler reaction is not the only sink for electrons in Ci deprivation. Indeed, a considerable amount of electrons under such conditions are directed to photorespiratory 2PG metabolism in the Δflv1, Δflv3, and Δflv1/Δflv3 mutants. Moreover, our results do not exclude but rather also support a possibility that in WT Synechocystis cells, a certain amount of electrons is directed to the detoxification of the oxygenation product 2PG of Rubisco under specific conditions, such as Ci deprivation. In line with our present results, an interaction of the Flv3 protein with photorespiration was suggested to be crucial based on the high light-sensitive phenotype of the double mutant Δflv3/ΔgcvT (20).
Evolutionary Implications on Elimination of Cyanobacterial-type and Development of Plant-type Mehler Reaction
Genes encoding the Flv1 and Flv3 type proteins have been found in sequenced genomes of all cyanobacteria as well as in green algae and mosses (6). During evolution of higher plants, the Flv-based Mehler reaction, with water as a direct end product, was lost and became replaced with the plant-type, classical Mehler reaction, which produces ROS, and evolved in concert with an efficient ROS-scavenging system. The plant-type Mehler is unlikely to support significant electron flow, with the estimated values being less than 10% (11), and its function is clearly limited as an electron sink under severe stress conditions. In eukaryotic photosynthetic organisms, the excess energy dissipation and adjustment of the NADPH/ATP ratio is in close communication with mitochondria, which might in some cases divert excess reducing power into (distant) O2 consumption (29). It is also likely that the elimination of Flv proteins in higher plant chloroplasts was closely related to the movement of life from water to the land. Life in the atmosphere affords intensive gas diffusion, thus avoiding overaccumulation of O2 in photosynthetic cells and probably making the Flv proteins dispensable. It is conceivable that in higher plants, the regulation of the redox poise in chloroplasts by cyclic electron flow around PSI together with efficient non-photochemical quenching and light-harvesting complex II phosphorylation is enough to provide sufficient photoprotection (30). In aquatic or humid environments, gas diffusion is slower; therefore, a direct scavenging of O2 via the Flv proteins and without formation of ROS is probably more important for efficient carboxylation of Rubisco. Green algae and mosses represent evolutionary intermediates. Their dissipation of excess energy, for instance by the non-photochemical quenching system, resembles that of higher plants (31–33), but they still harbor the genes involved in the Flv-type Mehler reaction (6). Photorespiratory pathway also functions as an efficient electron sink for dissipation of excess energy in C3 plants, particularly under limiting CO2 conditions, and accordingly plays a crucial role also in high light acclimation of C3 plants (34, 35). In cyanobacteria, on the contrary, the concerted function of the Flv proteins has the most decisive role in dissipation of excess energy in Ci deprivation and apparently also during dark-light transitions.
Supplementary Material
Acknowledgments
We thank Dr. N. Battchikova for fruitful discussions and K. Michl for amino acid analyses. Professors A. Kaplan and T. Ogawa are thanked for kindly providing us with the Flv1 and Flv3 knock-out mutants.
This work was supported by Academy of Finland Center of Excellence Project 118637, the European Union Project Solar-H2 (FP7 Contract 212508), CNRS/Japan Science and Technology Agency (Program “Structure and Function of Biomolecules: Response Mechanism to Environments”), and the Nordic Energy Research Program (Project Nordic BioH2). This work was also supported by the HélioBiotec platform (funded by the European Union (European Regional Development Fund)), the Région Provence Alpes Côte d'Azur, the French Ministry of Research, and the Commissariat à l'Energie Atomique.

The on-line version of this article (available at http://www.jbc.org) contains supplemental Table S1 and Figs. S1–S4.
- Flv
- A-type flavodiiron proteins
- Ci
- inorganic carbon
- ROS
- reactive oxygen species
- RT-q-PCR
- real-time quantitative RT-PCR
- Chl
- chlorophyll
- IAC
- iodoacetamide
- LHCII
- light-harvesting complex
- PSI
- photosystem I
- PSII
- photosystem II
- 2PG
- 2-phosphoglycolate
- Rubisco
- ribulose-1,5-bisphosphate carboxylase/oxygenase.
REFERENCES
- 1. Vicente J. B., Justino M. C., Gonçalves V. L., Saraiva L. M., Teixeira M. (2008) Methods Enzymol. 437, 21–45 [DOI] [PubMed] [Google Scholar]
- 2. Vicente J. B., Testa F., Mastronicola D., Forte E., Sarti P., Teixeira M., Giuffrè A. (2009) Arch. Biochem. Biophys. 488, 9–13 [DOI] [PubMed] [Google Scholar]
- 3. Di Matteo A., Scandurra F. M., Testa F., Forte E., Sarti P., Brunori M., Giuffrè A. (2008) J. Biol. Chem. 283, 4061–4068 [DOI] [PubMed] [Google Scholar]
- 4. Frazão C., Silva G., Gomes C. M., Matias P., Coelho R., Sieker L., Macedo S., Liu M. Y., Oliveira S., Teixeira M., Xavier A. V., Rodrigues-Pousada C., Carrondo M. A., Le Gall J. (2000) Nat. Struct. Biol. 7, 1041–1045 [DOI] [PubMed] [Google Scholar]
- 5. Vicente J. B., Gomes C. M., Wasserfallen A., Teixeira M. (2002) Biochem. Biophys. Res. Commun. 294, 82–87 [DOI] [PubMed] [Google Scholar]
- 6. Zhang P., Allahverdiyeva Y., Eisenhut M., Aro E. M. (2009) PLoS One 4, e5331 [DOI] [PMC free article] [PubMed] [Google Scholar]
- 7. Helman Y., Tchernov D., Reinhold L., Shibata M., Ogawa T., Schwarz R., Ohad I., Kaplan A. (2003) Curr. Biol. 13, 230–235 [DOI] [PubMed] [Google Scholar]
- 8. Mehler A. H. (1951) Arch. Biochem. Biophys. 33, 65–77 [DOI] [PubMed] [Google Scholar]
- 9. Asada K., Kiso K., Yoshikawa K. (1974) J. Biol. Chem. 249, 2175–2181 [PubMed] [Google Scholar]
- 10. Asada K. (2006) Plant Physiol. 141, 391–396 [DOI] [PMC free article] [PubMed] [Google Scholar]
- 11. Badger M. R., von Caemmerer S., Ruuska S., Nakano H. (2000) Philos Trans. R. Soc. Lond B. Biol. Sci. 355, 1433–1446 [DOI] [PMC free article] [PubMed] [Google Scholar]
- 12. Artus N. N., Somerville S. C., Somerville C. R., Lorimer G. H. (1986) CRC Crit. Rev. Plant Sci. 4, 121–147 [Google Scholar]
- 13. Badger M. R., Price G. D. (2003) J. Exp. Bot. 54, 609–622 [DOI] [PubMed] [Google Scholar]
- 14. Kaplan A., Reinhold L. (1999) Annu. Rev. Plant Physiol. Plant Mol. Biol. 50, 539–570 [DOI] [PubMed] [Google Scholar]
- 15. Price G. D., Badger M. R., Woodger F. J., Long B. M. (2008) J. Exp. Bot. 59, 1441–1461 [DOI] [PubMed] [Google Scholar]
- 16. Battchikova N., Eisenhut M., Aro E. M. (2010) Biochim. Biophys. Acta, in press [DOI] [PubMed] [Google Scholar]
- 17. Colman B. (1989) Aquat Bot. 34, 211–231 [Google Scholar]
- 18. Eisenhut M., Ruth W., Haimovich M., Bauwe H., Kaplan A., Hagemann M. (2008) Proc. Natl. Acad. Sci. U.S.A. 105, 17199–17204 [DOI] [PMC free article] [PubMed] [Google Scholar]
- 19. Bauwe H., Hagemann M., Fernie A. R. (2010) Trends Plant Sci. 15, 330–336 [DOI] [PubMed] [Google Scholar]
- 20. Hackenberg C., Engelhardt A., Matthijs H. C., Wittink F., Bauwe H., Kaplan A., Hagemann M. (2009) Planta 230, 625–637 [DOI] [PMC free article] [PubMed] [Google Scholar]
- 21. Dimon B., Gans P., Peltier G. (1988) Methods Enzymol. 167, 686–691 [Google Scholar]
- 22. Hagemann M., Vinnemeier J., Oberpichler I., Boldt R., Bauwe H. (2005) Plant Biol. 7, 15–22 [DOI] [PubMed] [Google Scholar]
- 23. Wildner G. F., Henkel J. (1976) Biochem. Biophys. Res. Commun. 69, 268–275 [DOI] [PubMed] [Google Scholar]
- 24. Miller A. G., Canvin D. T. (1989) Plant Physiol. 91, 1044–1049 [DOI] [PMC free article] [PubMed] [Google Scholar]
- 25. Johnson X., Wostrikoff K., Finazzi G., Kuras R., Schwarz C., Bujaldon S., Nickelsen J., Stern D. B., Wollman F. A., Vallon O. (2010) Plant Cell 22, 234–248 [DOI] [PMC free article] [PubMed] [Google Scholar]
- 26. Foyer C. H., Noctor G. (2000) New Phytol. 146, 359–388 [Google Scholar]
- 27. Knoop H., Zilliges Y., Lockau W., Steuer R. (2010) Plant Physiol. 154, 410–422 [DOI] [PMC free article] [PubMed] [Google Scholar]
- 28. Talling J. F. (1985) in Inorganic Carbon Uptake by Aquatic Photosynthetic Organisms (Berry W. J. ed) American Society of Plant Physiologists, pp. 403–420, Rockville, MD [Google Scholar]
- 29. Noguchi K., Yoshida K. (2008) Mitochondrion 8, 87–99 [DOI] [PubMed] [Google Scholar]
- 30. Tikkanen M., Grieco M., Aro E. M. (2011) Trends Plant Sci. 16, 126–131 [DOI] [PubMed] [Google Scholar]
- 31. Bonente G., Passarini F., Cazzaniga S., Mancone C., Buia M. C., Tripodi M., Bassi R., Caffarri S. (2008) Photochem. Photobiol. 84, 1359–1370 [DOI] [PubMed] [Google Scholar]
- 32. Alboresi A., Gerotto C., Giacometti G. M., Bassi R., Morosinotto T. (2010) Proc. Natl. Acad. Sci. U.S.A. 107, 11128–11133 [DOI] [PMC free article] [PubMed] [Google Scholar]
- 33. Peers G., Truong T. B., Ostendorf E., Busch A., Elrad D., Grossman A. R., Hippler M., Niyogi K. K. (2009) Nature 462, 518–521 [DOI] [PubMed] [Google Scholar]
- 34. Osmond C. B. (1981) Biochim. Biophys. Acta 639, 77–98 [Google Scholar]
- 35. Kozaki A., Takeba G. (1996) Nature 384, 557–560 [Google Scholar]
Associated Data
This section collects any data citations, data availability statements, or supplementary materials included in this article.


