

Abstract
Six novel inhibitors of Vibrio harveyi chitinase A (VhChiA), a family-18 chitinase homolog, were identified by in vitro screening of a library of pharmacologically active compounds. Unlike the previously identified inhibitors that mimicked the reaction intermediates, crystallographic evidence from 14 VhChiA-inhibitor complexes showed that all of the inhibitor molecules occupied the outer part of the substrate-binding cleft at two hydrophobic areas. The interactions at the aglycone location are well defined and tightly associated with Trp-397 and Trp-275, whereas the interactions at the glycone location are patchy, indicating lower affinity and a loose interaction with two consensus residues, Trp-168 and Val-205. When Trp-275 was substituted with glycine (W275G), the binding affinity toward all of the inhibitors dramatically decreased, and in most structures two inhibitor molecules were found to stack against Trp-397 at the aglycone site. Such results indicate that hydrophobic interactions are important for binding of the newly identified inhibitors by the chitinase. X-ray data and isothermal microcalorimetry showed that the inhibitors occupied the active site of VhChiA in three different binding modes, including single-site binding, independent two-site binding, and sequential two-site binding. The inhibitory effect of dequalinium in the low nanomolar range makes this compound an extremely attractive lead compound for plausible development of therapeutics against human diseases involving chitinase-mediated pathologies.
Keywords: Carbohydrate-binding Protein, Enzyme Inhibitors, Enzyme Mechanisms, Enzyme Structure, High Throughput Screening (HTS), Inflammation, Protein Chemistry, Protein-Drug Interactions
Introduction
Family-18 chitinases (EC 3.2.1.14) are enzymes that catalyze the degradation of chitin, a homopolymer of β-(1,4)-linked N-acetylglucosamine that is the major structural component of crustaceans and arthropod shells and the cell walls of fungi. The enzymes are present in various organisms ranging from bacteria to animals, and their physiological functions depend on the structural roles of chitin substrates in different species. The catalytic domain of the known family-18 chitinases consists of an (α/β)8-barrel fold with a long, deep substrate-binding cleft containing six binding subsites −4, −3, −2, −1, +1, and +2, with the cleavage site located between subsites −1 and +1 (1–4). The enzymes catalyze reactions through the “substrate-assisted” mechanism (5), the essential steps of which are the stabilization of the oxazolinium intermediate by its own N-acetamido group and the retention of the β-glycone configuration after the resultant bond cleavage.
In recent years, family-18 chitinases have received much attention as therapeutic targets for certain human infectious and inflammatory diseases. Malaria, the first well demonstrated example, accounts for 300–500 million cases worldwide, from which approximately one million die annually, according to a World Health Organization report. The cause of malaria is the Plasmodium parasite. During the reproductive stage of their complex life cycles, the zygotes (so-called ookinetes) produce significant levels of chitinases to penetrate the chitin-containing wall of the mosquito midgut (6). This stage of development is crucial because it allows the parasites to be repetitively transmitted from mosquitoes to humans. Disruption of the transmission pathway by chitinase inhibitors could open up new avenues to control epidemic waves of malaria in high risk regions.
Paradoxically, although chitin does not exist in mammals, a family-18 acidic mammalian chitinase (AMCase)4 has been described in the serum of patients with asthma and allergic diseases (7, 8). However, the mechanisms underlying the pathogenesis of asthma related to the up-regulation of AMCase are not clearly understood. Biochemical and immunochemical studies in a mouse asthma model suggested that the AMCase may act as a selective activator of Th-2/IL-13-induced inflammatory responses (9). Hence, inactivation of AMCase activity by high potency inhibitors could offer a solution for treatment of asthma, as well as other forms of Th-2/IL-13-mediated pathology.
A number of chitinase inhibitors have been reported recently. The pseudotrisaccharide allosamidin, a natural product isolated from Streptomyces sp., was the first candidate to be identified (10–12). Although allosamidin and its derivatives are highly potent, with dissociation constants in the nanomolar to micromolar range, and active against all family-18 chitinases (10, 13–18), their complex chemistry and limited availability make them unsuitable for pharmaceutical applications. As an alternative, peptide-derived compounds have been a focal point of chitinase-based drug development after two cyclopentapeptides, argifin and argadin, were isolated from fungal strains FTD-0668 and FO-7314, respectively (19, 20). Argadin exhibited high affinity inhibition, with an IC50 of 150 nm against Luciliacuprina chitinase, 0.5 μm against Aspergillus fumigatus ChiB1 (AfChiB1), and 13 nm against human chitotriosidase and with a Ki of 20 nm against SmChiB (10, 21–23). Because the high affinity suggests that pharmaceutical use might be possible, a series of argadin/argifin derivatives were further generated (24–28). One of the synthesized argifin analogs, referred to as MeTyr(Bn) for MePhe mutation, showed the highest affinity, with an IC50 of 11 nm toward AfChiB1 (25).
In parallel, other peptidic derivatives were evaluated, for instance CI-4 (cyclo-(l-Arg-d-Pro)) (29), disulfide-cyclized peptides (30), and a bifunctional peptidic aspartic protease inhibitor (31). These recognized compounds interacted with family-18 chitinases at submicromolar to micromolar concentrations. A high throughput screening technique was also applied to a drug library and identified pentoxifyllin as the most active inhibitor, with a Ki of 37 μm toward AfChiB1 (32). In a selection of ∼50,000 xanthine derivatives from a virtual library screen, C2-dicaffeine was the most active, with a Ki of 2.8 μm toward the same chitinase (33). The most recently reported chitinase inhibitors are chitobiose and chitotriosethiazoline analogs, which had a Ki range of 0.15–30 μm toward SmChiA (34).
All of the above-mentioned reports emphasize the ongoing search for the most effective chitinase inhibitors. However, difficulties arising from the limited availability of the starting materials, complex chemistry, and/or insufficient affinity of the target compounds still hamper the current development of anti-chitinase agents that could satisfactorily meet pharmaceutical needs. Here, we describe the identification of nonpeptidic, easily produced, and highly effective chitinase inhibitors using high throughput screening of a commercially available drug library. All of the identified species, with the exception of pentoxifyllin, are novel in their reported activity against a family-18 chitinase (Vibrio harveyi chitinase A or VhChiA). The crystallographic data revealed two hydrophobic inhibitor binding areas in the substrate-binding cleft. The arrangement of these binding areas implied different binding mechanisms for the inhibitors, which could be confirmed by isothermal titration microcalorimetry. Dequalinium, the most promising compound obtained from this study, had a Ki of 70 nm. From the chemical biology point of view, this compound could serve as an excellent scaffold for generation of effective agents against human diseases including malaria, asthma, and inflammation.
EXPERIMENTAL PROCEDURES
Recombinant Expression and Purification
VhChiA mutant W275G was obtained by PCR-based site-directed mutagenesis as described previously (35). The recombinant wild-type and mutant W275G were expressed in Escherichia coli M15 cells as described by Pantoom et al. (36). Cells expressing recombinant chitinase were harvested and disrupted in an HC-2000 microfluidizer (Microfluidics, Lampertheim, Germany). For purification, the crude enzyme obtained after final centrifugation was purified using affinity chromatography on a gravity-fed nickel-nitrilotriacetic acid-agarose column (5 × 1 ml; Qiagen GmbH, Hilden, Germany), followed by a HisTrapTM HP column (5 × 1 ml; GE Healthcare, Munich, Germany) connected to an ÄKTA purifier system (GE Healthcare). The eluted fractions were pooled and then subjected to several rounds of membrane centrifugation using Vivaspin-20 ultrafiltration membrane concentrators (Mr 10,000 cut-off; Vivascience AG, Hannover, Germany) for a complete removal of imidazole and for concentrating the proteins.
Inhibitor Screening and Determination of Dose-Response Curves
Potential chitinase inhibitors were screened from the Library of Pharmacologically Active Compounds (Sigma-Aldrich Chemie GmbH, Munich, Germany). The general set-up of the primary screen is described elsewhere (37). Here, 5 μl of 1 mm substrate pNP-GlcNAc2 were added to 5 μl of VhChiA wild-type preincubated with 200 μm of the respective inhibitor. The buffer consisted of 50 mm Tris-HCl, pH 7.5, containing 50 mm NaCl, 1 mm dithioerythritol, and 0.025% (v/v) Nonidet P-40. Formation of pNP was detected by absorbance measurement at 405 nm (A405). The reaction rate without enzyme was taken as 0% activity and without inhibitor to 100% activity. Dose-response curves of inhibitors obtained from initial screen were carried out using the pNP assay (36) or DMAB assay (38). For the pNP assay, a 2-fold dilution series of different inhibitors was incubated for 10 min with 0.25 μm VhChiA in 20 mm Tris-HCl buffer, pH 7.5, containing 100 mm ammonium acetate and 0.025% (v/v) Triton X-100 before the substrate was added to a final concentration of 125 μm. The progress of the reaction (A405) was monitored continuously at 27 °C for 16 min in a TecanGENios Pros Microplate Reader (MTX Lab Systems Inc., Vienna, VA). The slope obtained from a linear portion of the reaction progress curve was taken as the initial velocity using the standard calibration curve of pNP (8–500 μm). It is worth mentioning that the VhChiA mutant W275G exhibited very low activity toward pNP-GlcNAc2 but reasonable activity toward pNP-GlcNAc3. Hence, pNP-GlcNAc3 was used as the substrate of choice for determining the IC50 values of W275G mutant.
Dose-response curves were also obtained from the DMAB method (38), by which N-acetylhexosamines are quantitatively determined from chitohexaose hydrolysis. With this assay, the reaction mixture was titrated with a 2-fold dilution series of each inhibitor to obtain a concentration range of 1 nm to 1 mm. The reaction mixtures (500 μl), containing 500 μm substrate, 50 μg of native enzyme or 200 μg of mutant, and 100 mm sodium acetate buffer, pH 5.5, were incubated at 37 °C in a Thermomixer Comfort (Eppendorf AG, Hamburg, Germany). After 15 min of incubation, the reaction was terminated by heating at 100 °C for 5 min. A 200-μl aliquot was then taken for spectophotometric assay of the released amino sugars, absorbance at 585 nm being converted to molar concentrations using a standard calibration curve of GlcNAc2 (0–875 μm). The dose-response curves were constructed from the nonlinear four-parameter algorithmic fit available in the Prism v5.0 software (GraphPad Software Inc., San Diego, CA), yielding IC50 values and Hill coefficients.
Fluorescence Quenching Assay
The purified wild-type VhChiA (0.25 μm) was titrated with different concentrations of the inhibitors (5 nm to 100 μm) in 20 mm Tris-HCl, pH 8.0, at 25 °C. Changes in intrinsic tryptophan fluorescence were monitored directly in a LS-50 fluorescence spectrometer (Perkin-Elmer (Thailand) Ltd., Bangkok, Thailand). The excitation wavelength was 295 nm, and emission intensities were collected over 300–450 nm with the excitation and emission slit widths being kept at 5 nm. Each protein spectrum was corrected for the buffer spectrum. The fluorescence intensity data were analyzed using the nonlinear regression function available in Prism v5.0.
Isothermal Titration Microcalorimetry (ITC)
ITC experiments were carried out using the ITC-200 system (MicroCal Inc., Northampton, MA). Measurements of the wild-type VhChiA were carried out at 25 °C with stirring speed 1,000 rpm. After the baseline was set with distilled water, 4 μl of 250 μm dequalinium (DEQ) or 500 μm SAN and PEN was injected into the 300-μl calorimeter cell containing 20 mm sodium acetate buffer, pH 5.5, 0.025% (w/v) Triton X-100, and 25 μm enzyme. The injections were repeated 10 times over 90-s intervals. The background was measured by injecting the inhibitor into the cell containing only buffer. ITC experiments with the mutated VhChiA were performed as described for the wild-type enzyme but with higher concentrations of the reaction components (100 μm of the mutated enzyme, 1 mm DEQ, or 2 mm SAN and PEN). All of the measurements of mutant W275G were conducted at 18 °C. After subtracting the background, titration curves were fitted using the algorithms supplied by Microcal v7.0. The measured enthalpy changes as a function of ligand concentrations can give information on the binding enthalpy (amplitude and direction of the change), binding affinity (maximal slope of the sigmoid part), and number of sites (position of the inflection point relative to the protein concentration). For Scheme 2 fits, we fixed N1 = N2 = 1. The parameter values listed in supplemental Table S2 are derived from multiparameter fitting, using the simplest theoretical models that adequately fit the data; nevertheless, they must be viewed with caution, because the parameters cannot be fitted independently. When one of these correlated parameters is fixed at an arbitrary value, the other parameters may adjust to new values without decreasing the quality of the fit. Gibb's free energy (ΔG) and the entropy change (ΔS) can be calculated from the enthalpy change (ΔH) and the binding constant K: ΔG = ΔH − TΔS = −R × T × ln(K), where R represents the gas constant (1.98 cal K−1 mol−1), and T is the absolute temperature in Kelvin (K).
SCHEME 2.

Two independent sites.
Crystallization Screenings and Structure Determination
Crystallization screenings of the native VhChiA were performed at 22 °C using the commercially available Crystal Screen HR2–110, Crystal Screen HR2–112 (Hampton Research, Riverside, CA), and JBScreen HTS II (Jena Bioscience GmbH, Jena, Germany). Crystals were obtained by the vapor diffusion method in a hanging drop, followed by microseeding under two different conditions: 1) 16% (w/v) PEG 4000, 21% (v/v) propanol, 0.1 m sodium citrate, pH 5.6; and 2) 1.1 m ammonium sulfate, 0.1 m Tris-HCl, pH 8.5. Crystallization of the mutant W275G was carried out using the same techniques as described for the native enzyme. However, single crystals were obtained only in 26% (w/v) PEG 4000, 0.2 m ammonium acetate, and 0.1 m sodium acetate, pH 5.5.
Crystal complexes of wild-type VhChiA with the inhibitors DEQ and propentofylline (PRO) were obtained by co-crystallization using 400 μm inhibitors, whereas the complexes with other inhibitors were obtained by soaking the native crystals with 5–15 mm inhibitors in the corresponding mother liquor at 22 °C for 16 h. All of the crystal complexes of mutant W275G were obtained by soaking as described for wild type. Afterward, the crystals were immersed in a cryoprotectant consisting of the reservoir solution supplemented with 10% (v/v) glycerol for 5–10 s and then picked up in a loop and frozen in liquid nitrogen. For some of the crystals, blocking the cryostream for a few seconds (annealing) improved the diffraction quality considerably.
X-ray diffraction data of most of the chitinase complexes were collected at the beamline PX-II of the Swiss Light Source in Villigen, Switzerland, using a MAR Research CCD detector. Some data sets were collected on a BrukerMicrostar rotating anode generator (Bruker AXS GmbH, Karlsruhe, Germany) equipped with Bruker Helios and Xenocs Fox mirrors and a MAR Research DTB image plate detector. Initial data processing was conducted with the program XDS (39). For crystals with a previously unknown space group, molecular replacement was employed to obtain phase information using the program MOLREP from the CCP4 suite (40). The structure of the apoform of native VhChiA was solved using the published structure of the VhChiA mutant E315M in complex with GlcNAc6 (Protein Data Bank code 3b9a) as a search model. Subsequently, the final model of native VhChiA was employed to obtain the phases of all data sets of the VhChiA-inhibitor complexes. Rigid body fitting followed by restrained refinement were performed in REFMAC, available in the CCP4 suite. Model building was done in COOT (41). The molecular topologies of the inhibitors were created using Maestro and the PRODRG server (42), and the inhibitors were modeled into the corresponding 2Fo − Fc and Fo − Fc maps. The further refinement resulted in the final models described in supplemental Table S1. The geometry of each final model was verified by PROCHECK (43) and WHATCHECK (44). The figures were generated using PYMOL and LIGPLOT (45).
RESULTS
Screening of Chitinase Inhibitors
Screening of compound libraries requires an assay that is technically simple and not prone to artifacts. Chitinase activity was monitored spectrophotometrically from the generation of p-nitrophenolate from the substrate pNP-GlcNAc2 (or pNP-GlcNAc3 in the case of W275G) (hereafter referred to as the pNP assay). Because the phenolate anion is only formed at neutral or basic pH values, the enzymatic hydrolysis was performed at pH 7.5, although the optimum pH for VhChiA is between 5.5 and 6.0. Screening of the Sigma Library of Pharmacologically Active Compounds identified nine hits of 1,280. These were subjected to further screening using the DMAB assay, which measures the amount of amino sugars (here only N-acetylhexosamines) liberated from the substrate GlcNAc6. Two of the initial hits were not confirmed, because their IC50 values were above 1 mm. Other compounds, including chelerythrine (CHE), dequalinium (DEQ), idarubicin (IDA), 2-(imidazolin-2-yl)-5-isothiocyanatobenzofuran (IMI), pentoxifyllin (PEN), propentofylline (PRO), and sanguinarine (SAN), displayed IC50 values less than 100 μm in both DMAB and pNP assays. These were selected for more detailed studies. The IC50 values obtained from both assays are listed in Table 1; for chemical structures, see Fig. 1. It is notable that PRO and PEN are methylxanthine derivatives, and PEN is the only compound that had been reported earlier to inhibit the AfChiB1 activity, with a Ki of 37 μm (IC50 = 126 μm) (32).
TABLE 1.
IC50 and KD values obtained from four different assays
IC50 values (μm) were derived from competition studies with 100 μm chitohexaose in the DMAB assay, the pNP assay with pNP-GlcNAc2, and the pNP assay with pNP-GlcNAc3. Equilibrium dissociation constants (KD, μm) derived from fluorescence quenching (Fig. 5) are shown. The KD values for wild-type chitinase and the mutant W275G were derived from three-parameter fits of the corresponding ITC experiments assuming one set of sites (Fig. 6, panels A2, B2, C2, and D2, and Scheme 1). The values represent the means ± S.D. from at least three independent sets of the experiments. ND, not determined.
| Inhibitor | WT |
W275G |
||||
|---|---|---|---|---|---|---|
| IC50 |
KD |
KD |
IC50 |
|||
| DMAB | pNP | Fluorescence | ITC | ITC | pNP | |
| DEQ | 3.9 ± 1.1 | 0.4 ± 0.1 | 0.2 ± 0.02 | 0.07 | 37 | 70 ± 28 |
| IDA | 6.4 ± 1.1 | 0.9 ± 0.2 | 0.4 ± 0.02 | ND | ND | 270 ± 33 |
| SAN | 7.6 ± 1.3 | 2.3 ± 0.3 | 0.6 ± 0.02 | 2.3 | 28 | 71 ± 26 |
| CHE | 11 ± 1.1 | 2.2 ± 0.01 | 0.7 ± 0.03 | ND | ND | 95 ± 34 |
| IMI | 21 ± 1.5 | 15 ± 3.2 | 1.0 ± 0.1 | ND | ND | 160 ± 78 |
| PEN | 59 ± 1.2 | 3.5 ± 0.5 | 4.0 ± 0.6 | 4.0 | 600 | 260 ± 21 |
| PRO | 83 ± 1.0 | 3.7 ± 0.9 | 4.7 ± 0.5 | ND | ND | 360 ± 42 |
FIGURE 1.

The chemical structures of potential chitinase inhibitors identified from the Library of Pharmacologically Active Compounds.
Structural Basis of Chitinase-Inhibitor Complexes
To investigate in more detail how the identified inhibitors interact structurally with VhChiA, crystals of wild-type chitinase were grown and then soaked or co-crystallized with the inhibitors as described under “Experimental Procedures.” Our recent structural data (46) had already suggested that Trp-275 and Trp-397 are important for maintaining the molecular interactions with the substrate around subsites +1 and +2. According to the six substrate-binding subsites identified previously for VhChiA by Songsiriritthigul et al. (46), the glycone part is assumed to cover subsites −4, −3, and −2, whereas the aglycone part covers the product sites or subsites +1 and +2. Subsite −1 is not included, because it is located at the bottom of the substrate-binding cleft and did not at all interact with the inhibitors reported in this study.
Site-directed mutagenesis data revealed that both residues are crucial for the binding selectivity toward short chain substrates, such as tetra-, penta-, and hexachitooligosaccharides (35). Therefore, crystallization trials of the previously described mutants (both W275G and W397F) were made. However, only the mutant W275G could be crystallized. The availability of the crystal complexes of W275G helped to evaluate how Trp-275 contributes to the binding affinity of the enzyme to the identified inhibitors.
Crystals of wild-type VhChiA could be obtained from either PEG solution at pH 5.6 or ammonium sulfate solution at pH 8.5 so that solubility problems, encountered with some inhibitors, could be circumvented by choosing the more suitable mother liquor for soaking and/or co-crystallization. The space groups of the wild-type were P21 with two different unit cells, thus allowing detailed analysis of the effect of crystal packing on inhibitor binding. On the other hand, all of the complexes of mutant W275G crystallized in the same space group (P212121) and unit cell as the previously determined VhChiA E315Q mutant (Protein Data Bank code 3b9a) (46). As summarized in supplemental Table S1, the structures of 14 complexes of inhibitors with wild-type and mutant VhChiA were refined with diffraction data collected from a lowest resolution of 2.4 Å for the W275G-IMI complex to the highest resolution of 1.16 Å for the WT-PRO complex. Attempts to obtain the structure of mutant W275G with IDA were made by soaking and co-crystallization; however, crystals obtained by both methods failed to show electron density for this compound. This coincides with the W275G mutant having relatively low affinity for IDA (IC50 = 270 μm) as shown in Table 1. Therefore, W275G-IDA is the only complex structure missing from this study.
In the final models of the wild-type crystals grown in the ammonium sulfate condition, the C-terminal residues starting from Gly-589 and the hexahistidine tag were not observed. In all of the W275G-inhibitor complexes, the C terminus was visible up to Ala-588 or Val-591. In contrast, the wild-type crystals grown in the PEG condition showed clear electron density up to residues 595 or 596, probably because of stabilization of these residues by symmetry-related molecules and/or the PEG-containing buffer. The different crystallization conditions also led to some changes in the orientation of the N-terminal domain relative to the catalytic domain (with hinge bending angles between 6° and 16°) as well as to minor conformational changes in the Val-205 loop of the catalytic domain itself. However, the binding positions of inhibitors soaked into two different crystal forms (DEQ and IMI) are very similar; therefore, no further distinction is made in the following description.
Thorough crystallographic analysis demonstrates that the inhibitors bind to the wild-type chitinase mainly at two locations: one is between Trp-275 and Trp-397 at the aglycone sites (subsites +1 and +2), and the other is near Trp-168 and Val-205 at the glycone sites (subsites −3 and −4). This is illustrated in Fig. 2B, which shows two molecules of SAN in the wild-type enzyme's binding cleft, one at subsites +1 and +2 and the other one at the subsites −4 and −3. The inhibitors IDA, CHE, IMI, PEN, and PRO were bound to the aglycone site of the wild-type enzyme in a more or less similar place with well defined electron densities (Fig. 3). In contrast, the electron densities at the glycone site were always much less well defined, with correspondingly higher temperature factors, than for the inhibitors sandwiched between Trp-275 and Trp-397 at the aglycone site, implying lower affinity binding. For IDA and CHE, no interpretable density was found at the glycone site, whereas PRO and PEN showed either superimposition of multiple binding stances or less well defined aliphatic substituents, respectively. In contrast with the inhibitors mentioned above, a single molecule of DEQ was found in the substrate-binding cleft of the wild-type enzyme (Fig. 2A). DEQ contains two symmetrical 4-amino-2-methylquinolinium head groups connected by a long, flexible C10-linker (Fig. 1). This elongated structure stretches from subsites −3 to +2, thus occupying location “aglycone” with one of the aromatic head groups and location “glycone” with the other head group (Fig. 2A).
FIGURE 2.

Surface representations of the complexes of wild-type enzyme with DEQ (A) and SAN (B) and of the mutant W275G with the same inhibitors DEQ (C) and SAN (D). The protein surface is green with hydrophobic patches shown as yellow surface and yellow stick models of the corresponding residues. The inhibitors are shown in magenta (DEQ) and orange (SAN). The 2Fo − Fc omit map is contoured at 1 σ.
FIGURE 3.

Superimposition of typical wild-type complexes with the identified inhibitors in comparison with chitihexaose (shown in gray with the subsites labeled from −4 to +2). The inhibitors are shown in magenta (DEQ), orange (SAN), and cyan (PEN).
Superimposition of the wild-type structure with bound inhibitors and the substrate GlcNAc6 (Protein Data Bank code 3b9a, chitinase A mutant E315M from V. harveyi; root mean square deviation, 0.34 Å for 456 Cα atoms of the catalytic domains) clearly demonstrates that the inhibitors occupy only the outer part of the substrate-binding cleft covering subsites −4, −3, −2, +1, and +2, whereas the transient sugar (−1GlcNAc) of the bent substrate is embedded deeply at the bottom of the cleft, where the cleavage site is located (Fig. 3). The interactions of all inhibitors with the VhChiA are unique and entirely different from the interactions of the enzyme with the GlcNAc6 substrate; the inhibitors are accommodated in the active site of the enzyme largely through hydrophobic interactions, and only very few potential hydrogen bonds were observed. The detailed interactions between the enzyme, the substrate GlcNAc6, and the inhibitor DEQ as representative example are depicted in the supplemental Fig. S1. This “Ligplot” representation illustrates the extended structure of GlcNAc6, exhibiting a number of hydrogen bonds and hydrophobic interactions with various side chains that surround the multiple binding sites. In marked contrast, the contacts with the inhibitors, such as DEQ, are made up almost exclusively of hydrophobic interactions. As seen in supplemental Fig. S1, the quaternary quinolinium head group located at the aglycone-binding sites was found to interact with the three residues, Trp-275, Trp-397, and Asp-392, whereas its counterpart made contact with a larger number of residues, including Trp-168, Val-205, Thr-276, His-228, and Leu-277.
In contrast with the wild-type enzyme, in the chitinase mutant W275G almost all complex structures showed two inhibitor molecules in location aglycone: one forming aromatic interactions with Trp-397 as in wild type plus another stacked on the first molecule, in exactly in the place that was occupied by the indole ring of Trp-275 in the wild type (Fig. 2D). Thus, two inhibitor molecules are sandwiched between the side chain of Trp-397 and the backbone of a loop containing Gly-321 on the other side. Similar binding modes at the aglycone site were observed with SAN, CHE, and IMI. The electron density is roughly similar for both inhibitors in all of those complexes except CHE where the position distant from Trp-397 had weaker density. Although PEN and PRO both have a xanthine backbone (Figs. 1 and 4, A and B), their interactions with the mutated enzyme are different from each other: two molecules of PEN form a double sandwich with Trp-397 at the aglycone position, with very well defined densities just like the above-mentioned inhibitors. On the other hand, only one molecule of PRO was found stacked to Trp-397 in the aglycone position. This is most likely due to a steric clash of the 7-propyl moiety that protrudes toward the site of the mutation W275G, thus preventing stacking (Fig. 4, B and C).
FIGURE 4.

A and B, details of the interaction of PEN (A) and PRO (B) with the chitinase mutant W275G. PEN is shown in cyan, PRO is in yellow, hydrogen bonds are dashed lines, water molecules are cyan spheres. C, superposition of the two complex structures showing the potential clash of the 7-propyl moiety of PRO that most likely prevents binding of a second PRO molecule.
At the glycone subsites, a weak density, probably corresponding to two or three inhibitor molecules binding in different orientations, was visible only for PEN and PRO (and DEQ, see below). This lack of occupancy around the glycone subsites is most likely explained by backbone changes relative to the wild type caused by crystal packing; in wild type, the loop containing Val-205 forms one “wall” of the glycone side, and Trp-168 is the counterpart on the other side (Fig. 3). In the mutant, the cleft formed between those two residues is more open compared with the wild type, thereby probably weakening the interactions of potentially bound inhibitor molecules (supplemental Fig. S2).
The binding of DEQ to the mutant W275G (Fig. 2C) is remarkable for three reasons: 1) inspection of the 2Fo − Fc and Fo − Fc maps revealed two DEQ molecules in the active site of the enzyme instead of one molecule as observed in wild type (Fig. 2A); 2) the two molecules are located at the opposite sides of the substrate-binding cleft: one is at the aglycone site, whereas the other one sits at and reaches outside the glycone site; and 3) both molecules have adopted completely different conformations: at the aglycone site, the DEQ molecule apparently folds onto itself, allowing one of the quinolinium headgroups to stack against the other, which concomitantly substitutes the eliminated side chain of Trp-275 in a structure reminiscent of the double stack described for two separate inhibitor molecules. The electron density of the first molecule at the aglycone position was very weak for the headgroups and even weaker for the linker. In contrast, the second molecule of DEQ is in open conformation and stretches along the surface of the enzyme starting from subsite (−3), where one aromatic moiety interacts with Trp-168 and Val-205 like the other inhibitors, toward the N-terminal chitin-binding domain. The second aromatic moiety is located close to Trp-231 and Tyr-171, and the strongest density is observed for the linker region of this molecule. In contrast with the other inhibitors, the overall electron density at the glycone sites is more clearly defined than at the aglycone sites. This suggests that the DEQ molecule at the glycone sites may bind with the higher affinity, because it occupies the position between Trp-168 and Val-205, whereas the other DEQ molecule cannot bind in a conformation similar to DEQ in the wild-type enzyme. Thorough inspection of the electron density map indicates that a third DEQ molecule may also bind, outside of the active site and next to Pro-181 at the rear of the catalytic domain (opposite the active site), but the density is very weak, and only the linker region is clearly visible.
Fluorescence Titration
To confirm the results of the pNP and DMAB assays (Table 1), fluorescence quenching spectroscopy was performed to monitor the interactions of the inhibitors with the tryptophan residues located in the active site of VhChiA. Fluorescence titration of the enzyme with different concentrations of inhibitors resulted in significant reduction in the fluorescence intensity at the emission wavelength 330–350 nm, confirming that the tryptophan residues surrounding the active site play an important role in inhibitor binding (Fig. 5). A plot of relative fluorescence (F/F0) as a function of inhibitor concentration fits an exponential decay curve, allowing the equilibrium dissociation constant (KD) of each inhibitor to be calculated (Fig. 5, inset). The binding affinities of the inhibitors obtained from fluorescence quenching are listed in Table 1. The order of relative KD values agreed well with the order of IC50 values determined from the DMAB and pNP assays (Table 1), but their absolute values differ significantly. Therefore, ITC was used as a fourth independent method of measuring inhibitor binding.
FIGURE 5.

Effect of the inhibitors on the intrinsic fluorescence of VhChiA. DEQ, for example, was titrated into 0.25 μm of the purified protein in 20 mm Tris-HCl, pH 8.0. The emission spectra were collected from 300 to 450 nm upon excitation at 295 nm. Binding curves were fitted with a dissociation one-phase exponential decay model: F/F0 = (F0/F0 − NS)e − KD [L0] + NS, where F and F0 refer to the fluorescence intensity in the presence and absence of ligand, respectively; NS is the nonspecific binding that does not dissociate (plateau); L0 is the initial ligand concentration, and KD is the equilibrium dissociation constant.
Affinities and Binding Mechanisms
The structures of enzyme-inhibitor complexes were classified into four different “structural binding modes” (A, B, C, and D) as shown in Fig. 2. The corresponding binding mechanisms were studied using ITC, which generates the corresponding dose-response curves (Fig. 6, with A, B, C, D as in Fig. 2). In mode A (Fig. 2A), one molecule of DEQ binds to the wild-type chitinase molecule through hydrophobic interactions with Trp-168, Val-205, Trp-275, and Trp-397 as seen in the x-ray structure. Fig. 6 (panel A1) shows the corresponding ITC experiment, with DEQ binding to the wild-type chitinase. This method measures the enthalpy changes on increasing the ligand concentrations and thus allows the determination of binding affinities without the bias of potentially different fluorescence changes occurring at different locations in the protein. Fig. 6 (panel A2) is a secondary plot of Fig. 6 (panel A1) with the injection peaks integrated, yielding the enthalpy change as cal mol−1 of injectant, and plotted as a function of the molar ratio of DEQ:VhChiA.
 |
FIGURE 6.

Thermographic binding isotherms (panels A1–D1) with theoretical fits (panels A2–D2) obtained from ITC experiments and the dose-response curves (panels A3–D3) obtained from colorimetric assays. The binding of DEQ and SAN to wild-type chitinase is shown in panels A1–A3 and B1–B3, respectively. In panels A2 and B2, the fitted binding curve assumes a single binding site (Scheme 1); a theoretical curve fitted assuming two independent inhibitor binding sites (Scheme 2) is shown in B2 in gray. The binding of DEQ to the W275G mutant is shown in panels C1–C3. The theoretical fit to Scheme 2 (two independent inhibitor binding sites) is indicated as gray in Fig. 6C2, and the corresponding fit to Scheme 1 is in black. For SAN binding to the W275G mutant (panels D1–D3), the theoretical fit to Scheme 3 (sequential binding) is shown in gray, and the fit to Scheme 1 is shown in black in panel D2.
Analyzing these data according to Scheme 1 confirms a stoichiometry of ∼1 for the number of inhibitor molecules bound per enzyme molecule, ΔH = −8.7 kcal·mol−1 for the enthalpy change and 70 nm for the equilibrium dissociation constant (KD). The corresponding theoretical curve is shown as a solid black line in Fig. 6 (panel A2). The parameters corresponding to the theoretical curves in Fig. 6 are shown in supplemental Table S2.
In mode B (shown for SAN in Fig. 2B), the inhibitors are found in two locations (locations aglycone and glycone), all interacting with almost the same hydrophobic residues as DEQ (supplemental Fig. S1). These locations are relatively far away from each other in the binding cleft and accordingly are randomly accessible by both the inhibitors and the substrates as inferred from the x-ray structure. When a corresponding ITC experiment was performed with SAN (Fig. 6, panel B1) or PEN, Scheme 1 can still fit the data but requires more binding sites (N) as compared with a stoichiometry n = 1 calculated from the independently determined enzyme concentration. This is shown in Fig. 6 (panel B2), where a three-parameter fit for one binding site (black solid line) gave n = 1.3, ΔH = −7.9 kcal·mol−1, and KD = 2.3 μm for SAN. However, Scheme 1 does not correspond to the structural finding of two independent sites so we evaluated reaction Scheme 2, in which the inhibitor can bind either to site 1 (aglycone) as EI or to site 2 (glycone) and form the complex IE. A second inhibitor molecule binding to the nonoccupied site will give the fully saturated complex IEI.
When the data set B2 (SAN) was fitted to Scheme 2, four parameters (two dissociation constants and two enthalpies for the independent sites, with fixed N1 = N2 = 1) had to be varied. Multiparameter fits of these parameters need not be unique because different combinations of parameters might also describe the experimental data. One plausible set of parameters for Scheme 2 is indicated in supplemental Table S2, yielding the gray line in Fig. 6 (panel B2). It does not give a much better fit than Scheme 1 with n = 1.3 (black line in Fig. 6, panel B2) but is more plausible in view of the x-ray structure.
This result is similar to DEQ binding to mutant W275G (mode C, Figs. 2C and 6, panel C2). In both cases, the models of one site (black line in Scheme 1) and two independent sites (gray line, Scheme 2) fit the ITC experiments B2 and C2 equally well. Again, the crystal structure of the mutant complex with DEQ shows two molecules in the active site (Fig. 2C), so that the model with two independent sites is more plausible.
In contrast, the crystal structure of W275G with SAN (Fig. 2D) implies a completely different reaction scheme, in which the two SAN binding sites are not independent. When the first inhibitor molecule has bound, a second SAN molecule may form a stack with the first one, and thus a new binding site is created. Two dependent sites can be described using the sequential reaction model depicted in Scheme 3.
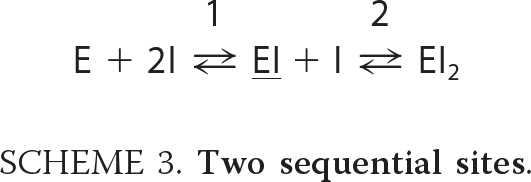 |
The ITC data were fitted successfully to Scheme 3 (gray line in Fig. 6, panel D2; parameters in supplemental Table S2). The same experimental finding could also be fitted to Scheme 2 of two independent sites, but the structural data suggest Scheme 3 as the more likely mechanism.
Although the binding sites are randomly accessible as seen in the x-ray structures, Scheme 3 is a good approximation because it is likely that the two sites have different intrinsic binding affinities; the observation of PRO bound to only one of the two possible “stacked” positions in W275G indicates that this site has a higher affinity (even if it would sterically interfere with another PRO in the same molecule, the positions would be occupied randomly in different molecules in the crystal if the affinities were similar). Thus, the position close to Trp-397 is probably occupied first (EI in Scheme 3), whereupon the second molecule can bind to the presumed “low affinity” site with an increased affinity, indicating cooperative binding.
All of the parameters used for the calculation of the theoretical curves in Fig. 6 are listed in supplemental Table S2. We are well aware that the initial part of Fig. 6 (panels D1 and D2) resembles a dilution artifact and therefore repeated this experiment several times under different conditions, always resulting in the same shape of plot, indicating that more than one binding site must be present, compatible with Scheme 3 above.
The KD values used for the calculation of the ITC experiments are in agreement with the KD values obtained from the fluorescence titrations (Table 1). As already mentioned, they were one order of magnitude lower than the IC50 values obtained from competition studies of chitohexaose hydrolysis. To clarify this point, dose-response curves were also obtained with a low concentration (125 μm) of pNP-GlcNAc2 and varying inhibitor concentrations (Fig. 6, panels A3, B3, C3, and D3). The corresponding IC50 values (Table 1) were similar to the KD values obtained either from fluorescence quenching or isothermal microcalorimetry.
DISCUSSION
Employing a high throughput screening approach, seven compounds were identified as potential chitinase inhibitors (Fig. 1). The identified compounds inhibited VhChiA, a family-18 chitinase homolog; at concentrations in the nanomolar to low micromolar range (Table 1). The crystal structures of 14 VhChiA-inhibitor complexes clearly identified two hydrophobic locations in the active site of the enzyme, where the inhibitors were shown to bind. Fig. 7 is a cartoon representation, summarizing the occupation of the substrate-binding cleft of the wild-type (Fig. 7, left panel) and the W275G mutant (Fig. 7, right panel) by the seven inhibitors. In the wild-type enzyme, the interactions of the first inhibitor molecule at the aglycone location were clearly defined and restricted almost exclusively to the stacking interactions between Trp-397-inhibitor-Trp-275 at subsites +1/+2 (Fig. 2B and supplemental Fig. S1). The interactions of the other molecule at the glycone are patchy along subsites −4 to −3 or subsites −3 to −2, indicating fewer specific interactions and lower affinity. Observation of a second DEQ molecule at the glycone position beyond subsites −3)/−4 in the mutant W275G-DEQ complex (Fig. 2C) corroborated the notion of high binding flexibility around this region. This is in line with a previous report that the interactions between the VhChiA mutant E315M and the substrate GlcNAc6 are strong at the aglycone side and weak at the glycone side (46). This structural arrangement involves binding to independent sites, and the corresponding reaction scheme provides a good fit for the ITC data (Scheme 2 and Fig. 6, panel C2). In the mutant complexes, binding at the glycone site was even weaker than in wild type. Instead, two inhibitor molecules (For SAN, CHE, PEN, and IMI, see Fig. 7, right panel) were found in the aglycone location (Fig. 2D), corresponding to a sequential or cooperative binding mechanism (Scheme 3 and Fig. 6, panel D2). The presence of the first inhibitor molecule close to Trp-397 apparently enhanced binding of the second inhibitor molecule at the location of the (absent) indole moiety of Trp-275. In good agreement with the structural evidence, significant increases in the IC50, to values up to 300 times that of the wild type, emphasize the weakened affinity of the inhibitors as an effect of the missing aromatic side chain of Trp-275 (Table 1).
FIGURE 7.

A summary of VhChiA-inhibitor interactions as revealed by crystallographic evidence. IDA is the missing inhibitor in the substrate-binding cleft of the mutant W275G. Only a single molecule of PRO was found in the aglycone site of mutant W275G instead of two because of a possible steric clash as described in the text. Numbers −4, −3, −2, −1, +1, and +2 represent six substrate-binding subsites of VhChiA. Subsites −4 to −2 are located at the glycone side, subsites +1 and +2 at the aglycone side. Subsite −1 is positioned at the bottom of the catalytic cleft (46). The inhibitor DEQ is indicated in magenta, IDA is in red, SAN is in yellow, CHE is in pink, PEN is in cyan, PRO is in brown, and IMI is in purple. The inhibitor molecules with very weak electron density are indicated as dashed lines.
PEN is the only compound to have been reported previously to be active against AfChiB1 (32). However, there are a few significant differences regarding the interactions between VhChiA-PEN and AfChiB1-PEN. The affinity of AfChiB1 for PEN (Ki = 37 μm) was approximately 19-fold lower than that of VhChiA (Ki = 2 μm). The x-ray structure of the complex of AfChiB1-PEN (Protein Data Bank code 2a3c) shows two bound molecules of PEN: one (PEN1) is sandwiched between Trp-384 (homologous to Trp-540 in VhChiA) and Trp-137 (homologous to Trp-275 in VhChiA), and the other one (PEN2, which is present in the Protein Data Bank entry but not mentioned in the corresponding publication (32)) stacks on the other side of Trp-137. In this structure, the Trp-137 of AfChiB1 is rotated by almost 90° relative to the corresponding Trp-275 in VhChiA (and also to Trp-137 in the other AfChiB1-inhibitor complexes described in Ref. 32). In contrast, the two molecules of PEN in our structure cover a larger area (subsites −4, −3, −2, +1, and +2) and bind in a very different manner: one PEN molecule sits in almost the same place as PEN2 in AfChiB1, but in an almost perpendicular orientation, now sandwiched between Trp-275 (which is rotated in the AfChiB1 complex) and Trp-397 as a counterpart. The aromatic rings of the second PEN molecule in VhChiA overlap only slightly with the alkyl-aldehyde-group of the PEN1 molecule in AfChiB1. Interestingly, two of the four theophylline molecules in another AfChiB1 complex (Protein Data Bank code 2a3a) overlap closely with our two PEN (and PRO) molecules. The third is almost in place of Trp-275 in VhChiA, whereas the fourth occupies the deepest pocket of the binding site. Our VhChiA-PEN complex (1.65 Å), as well as the extremely well defined structure of the VhChiA-PRO complex (1.16 Å), shows some very weak, fragmented density at this place that might correspond to a partially occupied site.
The presence of one molecule of DEQ in the wild-type active site (Fig. 2A) is supported by the ITC experiments, which are compatible with a single-site binding mechanism (Scheme 1 and Fig. 6, panel A2). DEQ is the most potent inhibitor studied here, because its elongated structure together with the hydrophobic nature of the 2,4-substituted quinolinium headgroups appears to fit perfectly into the long, deep groove of VhChiA and potentially to other family-18 chitinases with an equivalent active site morphology. The two headgroups of DEQ could correspond to the first and the second molecules of other compounds but are now connected by the C10-linker, thus increasing the binding strength. This linker completely blocks the catalytic center (subsites −2, −1, and +1) and at the same time keeps the heterocyclic rings in place so that one is localized at the aglycone position and the other one at the glycone position.
Argadin, argifin, and allosamidin analogs are among the most potent chitinase inhibitors reported to date. Such compounds are active in the nanomolar to micromolar range against family-18 chitinases. They all mimic the reaction transition state and bind close to the critical subsite −1. In contrast, the inhibitors discovered here bind in regions of the substrate-binding cleft of VhChiA that are closer to the surface. For comparison, argadin and argifin in the complexes with AfChiB, SmChiB, and human chitinase overlap to varying degrees with the inhibitors at the aglycone-binding site but do not occupy the glycone site (Fig. 3). This finding suggests a novel concept for the synthesis of even more potent chitinase inhibitors: two hydrophobic residues like the quinolinium headgroups of dequalinium could be separated by a flexible linker that is an allosamizoline analog, and such compounds should bind more tightly than either dequalinium or allosamidin alone.
The human AMCase (Protein Data Bank codes 3fxy and 3fy1; sequence identity to the catalytic domain of VhChiA, 28%) (47) is a potential drug target for asthma-related diseases, and its active site is very similar to that of VhChiA, described in this work. AMCase is missing the loop containing Val-205 of VhChiA, but the crucial tryptophan residues corresponding to Trp-275, Trp-397 (aglycone site, Trp-99 and Trp-218 in AMCase), and Trp-168 (glycone site, Trp-31 in AMCase) are present. In contrast, the published structures of AfChiB1 (Protein Data Bank code 2a3a with theophylline, Protein Data Bank code 2a3c with PEN) and SmChiA (with various inhibitors, e.g. Protein Data Bank code 2wly) have less similar active sites, at least with respect to those residues. Therefore, we can expect a quite similar binding behavior of AMCase, making the inhibitors presented in this work very promising lead compounds. Docking experiments with, for example, the inhibitor dequalinium and AMCase (Protein Data Bank code 3fy1) could indeed accurately reproduce the binding mode found in VhChiA (data not shown). Especially with this high affinity, bifunctional inhibitor, it should be easy to compensate for small differences in the binding site by varying the length of the linker between the two aromatic moieties, and an additional advantage is that this type of lead compound is (in contrast to the transition state mimics) not restricted to only one position in the active site, which again offers more potential for optimization.
Supplementary Material
Acknowledgments
We thank the beamline staff of X10SA at the Swiss Light Source Paul Scherrer Institute (Villigen, Switzerland) for support and our colleagues at Max Planck Institute Dortmund (Marco Bürger), Max Planck Institute Heidelberg, Dept. I. Schlichting (Anton Meinhart, Bernhard Loll) and University of Bochum (Eckhard Hofmann, Christine Schlicker) for help with the data collection. We thank Dr. David Apps, an Honorary Fellow of the Department of Integrative Physiology, The University of Edinburgh, Scotland, for a critical proofread of the manuscript.
This work was supported by the Thailand Research Fund through Royal Golden Jubilee Ph.D. Program Grant PHD/0238/2549.

The on-line version of this article (available at http://www.jbc.org) contains supplemental Tables S1 and S2 and Figs. S1 and S2.
The atomic coordinates and structure factors (codes 3ARO, 3ARP, 3ARQ, 3ARR, 3ARS, 3ART, 3ARU, 3ARV, 3ARW, 3ARX, 3ARY, 3ARZ, 3AS0, 3AS1, 3AS2, and 3AS3) have been deposited in the Protein Data Bank, Research Collaboratory for Structural Bioinformatics, Rutgers University, New Brunswick, NJ (http://www.rcsb.org/).
- AMCase
- acidic mammalian chitinase
- pNP
- p-nitrophenolate
- ITC
- isothermal titration microcalorimetry
- DEQ
- dequalinium
- PRO
- propentofylline
- CHE
- chelerythrine
- IDA
- idarubicin
- IMI
- 2-(imidazolin-2-yl)-5-isothiocyanatobenzofuran
- PEN
- pentoxifyllin
- SAN
- sanguinarine
- DMAB
- p-dimethylaminobenzaldehyde.
REFERENCES
- 1. Terwisscha van Scheltinga A. C., Hennig M., Dijkstra B. W. (1996) J. Mol. Biol. 262, 243–257 [DOI] [PubMed] [Google Scholar]
- 2. Fukamizo T. (2000) Curr. Protein Pept. Sci. 1, 105–124 [DOI] [PubMed] [Google Scholar]
- 3. Hollis T., Monzingo A. F., Bortone K., Ernst. S, Cox R., Robertus J. D. (2000) Protein Sci. 9, 544–551 [DOI] [PMC free article] [PubMed] [Google Scholar]
- 4. Perrakis A., Tews I., Dauter Z., Oppenheim A. B., Chet I., Wilson K. S., Vorgias C. E. (1994) Structure 2, 1169–1180 [DOI] [PubMed] [Google Scholar]
- 5. Tews I., Terwisscha van Scheltinga A. C., Perrakis A., Wilson K. S., Dijkstra B. W. (1997) J. Am. Chem. Soc. 119, 7954–7959 [Google Scholar]
- 6. Langer R. C., Vinetz J. M. (2001) Trends Parasitol. 17, 269–272 [DOI] [PubMed] [Google Scholar]
- 7. Donnelly L. E., Barnes P. J. (2004) Trends Pharmacol. Sci. 25, 509–511 [DOI] [PubMed] [Google Scholar]
- 8. Kawada M., Hachiya Y., Arihiro A., Mizoguchi E. (2007) Keio J. Med. 56, 21–27 [DOI] [PubMed] [Google Scholar]
- 9. Zhu Z., Zheng T., Homer R. J., Kim Y. K., Chen N. Y., Cohn L., Hamid Q., Elias J. A. (2004) Science 304, 1678–1682 [DOI] [PubMed] [Google Scholar]
- 10. Andersen O. A., Dixon M. J., Eggleston I. M., van Aalten D. M. (2005) Nat. Prod. Rep. 22, 563–579 [DOI] [PubMed] [Google Scholar]
- 11. Sakuda S., Isogai A., Matsumoto S., Suzuki A. (1986) Tetrahedron Lett. 27, 2475–2478 [Google Scholar]
- 12. Sakuda S., Isogai A., Matsumoto S., Suzuki A. (1987) J. Antibiot. 40, 296–300 [DOI] [PubMed] [Google Scholar]
- 13. Sakuda S., Sakurada M. (1998) Bioorg. Med. Chem. Lett. 8, 2987–2990 [DOI] [PubMed] [Google Scholar]
- 14. Rao F. V., Houston D. R., Boot R. G., Aerts J. M., Sakuda S., van Aalten D. M. (2003) J. Biol. Chem. 278, 20110–20116 [DOI] [PubMed] [Google Scholar]
- 15. Bortone K., Monzingo A. F., Ernst S., Robertus J. D. (2002) J. Mol. Biol. 320, 293–302 [DOI] [PubMed] [Google Scholar]
- 16. Papanikolau Y., Tavlas G., Vorgias C. E., Petratos K. (2003) Acta Cryst. D59, 400–403 [DOI] [PubMed] [Google Scholar]
- 17. Vaaje-Kolstad G., Houston D. R., Rao F. V., Peter M. G., Synstad B., van Aalten D. M., Eijsink V. G. (2004) Biochim. Biophys. Acta 1696, 103–111 [DOI] [PubMed] [Google Scholar]
- 18. Cederkvist F. H., Saua S. F., Karlsen V., Sakuda S., Eijsink V. G., Sørlie M. (2007) Biochemistry 46, 12347–12354 [DOI] [PubMed] [Google Scholar]
- 19. Omura S., Arai N., Yamaguchi Y., Masuma R., Iwai Y., Namikoshi M., Turberg A., Kölbl H., Shiomi K. (2000) J. Antibiot. 53, 603–608 [DOI] [PubMed] [Google Scholar]
- 20. Arai N., Shiomi K., Iwai Y., Omura S. (2000) J. Antibiot. 53, 609–614 [DOI] [PubMed] [Google Scholar]
- 21. Arai N., Shiomi K., Yamaguchi Y., Masuma R., Iwai Y., Turberg A., Kölbl H., Omura S. (2000) Chem. Pharm. Bull. 48, 1442–1446 [DOI] [PubMed] [Google Scholar]
- 22. Rao F. V., Houston D. R., Boot R. G., Aerts J. M., Hodkinson M., Adams D. J., Shiomi K., Omura S., van Aalten D. M. (2005) Chem. Biol. 12, 65–76 [DOI] [PubMed] [Google Scholar]
- 23. Dixon M. J., Andersen O. A., van Aalten D. M., Eggleston I. M. (2005) Bioorg. Med. Chem. Lett. 15, 4717–4721 [DOI] [PubMed] [Google Scholar]
- 24. Andersen O. A., Nathubhai A., Dixon M. J., Eggleston I. M., van Aalten D. M. (2008) Chem. Biol. 15, 295–301 [DOI] [PMC free article] [PubMed] [Google Scholar]
- 25. Dixon M. J., Nathubhai A., Andersen O. A., van Aalten D. M., Eggleston I. M. (2009) Org. Biomol. Chem. 7, 259–268 [DOI] [PMC free article] [PubMed] [Google Scholar]
- 26. Sunazuka T., Sunazuka T., Sugawara A., Iguchi K., Hirose T., Nagai K., Noguchi Y., Saito Y., Yamamoto T., Ui H., Gouda H., Shiomi K., Watanabe T., Omura S. (2009) Bioorg. Med. Chem. 17, 2751–2758 [DOI] [PubMed] [Google Scholar]
- 27. Hirose T., Sunazuka T., Omura S. (2010) Proc. Jpn. Acad. Ser. B Phys. Biol. Sci. 86, 85–102 [DOI] [PMC free article] [PubMed] [Google Scholar]
- 28. Houston D. R., Shiomi K., Arai N., Omura S., Peter M. G., Turberg A., Synstad B., Eijsink V. G., van Aalten D. M. (2002) Proc. Natl. Acad. Sci. U.S.A. 99, 9127–9132 [DOI] [PMC free article] [PubMed] [Google Scholar]
- 29. Houston D. R., Synstad B., Eijsink V. G., Stark M. J., Eggleston I. M., van Aalten D. M. (2004) J. Med. Chem. 47, 5713–5720 [DOI] [PubMed] [Google Scholar]
- 30. Petter C., Scholz C., Wessner H., Hansen G., Henklein P., Watanabe T., Höhne W. (2008) J. Mol. Recognit. 21, 401–409 [DOI] [PubMed] [Google Scholar]
- 31. Kumar A., Rao M. (2010) Biochim. Biophys. Acta 1800, 526–536 [DOI] [PubMed] [Google Scholar]
- 32. Rao F. V., Andersen O. A., Vora K. A., Demartino J. A., van Aalten D. M. (2005) Chem. Biol. 12, 973–980 [DOI] [PubMed] [Google Scholar]
- 33. Schüttelkopf A. W., Andersen O. A., Rao F. V., Allwood M., Lloyd C., Eggleston I. M., van Aalten D. M. (2006) J. Biol. Chem. 281, 27278–27285 [DOI] [PubMed] [Google Scholar]
- 34. Macdonald J. M., Tarling C. A., Taylor E. J., Dennis R. J., Myers D. S., Knapp S., Davies G. J., Withers S. G. (2010) Angew. Chem. Int. Ed. Engl. 49, 2599–2602 [DOI] [PubMed] [Google Scholar]
- 35. Suginta W., Songsiriritthigul C., Kobdaj A., Opassiri R., Svasti J. (2007) Biochim. Biophys. Acta. 1770, 1151–1160 [DOI] [PubMed] [Google Scholar]
- 36. Pantoom S., Songsiriritthigul C., Suginta W. (2008) BMC Biochem. 21, 9:2 [DOI] [PMC free article] [PubMed] [Google Scholar]
- 37. Prinz H., Schönichen A. (2008) J. Chem. Biol. 1, 95–104 [DOI] [PMC free article] [PubMed] [Google Scholar]
- 38. Boller. T., Mauch F. (1988) Methods Enzymol. 161, 430–435 [Google Scholar]
- 39. Kabsch W. (1993) J. Appl. Cryst. 26, 795–800 [Google Scholar]
- 40. Collaborative Computational Project, Number 4 (1994) Acta Crystallogr. D 50, 760–763 15299374 [Google Scholar]
- 41. Emsley P., Cowtan K. (2004) Acta Cryst. D60, 2126–2132 [DOI] [PubMed] [Google Scholar]
- 42. Schüttelkopf A. W., van Aalten D. M. (2004) Acta Cryst. D 60, 1355–1363 [DOI] [PubMed] [Google Scholar]
- 43. Laskowski R. A., McArthur M. W., Moss D. S., Thornton J. M. (1993) J. Appl. Cryst. 26, 283–291 [Google Scholar]
- 44. Vriend G. (1990) J. Mol. Graph. 8, 52–56 [DOI] [PubMed] [Google Scholar]
- 45. Wallace A. C., Laskowski R. A., Thornton J. M. (1995) Protein Eng. 8, 127–134 [DOI] [PubMed] [Google Scholar]
- 46. Songsiriritthigul C., Pantoom S., Aguda A. H., Robinson R. C., Suginta W. (2008) J. Struct. Biol. 162, 491–499 [DOI] [PubMed] [Google Scholar]
- 47. Olland A. M., Strand J., Presman E., Czerwinski R., Joseph-McCarthy D., Krykbaev R., Schlingmann G., Chopra R., Lin L., Fleming M., Kriz R., Stahl M., Somers W., Fitz L., Mosyak L. (2009) Protein Sci. 18, 569–578 [DOI] [PMC free article] [PubMed] [Google Scholar]
Associated Data
This section collects any data citations, data availability statements, or supplementary materials included in this article.