

Abstract
The Rho/ROCK pathway is activated in differentiated hepatic stellate cells (HSCs) and is necessary for assembly of actin stress fibers, contractility, and chemotaxis. Despite the importance of this pathway in HSC biology, physiological inhibitors of the Rho/ROCK pathway in HSCs are not known. We demonstrate that adenosine induces loss of actin stress fibers in the LX-2 cell line and primary HSCs in a manner indistinguishable from Rho/ROCK inhibition. Loss of actin stress fibers occurs via the A2a receptor at adenosine concentrations above 10 μM, which are present during tissue injury. We further demonstrate that loss of actin stress fibers is due to a cyclic adenosine monophosphate, protein kinase A–mediated pathway that results in Rho inhibition. Furthermore, a constitutively active Rho construct can inhibit the ability of adenosine to induce loss of actin stress fibers. Actin stress fibers are required for HSC contraction, and we demonstrate that adenosine inhibits endothelin-1 and lysophosphatidic acid–mediated HSC contraction. We propose that adenosine is a physiological inhibitor of the Rho pathway in HSCs with functional consequences, including loss of HSC contraction.
Hepatic stellate cells (HSCs) are known to undergo a variety of functional changes in response to liver injury. These changes include matrix remodeling, actin reorganization, chemotaxis, and contraction. Among these, HSC contraction is of interest because it contributes to intrahepatic resistance and portal hypertension, which are responsible for much of the morbidity in cirrhosis. Several mediators have been identified to induce HSC contraction, including endothelin-1 (ET-1),1 prostanoid,2 substance P,3 angiotensin II,4 and arginine vasopressin.5 In contrast, few signals are known to inhibit HSC contraction, and these are nitric oxide (NO), carbon monoxide, somatostatin, and adrenomedullin.6 The molecules that inhibit HSC contraction are of great interest, because they are candidates for therapeutic intervention. Among these, somatostatin is in clinical use, unfortunately inducing only modest reduction in portal pressure, and NO donors are in clinical development.
Adenosine is increasingly recognized as having an important role in HSC differentiation and liver fibrosis. In response to adenosine, HSCs up-regulate collagen and transforming growth factor β, and inhibition of adenosine receptor 2a (A2aR) signaling decreases liver fibrosis in vivo.7,8 This is consistent with the demonstrated role of adenosine in lung and the skin fibrosis.9 Because of these attributes, several adenosine receptor antagonists are in clinical development.10 We recently demonstrated that adenosine inhibits platelet-derived growth factor–mediated HSC chemotaxis, a feature that it shares with NO.11,12 Due to the requirement of actin stress fibers in chemotaxis, we examined the effect of adenosine on actin stress fiber stability in HSC cell lines and primary cells. We show that adenosine inhibits actin stress fiber formation via the A2aR and a cyclic adenosine monophosphate (cAMP), protein kinase A (PKA)-mediated pathway. This pathway results in inactivation of RhoA, a molecule central to actin stress fiber assembly, and inhibition of ET-1 and lysophosphatidic acid (LPA) mediated HSC contraction.6,13 This identifies the first physiological signal to inhibit the Rho pathway in HSCs and demonstrates an important role for adenosine in actin organization and contraction.
Materials and Methods
Reagents
Forskolin (cAMP analogue), MRS 1523 (A3a antagonist), 8-PST (peripheral nonselective adenosine antagonist), adenosine, ET-1, LPA, and 5’-(N-ethylcarboxamido) adenosine (NECA) (nonselective adenosine receptor agonist) were obtained from Sigma (St. Louis, MO). Tryphan blue, fungizone, trypsin–ethylene diamine tetraacetic acid, phosphate-buffered saline (PBS), Roswell Park Memorial Institute 1640 medium (RPMI), Dulbecco’s modified Eagle’s medium (DMEM), Hank’s balanced salt solution, and F-12 (HAM) were purchased from GIBCO/Invitrogen (Carlsbad, CA). DPCPX (A1 antagonist), ZM 241385 (A2a antagonist), and MRS 1706 (A2b antagonist) were obtained from TOCRIS (Ellisville, MI). Triton X-100 was from Cole-Parmer (Vernon Hills, IL). Six-well plates, 12-well plates, and cell culture flasks were from Becton Dickinson (Franklin lakes, NJ). ST-HT31 (PKA inhibitor) and SB 203580 (p38 inhibitor) were from Promega (Madison, WI). PD980599 (MEK inhibitor), NSC23766 (Rac1 inhibitor), and Y27632 (ROCK inhibitor) were from Calbiochem (San Diego, CA). Adenosine, NECA, and forskolin were at used a concentration of 10 μM unless stated otherwise.
Cell Culture
LX-2 cells are immortalized HSCs and were a gift from Dr. Scott Friedman (Mount Sinai School of Medicine, New York, NY). LX-2 cells were changed with media every 3 days and consisted of (RPMI, plus 5% fetal bovine serum (FBS) and 1% penicillin and streptomycin). Cells were cultured in 75-cm2 flasks until 80% to 90% confluence and were then used for biological studies
Animal and HSC Isolation
Retired male Sprague-Dawley rats (500-700 g) were used for primary HSC isolation. All experiments and animal handling were performed according to the Yale University Institutional Animal Care and Use Committee. HSCs were isolated via in situ pronase/collagenase perfusion followed by density gradient centrifugation as described.14 Primary cells were used at 5-7 days and were more than 95% pure. Cells were grown on standard tissue culture plastic flasks in DMEM with 10% fetal bovine serum and antibiotics.
Confocal Immunofluorescence
For phalloidin staining, cells were cultured on slides, fixed in 4% paraformaldehyde for 30 minutes at 4°C, and permeabilized with 0.1% Triton X-100 in PBS for 1 minute at room temperature. Filamentous actin was stained with tetramethyl-rhodamine isothiocyanate–phalloidin in PBS (1 μmol/L) for 20 minutes at room temperature. After mounting, cells were visualized on confocal laser-scanning microscopy.
Quantification of the Percentage of an HSC Population that Undergoes a Change in Morphology
LX-2 cells were trypsinized and 40,000 cells were placed in 12-well plates. Serum-free condition was applied for 12 hours. Cells were washed with PBS, placed in fresh serum-free media, treated with adenosine (10 μM) and NECA (10 μM), and shape change was photographed using a phase-contrast microscope. Cells were pretreated with various antagonists of adenosine receptors and downstream signaling pathway for the indicated times. NECA was added after pretreatment with antagonist. A total of 50 high-power field images were taken, and the total number of cells as well as the number of cells that had undergone a change in morphology (characterized as a loss of flat cuboidal shape, along with a reduction in cell body diameter of at least 50%, and the development of projections) per high-power fields were counted. For each experimental group, the average number of cells that had undergone a change in morphology per high-power field was calculated. The Student t test was performed, with P < 0.05 considered significant.
cAMP Assay
LX-2 cells were grown in 6-well plates. Serum-free conditions were applied for 12 hours. Fresh medium was added that contained adenosine (10 μm), NECA (10 μm), or forskolin (10 μm). ZM241385 (1 μM) was added 20 minutes before NECA where indicated. The cAMP levels were measured using a cAMP enzyme immunoassay system (Amersham Biosciences) and manufacturer’s instructions were followed. After 15 minutes, cells were lysed and assayed in triplicate, and the optical density was calculated against the standard curve to determine the cAMP level. Results are expressed as ratios (mean ± standard error) relative to those of mock controls. The cAMP response was verified by treatment with forskolin.
Pull-Down Assays for Active RhoA
Cells were treated with and without NECA (10 μM) for 1 hour for all experiments in which RhoA was assayed and the constitutively active RhoA plasmid was used, unless otherwise stated. To the diluted buffer (Upstate, Temecula, CA) in water, 10 μg/mL of aprotinin and 10 μg/mL leupeptin from Roche Molecular Biochemicals (Chicago, IL) was added. Cells were rinsed twice with PBS, and lysis buffer was added. Rho reagent slurry (upstate) was added, samples were incubated, and beads were pelleted via brief centrifugation. Beads were resuspended in Laemmli-reducing buffer from Invitrogen (Carlsbad, CA) and boiled for 5 minutes. Supernatant and agarose pellets were mixed, and samples were loaded on sodium dodecyl sulfate–polyacrylamide gel electrophoresis gel (Invitrogen) and blotted to a nitrocellulose membrane. Anti-Rho antibody and mouse monoclonal IgG1 (upstate) were applied for overnight, and appropriate secondary antibody was used for 1 hour. Chemoiluminescent from Pierce (Rockford, IL) was applied to the membrane for 5 minutes and developed on radiographic film.
Transfection of LX-2 Cells with Constitutively Active Rho
Complementary DNA encoding constitutive active Rho (RhoQ63L), and dominant negative Rho (N19) originally generated by Dr. J. Silvio Gutkind (National Institute of Dental and Craniofacial Research) were used. LX-2 cells were grown in a 12-well plate and transfected with constitutive active and dominant negative Rho using Lipofectamine 2000 (Invitrogen). Medium was changed after 3 hours of transfection, and cells were kept in serum media for 36 hours.
Quantification of Phosphorylated Myosin via Western Blotting
Primary rat HSCs were treated with NECA for 1, 5, 20, and 30 minutes, and Forskolin (FSK) for 20 minutes, and proteins were extracted. Proteins were run on a 12% bis-tris gel (Invitrogen) and transferred on a PVDF membrane. The membranes were incubated with primary antibody of phosphomyosin light chain 2 and total myosin light chain from Cell Signaling Technology (Danvers, MA). Membranes were washed and reincubated with the appropriate secondary antibodies and developed on radiographic film.
Gel Contraction Assay
Contractility of HSCs was evaluated using collagen gel lattices on 6-well culture plates as described with some modifications.1,15 Wells were filled with PBS containing 1% bovine serum albumin for 1 hour at 37°C, washed twice with PBS, and air-dried. Type1 rat-tail collagen (3.69 mg/mL; BD Bioscience, Bedford, MA) was adjusted according to the manufacturer’s instructions. The final collagen concentration was 2 mg/mL. The collagen solution was poured and incubated for 1 hour at 37°C to allow gelation. HSCs were isolated and cultured as described. After 7 days of culture, cells were trypsinized, suspended (2.5 × 10⁵ cells/mL) in DMEM supplemented with 10% fetal bovine serum and antibiotics, and plated on the collagen gels (2 mL cell suspension/well). After incubation overnight to allow cell attachment, serum-free conditions were introduced for 4 hours and the cells were washed three times with serum-free DMEM. Gels were detached from the plates. Buffer without ET-1 or NECA was used as a control. HSCs were treated with NECA (10 μm) for 1 hour. ET-1 (10 nM) and LPA 10 μM was added to the culture media at a concentration of just before the lattices were detached. The gels were photographed every hour for 6 hours. Surface area of the collagen gels was measured using digital image analysis software, and images were processed using Adobe Photoshop 3.0. Relative contraction of the gels was expressed as a percentage according to the following formula: [(gel surface area of buffer 2 gel surface area of test substance) / (gel surface area of buffer 2 gel surface area of ET-1)] × 100%. All experiments were performed as triplicate. Statistical analysis was performed, with P < 0.05 considered significant.
Results
Adenosine Induces HSC Stellation and Loss of Actin Stress Fibers in LX-2 and Primary Rat and Mouse HSCs
LX-2 and primary HSCs in culture on plastic develop a cuboidal shape with the development of actin stress fibers. Within 30 minutes of adding adenosine, there was rounding up of much of the cell body, and the development of long cell membrane extensions (Fig. 1A,B). This resulted in a decrease in cell diameter of approximately 50% and a stellate morphology. We quantified the shape change using confocal microscopy; for primary rat HSCs the diameter of the cell body (not including the stellate cell process) decreased from a mean of 48 ± 11 μmto19 ± 6 μm. This was associated with an increase in cell thickness from 7 ± 3 μm to13 ± 5 μm. Staining for F-actin using phalloidin demonstrated significant loss of F-actin stress fibers in response to adenosine in LX-2 (Fig. 1D,E) and primary HSCs (Fig. 1G,H). Adenosine has a very short half life in vivo and in culture due to the ubiquitous presence of adenosine deaminase and purine nucleotide phosphorylase, which convert adenosine to inosine and adenine, respectively. The ability of metabolites of adenosine to signal are poorly understood, but it is notable that a receptor for adenine has recently been identified in rats, and homologous genes are also present in the mouse and human genome. To ensure that biological actions of adenosine metabolites were not required for loss of actin stress fibers, we tested the ability of a nonhydrolysable analogue of adenosine (NECA) to induce loss of actin stress fibers (Fig. 1F,I). Addition of NECA to LX-2 and primary HSCs resulted in morphological change and loss of actin stress fibers in an identical manner to adenosine (Fig. 1C,F,I).
Fig. 1.
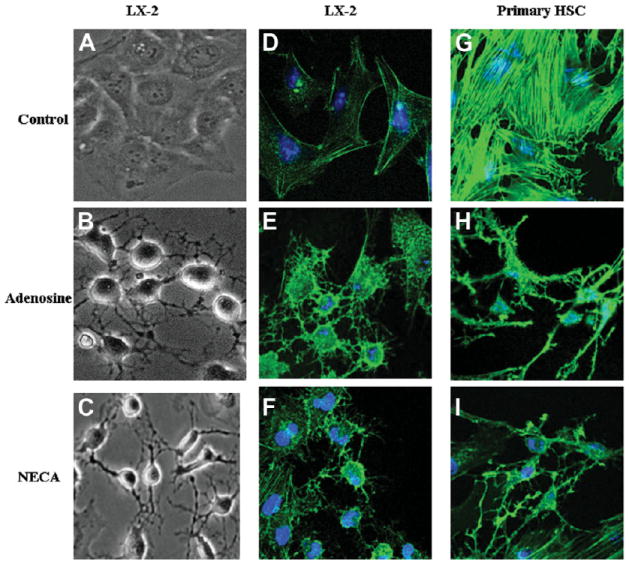
Adenosine induces stellation and loss of actin stress fibers in LX-2 and primary HSCs. (A) LX-2 cells under phase contrast show typical flat cuboidal structure. Thirty minutes after exposure to (B) adenosine (10 μM) or (C) NECA (10 μM), the cells have rounded and developed projections that maintain some cell-cell contact. (D) LX-2 cells stained to show F-actin (green) and nuclei (Topro 3 blue), demonstrating flat morphology and actin stress fibers. Thirty minutes after exposure to (E) adenosine or (F) NECA, the cells have lost actin stress fibers, rounded up, and developed F-actin–positive projections. (G) Primary rat HSCs stained to show F-actin (green) and nuclei (Topro 3 blue), demonstrating flat morphology and actin stress fibers. One hour after exposure to adenosine (H) or NECA (I), the cells have lost actin stress fibers, rounded up, and developed F-actin positive projections.
HSC Stellation Occurs at Pathological Concentrations of Adenosine and via A2aR Signaling
We next examined the dose range at which the adenosine-mediated HSC response was observed in order to understand if HSC stellation occurs at concentrations usually found during inflammation and cellular death (1 μM and above). As can be seen from Fig. 2A, HSC stellation occurred at adenosine concentrations of 1 μM and above, and did not reach its maximum until concentrations of 10 μM were reached. This suggests that this phenomenon is of significance at adenosine concentrations found during disease. As shown in Fig. 2B, NECA at a concentration of 10 μM induced HSC stellation in a manner indistinguishable from adenosine.
Fig. 2.
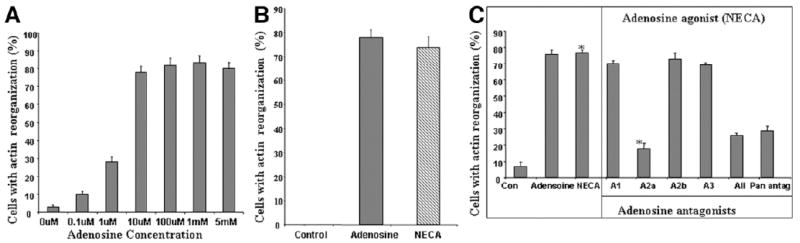
HSC stellation occurs at pathophysiogical concentrations of adenosine and occurs via A2aR signaling. (A) Dose-response curve of stellation in LX-2 cells 1 hour after adding adenosine demonstrates maximal stellation occurring at adenosine concentrations between 1 and 10 μM. (B) Stellation is reproduced in LX-2 cells by NECA, a nonhydrolysable analogue of adenosine (1 hour after adding NECA), demonstrating that adenosine metabolites are not required for HSC stellation. (C) Receptor subtype–specific antagonists demonstrate a requirement for A2aR for stellation to occur in primary HSCs. Receptor antagonists were added for 20 minutes, followed by NECA for 1 hour. DPCPX (A1 receptor antagonist) 1μM, MRS1706 (A2b antagonist) 10 nM, and MRS1523 (A3 antagonist) 5 μM could not antagonize the effect of adenosine (10 μM). Only Zm241385 (A2a receptor blocker) 1 μM and 8-PST (pan-receptor antagonist) 1 μM and all four antagonists blocked the ability of adenosine to induce stellation (*P < 0.05).
Adenosine signals via four receptor subtypes—A1, A2a, A2b and A3—which are widely expressed, including in the liver, and mediate their effects via coupled G proteins. Several receptor subtype–specific antagonists have been developed and are well characterized. The following antagonists were used to antagonize the effects of NECA (10 μM) on primary HSC stellation: subtype A1, DPCPX (10 nM); subtype A2a, ZM241385 (10 μM); subtype A2b, MRS1706 (10 nM); subtype A3, MRS1523 (5 μM). As shown in Fig. 2C, the A2a receptor subtype antagonist results in significant antagonism of the ability of NECA to induce HSC actin reorganization. In contrast, the A1, A2b, and A3 receptor antagonists do not antagonize the ability of NECA to induce HSC stellation. Furthermore, the combination of all four antagonists, and the pan-antagonist (8-PST), do not enhance the effects of the A2a antagonist. The antagonists in the absence of NECA also did not induce stellation. This suggests that the A1, A2b, and A3 receptors have a minimal or no role in the adenosine-induced change in HSC morphology. This identifies the A2a receptor subtype as being responsible for the effect of adenosine on HSC stellation.
Adenosine-Induced HSC Stellation Occurs via a cAMP, PKA-mediated Pathway
The signaling pathways activated by A2aR are well characterized and are mediated via Gs-dependent adenylate cyclase activation resulting in an increase in cytosolic cAMP. Forskolin was used to test if elevations in cAMP can reproduce adenosine-induced HSC stellation. As can be seen from Fig. 3A, forskolin induced HSC stellation as efficiently as NECA, and as expected this could not be antagonized by the A2aR antagonist. Figure 3B demonstrates that forskolin induced actin reorganization indistinguishable from NECA. We next directly confirmed that the addition of NECA resulted in an increase in cytosolic cAMP in HSCs. As shown in Fig. 3C, adenosine and NECA significantly increased cytosolic cAMP in HSCs, and this was inhibited by an A2aR antagonist. Elevations in cAMP induced by A2aR signaling are known to activate PKA. To test for the requirement for PKA activation in HSC stellation, we used a very specific steric inhibitor of PKA function that blocks binding of PKA to A kinase anchoring proteins. LX-2 cells were pretreated with ST-H31 (25 μM) for 30 minutes before adding NECA. As shown in Fig. 3D, ST-H31 significantly inhibits NECA-induced HSC stellation. Collectively, these data strongly support a model of loss of actin stress fibers and HSC stellation by activation of the A2a receptor via elevations in cytosolic cAMP and PKA activation.
Fig. 3.
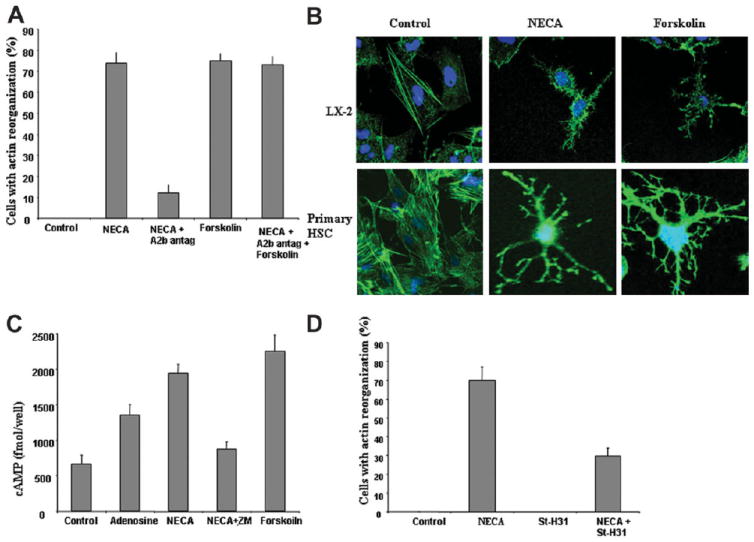
Adenosine-induced HSC stellation occurs via a cAMP, PKA-mediated pathway. (A) LX-2 cells treated with NECA (adenosine agonist) and forskolin at 10 μM. Forskolin induced stellation identical to NECA, and did so in the presence of A2a receptor antagonism. (B) Staining for F-actin in LX2 and primary HSCs demonstrates loss of actin stress fibers in response to forskolin in a manner indistinguishable from the response to NECA. (C) LX-2 cells were treated with NECA, adenosine, or forskolin, and cAMP levels were measured demonstrating elevation in cytsolic cAMP, which was partially reduced by using an A2a receptor antagonist in the NECA group. (D) Primary HSCs were pretreated with steric PKA inhibitor ST-H31 (25 μM for 4 hours) and NECA (10 μM) for 1 hour added. PKA antagonist had no effect on morphology, but significantly inhibited HSC stellation in response to NECA.
NECA Inhibits RhoA, and NECA-Induced Stellation Is Dependent on RhoA Inhibition
Our next goal was to identify the mechanism by which PKA activation results in loss of actin stress fibers. Rho kinase, via activation of ROCK, is known to be important in the formation of actin stress fibers.16 In cultured stellate cells, Rho kinase is activated and its inhibition results in loss of actin stress fibers.17 We also noted that the loss of actin stress fibers and stellation caused by adenosine was indistinguishable from published changes reported after ROCK inhibition by Y-27632 and by transfection with dominant negative RhoA.18 We have already demonstrated that PKA activity is required for the loss of actin stress fibers in response to adenosine, and a direct link between PKA and Rho is known, with PKA activation resulting in inhibition of Rho A by phosphorylating Rho A on Ser188.19,20 We therefore tested if NECA inhibits the formation of Rho GTP. Figure 4A shows that LX-2 HSCs have detectable Rho GTP, and after exposure to NECA for 15, 30, and 60 minutes there is significant reduction in active Rho in relation to total Rho. The A2aR antagonist can block, and forskolin can mimic, the ability of NECA to decrease active Rho. To directly confirm if inhibition of RhoA is required for NECA-induced loss of actin stress fibers and HSC stellation, LX-2 HSCs were transfected with constitutively active Rho construct (RQ63L). Figure 4B shows that transfection with constitutively active Rho construct significantly reduces the ability of NECA to induce HSC stellation. Figure 4C demonstrates that in LX-2 transfected with the constitutively active Rho, NECA does not induce loss of actin stress fibers.
Fig. 4.
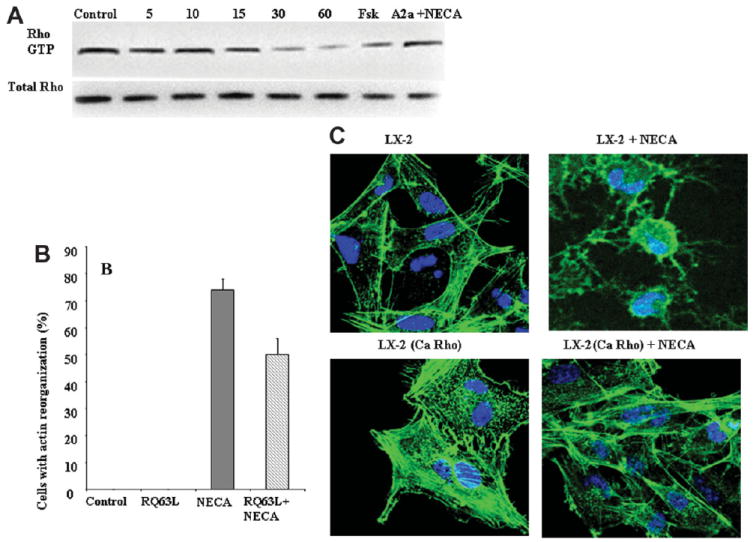
NECA inhibits RhoA, and NECA-induced stellation is dependent on RhoA inhibition. (A) Primary HSCs in culture have RhoA activity as shown by a RhoA pull-down assay (control lane). Exposure to NECA (10 μM) results in loss of RhoA activity as early as 15 minutes, and this is very significant by 30 minutes. Pretreatment with an A2aR inhibitor blocks the ability of NECA to decrease RhoA. Forskolin reproduces the ability of NECA to decrease RhoA activity. (B) NECA-induced HSC stellation is significantly reduced in LX-2 cells transfected with constitutively active RhoA (RhoQ63L). (C) NECA does not result in loss of actin stress fibers in LX-2 cells transfected with constitutively active RhoA.
NECA Inhibits ET-1 and LPA- Induced HSC Contraction
The importance of RhoA in the formation of actin stress fibers is well established from data using chemical inhibitors and dominant negative constructs. We have now identified adenosine as a biological signal that acts on this pathway to inhibit RhoA. It was important to identify the functional consequences of RhoA inhibition by adenosine. Contraction is an important function of HSCs and is dependent on actin stress fibers. Several biologically active molecules induce HSC contraction, and chemical inhibitors of the RhoA pathway inhibit this. ET-1 and LPA are two molecules that are well characterized as causing HSC contraction. To measure the effect of adenosine on the contraction induced by ET-1 and LPA, we used the established assay of hydrated collagen gels. In Fig 5A, a representative experiment of collagen lattice contraction after 3-hour incubation was shown. The Fig. 5A control shows a gel exposed to buffer only, resulting in a minimal decrease of the collagen surface area. NECA 10 μM caused no decrease in surface area of gel compared with control. ET-1 (10 nM) and LPA (10 μM), stimulated a decrease in collagen gel surface area within 1 hour. Addition of NECA (10 μM) to the collagen gel for 60 minutes followed by ET-1 (10 nM) or LPA (10 μM) resulted in significant loss of gel contraction. Figure 5B shows actin stress fibers in primary HSCs from the same groups as in Fig. 5A. This demonstrates that NECA induces loss of actin stress fibers in primary HSCs treated with ET-1 and LPA. The quantitation of decrease in cell area and percentage gel contraction is shown in Fig. 5C,D. Figure 5E demonstrates that NECA decreases active Rho in LPA-treated primary HSCs. Activation of Rho is known to result in phosphorylation of myosin light chain. Figure 5F demonstrates that NECA induces a decrease in phosphorylated myosin light chain, evident by 5 minutes, and this decrease is more pronounced by 20 minutes. The inhibition of phosphorylated myosin light chain is reproduced by forskolin.
Fig. 5.
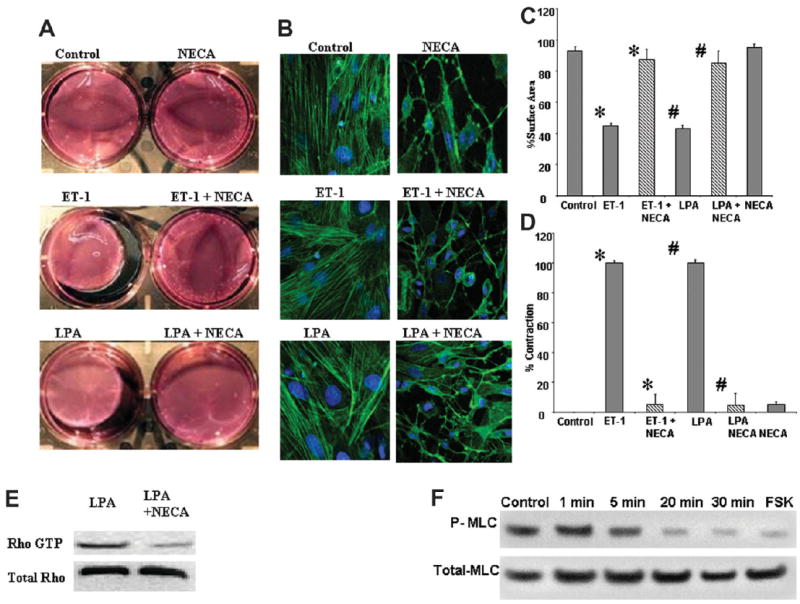
NECA inhibits ET-1 and LPA-induced primary HSC contraction. (A) Hydrated collagen lattices, photographed 6 hours after addition of vasoactive substances. Control, NECA (10 μM), ET-1 (10 nM), and LPA (10 μM). ET-1 and LPA 60 minutes after preincubation of the collagen gel with NECA (10 μM). (B) The state of actin stress fibers in primary HSCs cultured on plastic in the same groups as in (A), showing that NECA induces loss of actin stress fibers in the presence of ET-1 and LPA. (C) Mean percent gel surface area of collagen gels, compared with initial surface area, after incubation with buffer, 10 μM NECA, 10 nM ET-1, 10 μM LPA, and 10 μM NECA for 1 hour followed by 10 nM ET-1 and 10 μM LPA for 6 hours (*,#P < 0.05). (D) Mean contraction of collagen gels exposed to the combination of 10 μM NECA and 10 nM ET-1, 10 μM LPA after 3 hours compared with the contraction of cells exposed to 10 nM ET-1 and 10 μM LPA alone (*,#P < 0.05). (E) NECA reduces Rho A activity in LPA-treated primary HSCs. (F) NECA reduces phosphorylated myosin light chain in primary HSCs with reduction occurring as early as 5 minutes and prominent by 20 minutes. Forskolin (10 μM incubated for 20 minutes) also reduces phosphorylated myosin light chain.
Discussion
Rho is a small, monomeric guanosine triphosphate–binding protein from the ras superfamily. Several studies have established Rho activity as a key regulator of actin organization, cell morphology, chemotaxis, and contraction in a wide range of cells including HSCs.15,21-23 Rho stimulates ROCK, triggering the assembly of cytoplasmic stress fibers composed of filamentous (F-) actin. Rho activation and actin assembly in HSCs is required for chemotaxis and contractibility, and RhoA is constitutively active in cultured HSCs and HSCs from injured livers.12,16,18 The consequences of inhibiting the Rho pathway have been investigated extensively with the bacterial toxin C3 transferase and chemical inhibitors of ROCK. Despite the extensive information obtained using experimental inhibitors on the central role for the Rho pathway in actin stress fiber formation, cell morphology, chemotaxis, and contraction, biological inhibitors of Rho in HSCs are not known.
Adenosine is the first product along the uric acid pathway, and is also a well characterized signaling molecule with at least four receptor subtypes (A, A2a, A2b and A3).9,24,25 Tissue concentrations of adenosine increase in a wide range of conditions including ischemia, cellular apoptosis and inflammation, all of which share the common feature of tissue injury. Elevations in adenosine concentrations have a diverse range of effects on cell biology in different organs, with for example decreasing neuronal apoptosis in the brain, and decreasing chronotropy in response to cardiac ischemia.26,27 The common theme to these individual changes is tissue and organ adaptation to injury. We and others have already demonstrated that adenosine results in HSC differentiation with increased production of collagen, and inhibition of HSC chemotaxis.7,11 In this study we have identified that adenosine, signaling via the A2aR inhibits Rho in HSC. It does this by the well established A2aR pathway of upregulation of cAMP, resulting in PKA activation. This is consistent with and identifies a biological stimulus for previous studies showing that increases in cAMP result in loss of actin stress fibers in astrocytes and PKA inhibits Rho by phosphorylating Rho A on Ser19,20,28,29 As predicted from the chemical induced elevations in cAMP and inhibition of Rho, adenosine induced elevation in cAMP and inhibition of Rho also results in loss of actin stress fibers. Loss of stress fibers is predicted to inhibit HSC contraction, and this has been confirmed by chemical inhibitors of ROCK.15 We demonstrate that addition of adenosine at concentrations found during cellular injury results in inhibition of ET-1 and LPA-induced HSC contraction, and due to the requirements of stress fibers for contraction this inhibition likely extends to a range of stimuli.
In contrast to the above findings on in vitro contraction, many HSC responses to adenosine differ from experimental inhibition of the Rho pathway. An example is Rho inhibition by botulinum toxin results in reduced production of collagen by cultured rat HSCs. Reduced CCl4-induced fibrosis was observed due to the administration of the ROCK inhibitor Y-27632.18,30 This is in direct contrast to the effects of adenosine on cultured HSCs and the role of adenosine on liver fibrosis in vivo. Adenosine increased messenger RNA and protein levels of collagen from cultured mouse HSCs.7 This increase in collagen expression by HSCs is, however, due to a Rho-independent pathway, and occurs via PKA, src, and erk signaling.8 The overall profibrogenic effect of adenosine in vivo is further supported by the increase in adenosine concentration and the up-regulation of A2aR during experimental liver fibrosis, as well as the ability of an A2aR inhibitor to decrease liver fibrosis in mice and reduce liver fibrosis in A2aR-deficient mice.7 Collectively, these findings demonstrate that adenosine has multiple biological effects on HSCs in addition to Rho inhibition, and therefore differences in HSC responses between adenosine and Rho inhibition are not surprising. They also demonstrate that HSC differentiation is not a linear paradigm, with serial acquisition of functions such as collagen deposition, chemotaxis, contractility, and so forth. In response to some stimuli, such as adenosine, there is clear disassociation of activation-associated functions, such as collagen deposition and contractility.
One reason for interest in the role of the Rho pathway in formation of actin stress fibers and HSC contractility is to better understand the biology of HSC contraction and its potential effects on liver hemodynamic. The data from the Rho inhibitor Y-27632 on liver hemodynamics are very clear and show that Rho inhibition reduces portal vein pressures in ET-1 vasoconstricted normal livers, and this is consistent with the ability of Rho inhibitors to block ET-1–mediated contraction of HSCs.14 The response of portal pressures in normal livers to adenosine is more complex. Infusion of adenosine into normal livers that have not been preconstricted results in a transient increase in portal vein pressures that lasts approximately 5 to 10 minutes, after which portal vein pressures return to baseline or even decrease.31,32 This transient increase in portal pressure can be inhibited by ibuprofen and may be due to eicosanoid production.31 In contrast to normal livers, in biliary cirrhosis infusion of adenosine does not lead to a significant change in portal pressure.33 The response of the hepatic artery to adenosine is also well characterized and consists of vasodilatation in the normal liver via A2aR in an NO-independent manner, and in cirrhotic livers via A1aR in an NO-dependent manner.34-36 In conclusion, although adenosine inhibits the contraction of HSCs, its many other effects (for example, production of eicosanoids) produces results in vivo that are different from simple Rho inhibition. Understanding how all the simultaneously produced vascoconstrictive and vasodilatory signals are integrated is a significant challenge.
We have identified the first biological signal to inhibit the Rho pathway in HSCs and have demonstrated that in addition to reorganizing actin stress fibers, it has functional consequences with loss of HSC contraction. This fills an important gap in our understanding of the regulation of the Rho pathway in HSCs and the many effects of adenosine on HSCs.
Acknowledgments
Supported by NIH R01DK076674-01A2 (WM), DK070849; DK076735 (JD) and the Yale Liver Center (P30) DK34989.
Abbreviations
- A2aR
adenosine receptor 2a
- cAMP
cyclic adenosine monophosphate
- DMEM
Dulbecco’s modified Eagle’s medium
- ET-1
endothelin-1
- FBS
fetal bovine serum
- HSC
hepatic stellate cell
- LPA
lysophosphatidic acid
- NECA
5’-(N-ethylcarboxamido) adenosine
- NO
nitric oxide
- PBS
phosphate-buffered saline
- PKA
protein kinase A
- RPMI
Roswell Park Memorial Institute 1640 medium
Footnotes
Potential conflict of interest: Nothing to report.
References
- 1.Rockey DC, Housset CN, Friedman SL. Activation-dependent contractility of rat hepatic lipocytes in culture and in vivo. J Clin Invest. 1993;92:1795–1804. doi: 10.1172/JCI116769. [DOI] [PMC free article] [PubMed] [Google Scholar]
- 2.Kawada N, Klein H, Decker K. Eicosanoid-mediated contractility of hepatic stellate cells. Biochem J. 1992;285:367–371. doi: 10.1042/bj2850367. [DOI] [PMC free article] [PubMed] [Google Scholar]
- 3.Sakamoto M, Ueno T, Kin M, Ohira H, Torimura T, Inuzuka S, et al. Ito cell contraction in response to endothelin-1 and substance P. Hepatology. 1993;18:978–983. doi: 10.1002/hep.1840180432. [DOI] [PubMed] [Google Scholar]
- 4.Pinzani M, Failli P, Ruocco C, Casini A, Milani S, Baldi E, et al. Fat-storing cells as liver-specific pericytes. Spatial dynamics of agonist-stimulated intracellular calcium transients. J Clin Invest. 1992;90:642–646. doi: 10.1172/JCI115905. [DOI] [PMC free article] [PubMed] [Google Scholar]
- 5.Bataller R, Nicolas JM, Gines P, Esteve A, Nieves Gorbig M, Garcia-Ramallo E, et al. Arginine vasopressin induces contraction and stimulates growth of cultured human hepatic stellate cells. Gastroenterology. 1997;113:615–624. doi: 10.1053/gast.1997.v113.pm9247484. [DOI] [PubMed] [Google Scholar]
- 6.Rockey DC. Hepatic fibrosis, stellate cells, and portal hypertension. Clin Liver Dis. 2006;10:459–479. doi: 10.1016/j.cld.2006.08.017. [DOI] [PubMed] [Google Scholar]
- 7.Chan ES, Montesinos MC, Fernandez P, Desai A, Delano DL, Yee H, et al. Adenosine A(2A) receptors play a role in the pathogenesis of hepatic cirrhosis. Br J Pharmacol. 2006;148:1144–1155. doi: 10.1038/sj.bjp.0706812. [DOI] [PMC free article] [PubMed] [Google Scholar]
- 8.Che J, Chan ES, Cronstein BN. Adenosine A2A receptor occupancy stimulates collagen expression by hepatic stellate cells via pathways involving protein kinase A, Src, and extracellular signal-regulated kinases 1/2 signaling cascade or p38 mitogen-activated protein kinase signaling pathway. Mol Pharmacol. 2007;72:1626–1636. doi: 10.1124/mol.107.038760. [DOI] [PubMed] [Google Scholar]
- 9.Chunn JL, Mohsenin A, Young HW, Lee CG, Elias JA, Kellems RE, et al. Partially adenosine deaminase-deficient mice develop pulmonary fibrosis in association with adenosine elevations. Am J Physiol Lung Cell Mol Physiol. 2006;290:L579–L587. doi: 10.1152/ajplung.00258.2005. [DOI] [PubMed] [Google Scholar]
- 10.Gao ZG, Jacobson KA. Emerging adenosine receptor agonists. Expert Opin Emerg Drugs. 2007;12:479–492. doi: 10.1517/14728214.12.3.479. [DOI] [PMC free article] [PubMed] [Google Scholar]
- 11.Hashmi AZ, Hakim W, Kruglov EA, Watanabe A, Watkins W, Dranoff JA, et al. Adenosine inhibits cytosolic calcium signals and chemotaxis in hepatic stellate cells. Am J Physiol Gastrointest Liver Physiol. 2007;292:G395–G401. doi: 10.1152/ajpgi.00208.2006. [DOI] [PMC free article] [PubMed] [Google Scholar]
- 12.Lee JS, Kang Decker N, Chatterjee S, Yao J, Friedman S, Shah V. Mechanisms of nitric oxide interplay with Rho GTPase family members in modulation of actin membrane dynamics in pericytes and fibroblasts. Am J Pathol. 2005;166:1861–1870. doi: 10.1016/S0002-9440(10)62495-9. [DOI] [PMC free article] [PubMed] [Google Scholar]
- 13.Yanase M, Ikeda H, Matsui A, Maekawa H, Noiri E, Tomiya T, et al. Lysophosphatidic acid enhances collagen gel contraction by hepatic stellate cells: association with rho-kinase. Biochem Biophys Res Commun. 2000;277:72–78. doi: 10.1006/bbrc.2000.3634. [DOI] [PubMed] [Google Scholar]
- 14.Liu C, Gaca MD, Swenson ES, Vellucci VF, Reiss M, Wells RG. Smads 2 and 3 are differentially activated by transforming growth factor-beta (TGF-beta) in quiescent and activated hepatic stellate cells. Constitutive nuclear localization of Smads in activated cells is TGF-beta-independent. J Biol Chem. 2003;278:11721–11728. doi: 10.1074/jbc.M207728200. [DOI] [PubMed] [Google Scholar]
- 15.Kawada N, Seki S, Kuroki T, Kaneda K. ROCK inhibitor Y-27632 attenuates stellate cell contraction and portal pressure increase induced by endothelin-1. Biochem Biophys Res Commun. 1999;266:296–300. doi: 10.1006/bbrc.1999.1823. [DOI] [PubMed] [Google Scholar]
- 16.Burridge K, Wennerberg K. Rho and Rac take center stage. Cell. 2004;116:167–179. doi: 10.1016/s0092-8674(04)00003-0. [DOI] [PubMed] [Google Scholar]
- 17.Yee HF., Jr Rho directs activation-associated changes in rat hepatic stellate cell morphology via regulation of the actin cytoskeleton. Hepatology. 1998;28:843–850. doi: 10.1002/hep.510280336. [DOI] [PubMed] [Google Scholar]
- 18.Murata T, Arii S, Nakamura T, Mori A, Kaido T, Furuyama H, et al. Inhibitory effect of Y-27632, a ROCK inhibitor, on progression of rat liver fibrosis in association with inactivation of hepatic stellate cells. J Hepatol. 2001;35:474–481. doi: 10.1016/s0168-8278(01)00169-6. [DOI] [PubMed] [Google Scholar]
- 19.Lang P, Gesbert F, Delespine-Carmagnat M, Stancou R, Pouchelet M, et al. Protein kinase A phosphorylation of RhoA mediates the morphological and functional effects of cyclic AMP in cytotoxic lymphocytes. EMBO J. 1996;15:510–519. [PMC free article] [PubMed] [Google Scholar]
- 20.Sawada N, Itoh H, Yamashita J, Doi K, Inoue M, Masatsugu K, et al. cGMP-dependent protein kinase phosphorylates and inactivates RhoA. Biochem Biophys Res Commun. 2001;280:798–805. doi: 10.1006/bbrc.2000.4194. [DOI] [PubMed] [Google Scholar]
- 21.Aktories K. Bacterial toxins that target Rho proteins. J Clin Invest. 1997;99:827–829. doi: 10.1172/JCI119245. [DOI] [PMC free article] [PubMed] [Google Scholar]
- 22.Amano M, Ito M, Kimura K, Fukata Y, Chihara K, Nakano T, et al. Phosphorylation and activation of myosin by Rho-associated kinase (Rhokinase) J Biol Chem. 1996;271:20246–20249. doi: 10.1074/jbc.271.34.20246. [DOI] [PubMed] [Google Scholar]
- 23.Nakamura M, Nagano T, Chikama T, Nishida T. Role of the small GTP-binding protein rho in epithelial cell migration in the rabbit cornea. Invest Ophthalmol Vis Sci. 2001;42:941–947. [PubMed] [Google Scholar]
- 24.Bours MJ, Swennen EL, Di Virgilio F, Cronstein BN, Dagnelie PC. Adenosine 5’-triphosphate and adenosine as endogenous signaling molecules in immunity and inflammation. Pharmacol Ther. 2006;112:358–404. doi: 10.1016/j.pharmthera.2005.04.013. [DOI] [PubMed] [Google Scholar]
- 25.Cronstein BN. Adenosine receptors and wound healing. Scientific World-Journal. 2004;4:1–8. doi: 10.1100/tsw.2004.1. [DOI] [PMC free article] [PubMed] [Google Scholar]
- 26.Chen JF, Sonsalla PK, Pedata F, Melani A, Domenici MR, Popoli P, et al. Adenosine A2A receptors and brain injury: broad spectrum of neuroprotection, multifaceted actions and “fine tuning” modulation. Prog Neurobiol. 2007;83:310–331. doi: 10.1016/j.pneurobio.2007.09.002. [DOI] [PubMed] [Google Scholar]
- 27.DiFrancesco D, Borer JS. The funny current: cellular basis for the control of heart rate. Drugs. 2007;67(Suppl 2):15–24. doi: 10.2165/00003495-200767002-00003. [DOI] [PubMed] [Google Scholar]
- 28.Baorto DM, Mellado W, Shelanski ML. Astrocyte process growth induction by actin breakdown. J Cell Biol. 1992;117:357–367. doi: 10.1083/jcb.117.2.357. [DOI] [PMC free article] [PubMed] [Google Scholar]
- 29.Ramakers GJ, Moolenaar WH. Regulation of astrocyte morphology by RhoA and lysophosphatidic acid. Exp Cell Res. 1998;245:252–262. doi: 10.1006/excr.1998.4224. [DOI] [PubMed] [Google Scholar]
- 30.Kato M, Iwamoto H, Higashi N, Sugimoto R, Uchimura K, Tada S, et al. Role of Rho small GTP binding protein in the regulation of actin cytoskeleton in hepatic stellate cells. J Hepatol. 1999;31:91–99. doi: 10.1016/s0168-8278(99)80168-8. [DOI] [PubMed] [Google Scholar]
- 31.Morimoto Y, Wettstein M, Haussinger D. Hepatocyte heterogeneity in response to extracellular adenosine. Biochem J. 1993;293:573–581. doi: 10.1042/bj2930573. [DOI] [PMC free article] [PubMed] [Google Scholar]
- 32.Buxton DB, Fisher RA, Robertson SM, Olson MS. Stimulation of glycogenolysis and vasoconstriction by adenosine and adenosine analogues in the perfused rat liver. Biochem J. 1987;248:35–41. doi: 10.1042/bj2480035. [DOI] [PMC free article] [PubMed] [Google Scholar]
- 33.Champigneulle B, Braillon A, Kleber G, Gaudin C, Cailmail S, Lebrec D. Adenosine and hemodynamic alterations in cirrhotic rats. Am J Physiol. 1991;260:G543–G547. doi: 10.1152/ajpgi.1991.260.4.G543. [DOI] [PubMed] [Google Scholar]
- 34.Kleber G, Steudel N, Behrmann C, Zipprich A, Hubner G, Lotterer E, et al. Hepatic arterial flow volume and reserve in patients with cirrhosis: use of intra-arterial Doppler and adenosine infusion. Gastroenterology. 1999;116:906–914. doi: 10.1016/s0016-5085(99)70074-0. [DOI] [PubMed] [Google Scholar]
- 35.Zipprich A. Hemodynamics in the isolated cirrhotic liver. J Clin Gastroenterol. 2007;41:S254–S258. doi: 10.1097/MCG.0b013e318150d3b5. [DOI] [PubMed] [Google Scholar]
- 36.Zipprich A, Steudel N, Behrmann C, Meiss F, Sziegoleit U, Fleig WE, et al. Functional significance of hepatic arterial flow reserve in patients with cirrhosis. Hepatology. 2003;37:385–392. doi: 10.1053/jhep.2003.50065. [DOI] [PubMed] [Google Scholar]