

Abstract
Gene expression—based prediction of genomic copy number aberrations in the chromosomal region 12q13 to 12q15 that is flanked by MDM2 and CDK4 identified Wnt inhibitory factor 1 (WIF1) as a candidate tumor suppressor gene in glioblastoma. WIF1 encodes a secreted Wnt antagonist and was strongly downregulated in most glioblastomas as compared with normal brain, implying deregulation of Wnt signaling, which is associated with cancer. WIF1 silencing was mediated by deletion (7/69, 10%) or epigenetic silencing by promoter hypermethylation (29/110, 26%). Co-amplification of MDM2 and CDK4 that is present in 10% of glioblastomas was associated in most cases with deletion of the whole genomic region enclosed, including the WIF1 locus. This interesting pathogenetic constellation targets the RB and p53 tumor suppressor pathways in tandem, while simultaneously activating oncogenic Wnt signaling.
Ectopic expression of WIF1 in glioblastoma cell lines revealed a dose-dependent decrease of Wnt pathway activity. Furthermore, WIF1 expression inhibited cell proliferation in vitro, reduced anchorage-independent growth in soft agar, and completely abolished tumorigenicity in vivo. Interestingly, WIF1 overexpression in glioblastoma cells induced a senescence-like phenotype that was dose dependent. These results provide evidence that WIF1 has tumor suppressing properties. Downregulation of WIF1 in 75% of glioblastomas indicates frequent involvement of aberrant Wnt signaling and, hence, may render glioblastomas sensitive to inhibitors of Wnt signaling, potentially by diverting the tumor cells into a senescence-like state.
Keywords: epigenetic silencing, glioblastoma, senescence, tumor suppressor gene, WIF1, Wnt pathway
Glioblastoma is the most malignant primary brain tumor with a median survival of only 15 months despite modern therapy comprising surgical resection followed by combined radiochemotherapy.1 Thus new avenues need to be explored. High-throughput genomic data derived from human glioblastomas are readily available for analyses aiming at uncovering hitherto unrecognized disease mechanisms suitable as drugable targets, or identifying biomarkers for response to therapy. However, extracting relevant and reliable information from such data is not trivial.2 Target gene identification in tumor tissue is often complicated by (1) broad genomic copy number aberrations (CNAs), (2) multiple mechanisms of activating and inactivating genetic and epigenetic alterations, and (3) the complexity of pathway regulation. Further, the measurements may be confounded by contaminating nontumoral cells or the molecular heterogeneity of the tumor. Thus hidden tumor characteristics may only be unveiled with a multidimensional approach.3,4
Here we aimed at identifying and validating functionally new candidate genes relevant for the malignant behavior of glioblastoma. Since gene expression reflects both gene dosage effects by genomic CNAs and epigenetic modulation, we interrogated gene expression profiles derived from glioblastomas of patients treated within clinical trials5–7 to infer underlying molecular changes. In the present study we focused on the chromosomal region on chromosome 12 (12q13 to 12q15) flanked by MDM2 and CDK4 that are known to be co-amplified in approximately 10% of glioblastomas, while the region in between is generally not amplified,8 hence potentially indicating the presence of a tumor suppressor gene.
Indeed, by combining gene expression data with data from genomic copy number analysis, we identified Wnt inhibitory factor 1 (WIF1) as a new candidate tumor suppressor gene involved in glioblastoma. This gene encodes a secreted Wnt antagonist sequestering secreted Wnt proteins9,10 and is thus predestined as a candidate tumor suppressor. The interaction of WIF1 with Wnt ligands blocks their binding with the cell surface cognate receptor downregulating activation of the pathway. Hence, loss of WIF1 expression is expected to aberrantly activate Wnt signaling, which is associated with cancer. CpG island hypermethylation of the WIF1 promoter as silencing mechanism has been described in several epithelial cancers11,12 and more recently also in glioma where it seems to be associated with tumor grade.13
Here we are reporting the tumor suppressing properties of WIF1 in in vitro and in vivo models of glioblastoma and propose a mechanism of action.
Materials and Methods
Glioblastoma Tissues
Glioblastoma tissues were collected for translational research with informed consent of the patients. The protocols were approved by the local ethics committees.
Prediction of Genomic Copy Number Amplifications in Glioblastoma by a Hidden Markov Model
The glioblastoma micro-array gene expression data obtained in our laboratory on Affymetrix HG-133 Plus2.0 GeneChips (Gene Expression Omnibus database at http://www.ncbi.nlm.nih.gov/geo/, accession number GSE7696)5 were used for amplification prediction. Probe sets were filtered to exclude those with low variance, suggestive of no or constant expression of the gene. For each gene with multiple probe sets, only the one with the highest variance was retained. Input to a hidden Markov model (HMM) as observed sequences were genewise-mean-centered, the log-scale robust multi-array average normalized expression data ordered by their positions on a chromosome (http://genome.ucsc.edu/; 2004 freeze) and discretized into 8 levels of expression intensity. The HMM had 2 hidden states: The “normal” state modeled the typical distribution, while the “activated” state modeled a distribution typical for highly amplified regions, which is shifted toward higher values. It generated for each sample and chromosome a matrix of posterior state probabilities at each of the measured loci.
HMM Training
The emission probabilities of the HMM were based on frequencies of the discrete levels of expression as estimated from gene expression data for all genes from a large breast cancer sample population profiled with Affymetrix U133A chips (“normal” state) respectively from data subsets for genes in regions around the ERBB2 gene that by statistical examination of the gene expression data were considered amplified (“activated” state). A dozen of these calls were tested by reverse transcription PCR and the status of all those tested was confirmed. High posterior probabilities for the activated state are obtained for probe sets in regions where amplifications or another cause results in higher average expression of contiguous genes. In breast cancer and in glioblastoma, the method identified primarily activated regions known from the literature to be subjected to high degree amplifications (unpublished observation). Transition probabilities were estimated so that a posterior probability of 0.5 was a useful cutoff to identify amplified regions. Posterior state probabilities were computed using the Markov Modeling Tool (MAMOT) program14 with a manually curated model parameter file.
DNA Isolation, Methylation-Specific PCR
Genomic DNA was isolated from paraffin-embedded or fresh frozen tissue and subjected to bisulfite treatment using the EZ DNA Methylation Kit (Zymo Research) followed by nested methylation-specific PCR (MSP), as described previously.15 During the bisulfite treatment, unmethylated cytosine, but not its methylated counterpart, is converted into uracil. MSP for WIF1 was performed via a nested approach using published primer sequences.12 Peripheral blood lymphocytes and the colon cancer cell line SW48 were employed as the WIF1 methylation negative and positive controls, respectively.
RNA Isolation and Reverse Transcription PCR
Total RNA was extracted using the RNeasy total RNA extraction kit (Qiagen), and cDNA was synthesized using Superscript RT II (Invitrogen). PCR was performed with gene-specific primers for WIF1.12 POLR2A expression was assayed to control for mRNA integrity using published primers.16 Real-time quantitative PCR was performed with Fast SybR Green Master Mix (Applied Biosystem) using the Rotor Gene 6000 Real-Time PCR system (Corbett Life Science). PCR reactions were run as triplicates. The temperature profile was as follows: 95°C (100 s) followed by 40 cycles at 95°C (3 s) to 60°C (20 s). The quality of the products was controlled by the melting curve. Transcript levels were normalized against human GAPDH.17 WIF1 primers: Forward: 5′-AAGGTTGGCATGGAAGACAC-3′; Reverse: 5′- TTAAGTGAAGGCGTGTGCTG-3′. AXIN2 primers.18
Glioblastoma Cell Lines
Glioblastoma cell lines LN18, LN229, LN235, LN319, LN401, LN992 were established in our lab, and U87MG was obtained from the American Type Culture Collection (ATCC). All glioma cell lines have been characterized for a defined set of molecular aberrations in our lab, as published previously,19 and were controlled by DNA fingerprinting as described.20 The non–small cell lung carcinoma cell line A549 and the colon carcinoma cell line SW48 were obtained from ATCC. All lines were cultured in Dulbecco's modified Eagle's medium (Invitrogen), supplemented with 5% fetal calf serum (Hyclone) and 100 units/mL penicillin, 100 units/mL streptomycin (Invitrogen). For global demethylation of DNA, glioblastoma cell lines were treated with 5 μM 5-aza-2′-deoxycytidine (Sigma-Aldrich Chemie) for 96 h, with 24-h medium renewal.21
Plasmids and Small Interference RNAs
The Wnt/β-catenin activity luciferase reporter vectors TOP5 and FOP5 comprise T-cell factor (TCF)/β-catenin responsive elements that express synthetic firefly luciferase from a PGL4.10 backbone with a minimal TATA box with 5 concatenated TCF binding sites and 5 mutated binding sites, respectively (a generous gift of Dr M. van de Wetering).22 The pRL CMV Renilla luciferase (Promega AG) plasmid was used to normalize for transfection efficiency. The WIF1 expression vector and its empty control pcDNA3.1 vector were generous gifts from Professor Qian Tao, Cancer Center, Chinese University of Hong Kong.23 To generate the stably transfected clones in the LN229 cell line, WIF1 was subcloned into the vector pIRES2-EGFP (Clontec). WIF1 knockdown was achieved using small interference RNAs (siRNAs; ON-TARGET plus SMART pool, Dharmacon RNA Technologies) targeting 3 domains of the WIF1 RNA, and the control experiments were performed with the corresponding ON-TARGET plus nontargeting pool.
Transfection and Dual Luciferase Assay
For transient transfections, cells were grown to 80% confluence in 24-well plates. Transfections were performed with Lipofectamine 2000 transfection reagent (Invitrogen), and siRNAs were transfected with INTERFERin (Polyplus-Transfection SA) reagent as suggested by the manufacturers.
For Wnt pathway activity reporter assays, cells were transfected with 0.25 μg of either of TOP5 or FOP5 and 5 ng of Renilla pRL CMV luciferase construct, and incubated at 37°C for 28 h. Subsequently the firefly and Renilla luciferase activities were measured using Dual-Luciferase Reporter assay reagents (Promega). The Renilla luciferase activity was used to normalize for transfection efficiency. The Wnt pathway-specific activity status was determined by the TOP5/FOP5 ratio. A TOP5/FOP5 ratio significantly higher than 1 was considered as an active Wnt pathway. The cell line A549 served as positive control.24 These experiments were performed in triplicate and were replicated 2 or 3 times independently. Modulation of the Wnt pathway in established cell lines was effectuated by cotransfection of corresponding plasmids or siRNAs. In these experiments, Wnt pathway activation status was assessed 72 h post transfection. For stable transfections, cells were transfected either with the WIF1 expression vector or a control vector followed by selection with G418. Resistant clones were selected and maintained in 400 μg/mL of G418.
Crystal Violet Assay
For growth curves, 1 × 10⁴ cells were seeded in 24-well plates. At every time point, culture medium was removed, cells were washed with 1 mL of 1.0× phosphate buffered saline (PBS), and 300 μL of crystal violet solution was added per well. After 10 min at 37°C, crystal violet solution was removed and plates were washed with 1× PBS. Plates were left to dry overnight, and 500 μL of 1% sodium dodecyl sulfate in distilled water was added per well. Absorbance was then measured at 595 nm using a plate reader.
Enzyme-Linked Immunosorbent Assay
The cell supernatant, collected after 2 days of culture, was quantified for secreted WIF1 with a sandwich enzyme-linked immunosorbent assay (R&D System) following the manufacturer's instructions. Data were normalized to the cell number. For control experiments of small interfering WIF1 efficiency, the medium was collected after 3 days of culture, and data were normalized to protein content.
Colony Formation Assay in Soft Agar
Growth in soft agar was determined in 6-well plates containing 2 mL of 1% agar in complete medium as the bottom layer, and 1 mL of 0.4% agar in complete medium as the top layer. Cells, 1 × 10⁴ and 2 × 10³, respectively, were seeded in triplicate. Cultures were maintained under standard conditions, and after 3 weeks the number of colonies was determined with an inverted phase-contrast microscope, where a group of >50 cells was scored as colony.
Nude Mouse Tumorigenicity Assay
Cells (7 × 10⁶) were resuspended in Dulbecco's modified Eagle's medium and subcutaneously injected into the flanks of 6- to 9-week-old female Swiss nu/nu mice. Five mice per group were injected, and tumor size was measured weekly with a caliper. Tumor volume (mm3) was calculated as (length × width2)/2. The protocol was authorized by the local veterinary authorities (VD1181-3).
Flow Cytometry Measurement of Cell Morphology
Cells were grown until confluence detached using a solution of 2 mM ethylenediaminetetraacetic acid in PBS and resuspended in PBS. Cell size was evaluated by forward scatter (FS) and side scatter (SS) analysis using a Beckman Coulter FC500 5-color analyzer. More than 1 × 10⁴ events were counted for all samples. Thresholds for FS and SS were arbitrarily defined.
Histochemistry
Cells were seeded onto glass coverslips coated with poly-l-lysine and cultured until confluence. Cells were stained for the activity of SA-β-galactosidase using the β-Galactosidase Staining Kit (Biovision), following the manufacturer's instructions, and counterstained with 4′,6-diamidino-2-phenylindole (DAPI). SA-β-galactosidase activity and nuclear morphology were visualized by bright field and fluorescence microscopy (Leica Leitz DMRB). Cells were scored in 10 randomly taken fields.
Results
Gene Expression–Based Prediction
Gene expression profiles obtained in our lab from 80 human glioblastoma samples5 were used to infer underlying molecular alterations. Inspection of the chromosomal region encompassing CDK4 and MDM2 using an HMM predicted separate amplifications of these proto-oncogenes (Fig. 1A), that is, no co-amplification comprising the genomic region in between. Although this 2-state HMM was not constructed to detect deleted loci, we had indications of several loci with very low average and low maximum posterior probability for the activated state, thus pointing to loci potentially targeted for expression silencing. The array comparative genomic hybridization (aCGH) data of this cohort (Shay and Lambiv, manuscript in preparation) confirmed the amplifications and indicated deleted loci at positions of low amplification probability (Fig. 1B). The deleted locus in proximity to CDK4 was queried by a single Bacterial Artificial Chromosome (BAC) probe (RP11-97A6) in the aCGH data and was scored as deleted in 16 of 55 glioblastomas (29%). The minimal deleted locus in proximity to MDM2 affected 2 BACs (RP11-109L8 and RP11-18B8), spanning approximately 1.5 Mb and encompassing 6 known genes (WIF1, LEMD3, MSRB3, HMGA2, IRAK3, and HELB) (http://genome.ucsc.edu/; 2004 freeze, hg17). Deletion of this locus affected 7 of 69 (10%) glioblastomas. Of note, most samples with co-amplification of MDM2 and CDK4 exhibited a deletion of the genomic region between these 2 loci, suggesting a merged amplicon (Fig. 1C). Hence, this interesting pathogenetic constellation combines amplification of 2 oncogenes plus deletion of putative tumor suppressor genes in a single event. This CNA pattern was confirmed in the database of The Cancer Genome Atlas (TCGA)25 (Supplementary Fig. S1). Among the potential candidate target genes, WIF1 showed the largest mRNA expression variation in this data set, and median WIF1 expression was significantly lower in glioblastoma than in 4 nonneoplastic brain tissues (P = .001, 2-sample Wilcoxon test) (Fig. 1D). The other genes exerted expression levels similar to those of normal brain tissue and/or showed relatively low variation in our data set. The low expression of WIF1 in glioblastoma was confirmed in all 5 independent glioblastoma data sets analyzed26–30 (Fig. 1E). Furthermore, decreasing expression of WIF1 is associated with tumor grade in astrocytoma, as suggested by 2 independent data sets.31,32 WIF1 encodes a soluble Wnt pathway antagonist sequestering Wnt proteins, thereby inhibiting their function.9 Since Wnt signaling is proto-oncogenic,33 modulators/antagonists of Wnt signaling are good candidates for tumor suppressor functions.34
Fig. 1.

Gene expression–based prediction of copy number aberrations (CNAs) in glioblastoma. (A) The maximum (red) and mean (blue) amplification probabilities on chromosome 12q14–12q15 were estimated from glioblastoma gene expression data by a hidden Markov model (HMM). The interrogated region flanked by CDK4 and MDM2 encompasses a ∼11 Mb window. (B) The respective mean DNA copy number of this chromosomal region was determined by array comparative genomic hybridization (aCGH, Humarray 3.0 and 3.1 of the University of California at San Francisco; manuscript in preparation). The bacterial artificial chromosome (BAC) probes are ordered by their genomic positions. The BACs corresponding to CDK4 and MDM2 BACs are shown in red. (C) The heat map visualizes the structure of the aCGH data shown in (B) for the genomic region encompassing 12q13 to 12q15 from 68 glioblastomas. The BACs are ordered by their genomic position, while the glioblastomas on the x-axis are ordered by similarity using Sorting Points into Neighborhood software.57 Blue depicts deletion; red, amplification; and white, missing data. The color scale is truncated to [−1, 1] for presentation. The BAC corresponding to CDK4 is GS-561N1; for MDM2, CTB-136O14 (red); and for WIF1, RP11-18B8 (blue). (D) WIF1 expression (Affymetrix probe set 204712_at) in glioblastoma is significantly lower than in nonneoplastic brain tissues (P = .001), as determined in our gene expression data set.5 (E) Low WIF1 expression was confirmed in 5 independent glioblastoma data sets (Freije et al., red; Rich et al., violet; Phillips et al., orange; Sun et al., dark blue; Horvath et al., green; our data set, Murat et al., light blue).26–30 WIF1 expression values are median centered within each data set independently.
WIF1 is Silenced Both by Genomic Deletion and Promoter Hypermethylation
While expression data suggested low WIF1 expression in 76% of glioblastomas of our gene expression data set, corresponding analysis of the aCGH data showed hemizygous deletions at the WIF1 locus in only 10% (7/69), suggesting other mechanisms of silencing. Subsequent analysis of the WIF1 promoter by MSP revealed hypermethylation in 2 of 6 glioblastomas with hemizygous deletion, satisfying the 2-hit model of tumor suppressors. In an extended series of 110 glioblastomas, 26% exerted a methylated WIF1 promoter (Fig. 2). WIF1 mutations have not been reported from glioblastoma (0/444), according to the Catalogue of Somatic Mutations in Cancer (COSMIC) database.35
Fig. 2.

Promoter methylation of WIF1 in glioblastoma. Methylation-specific PCR (MSP) for WIF1 was performed via a nested approach using published primer sequences.12 DNA isolated from peripheral blood lymphocytes (PBLs) and the colon cancer cell line SW48 served as controls for unmethylated (U) and methylated (M) WIF1 promoter status, respectively. Glioblastomas #2445, #2447, and #2448 contain a methylated WIF1 promoter, whereas the others harbor only an unmethylated gene promoter.
Interestingly, a significant association with methylation of the O6-methylguanine DNA-methyltransferase (MGMT) promoter was observed (P = .004, 2-sided Fisher exact test). MGMT methylation is a known predictive factor for response to alkylating agent therapy in glioblastoma.15,36 The MGMT methylation status was available for 107 cases from previous studies, of which 56 were MGMT methylated (52%).5,37–40 Most established glioblastoma cell lines (14 of 15) showed hypermethylation of the WIF1 promoter. Only LN992 exhibited an unmethylated WIF1 promoter. Treatment of glioblastoma cell lines with the DNA demethylating agent 5-aza-cytidine for 96 h restored WIF1 expression (Fig. 3A).
Fig. 3.

Alteration of WIF1 expression modulates Wnt signaling. (A) Glioblastoma cell lines were treated with the DNA demethylating agent 5-aza-cytidine for 4 days. All 3 WIF1 nonexpressing cell lines with a methylated WIF1 promoter re-expressed WIF1 mRNA in response to 5-aza-cytidine treatment (LN319, LN401, U87). Only LN992 was completely unmethylated. The lower panel shows mRNA expression of the POLR2A gene used to control for mRNA quality. The methylation status of the cell lines displayed was determined by MSP. (B) Wnt signaling activity was measured with the TCF luciferase reporter (TOP5/FOP5; ratio >1 Wnt pathway active). The non–small cell lung carcinoma cell line A549 served as positive control. LN235 and LN992 show no significant activity. (C) Wnt signaling (TOP5/FOP5) after cotransfection of increasing amounts (0 μg, 0.5 μg, and 1 μg) of the WIF1 expression vector into glioblastoma cell lines U87, LN319, LN401, and A549. The DNA quantity was adjusted with the control vector. (D). LN235 and LN992, negative for Wnt signaling activity, were transfected with siWIF1 and the siScrambled as control. Knockdown of WIF1 induced Wnt pathway activity (TOP5/FOP5) in both LN992 and LN235. WIF1 expression measured after transfection of siWIF1 or the respective control siRNAs is documented in Supplementary Fig. S2. Results are marked with 1 asterisk (*) if P< .05 and 2 (**) if P < .01.
Modulation of WIF1 Expression Affects Wnt Pathway Activation
Wnt pathway activity was tested in a set of 7 glioblastoma cell lines using the TOP5/FOP5 Wnt signaling reporter system that investigates transactivation of the TCF responsive element (5 concatenated TCF binding sites) normalized to transactivation of the corresponding mutated binding sites (5 concatenated mutated TCF binding sites). Wnt pathway activity was present in all cell lines with low or no detectable WIF1 expression, while LN235 and LN992 showed no significant Wnt activity (TOP5/FOP5 ≤ 1), in accordance with high levels of endogenous WIF1 expression (Fig. 3A and B). Given the role of WIF1 in regulation of Wnt signaling, and the prevalence of low WIF1 expression in glioblastoma, we first investigated the glioblastoma cell lines with endogenous Wnt pathway activity and asked if WIF1 overexpression translates into impaired Wnt signaling. Indeed, forced expression of WIF1 inhibited Wnt activity in a dose-dependent manner (Fig. 3C). Next we examined whether in the 2 cell lines with endogenous WIF1 expression and no Wnt signaling activity (LN992 and LN235, Fig. 3A and B) the pathway could be activated upon WIF1 silencing. Using siRNA to knock down WIF1 expression, we detected induction of Wnt signaling activity in both cell lines, in contrast to the controls with nontargeting siRNAs (Fig. 3D, Supplementary Fig. S2).
WIF1 Expression Decreases Anchorage-Dependent and Anchorage-Independent Growth
We further investigated the biological effects of WIF1 in the glioblastoma cell lines LN319 and U87. Stably transfected cell clones were characterized for WIF1 expression and WIF1 secretion and their effect on cell growth (Fig. 4A and B). WIF1 overexpressing LN319 cells showed reduced Wnt pathway activity (P < .005) compared with the respective control cells (Fig. 4C). The downregulation of the canonical pathway was also confirmed by measuring the expression of AXIN2, a prototypic Wnt target gene41 (Fig. 4D). The specificity of the observed effect on the Wnt pathway was determined by silencing of WIF1 by siRNAs. WIF1 knockdown indeed rescued transactivation of the TCF reporter in the ectopically expressing WIF1 LN319 cells, confirming that the detected attenuation of the Wnt pathway was indeed WIF1 dependent (Fig. 4E and F). Glioblastoma cell lines LN229 and U87 were analyzed accordingly. While experiments in LN229 confirmed these results (Supplementary Fig. S3), U87 cells became invariably resistant to ectopic WIF1 expression over time (passages 20 to 25), although initially sensitive (Fig. 3C). In some cases, clones had lost or attenuated WIF1 expression/secretion, regardless of continued selection with G418 (Supplementary Fig. S4A). However, most clones gained Wnt pathway activity despite WIF1 expression and WIF1 secretion. Furthermore, cells were no longer sensitive to knockdown of WIF1 expression, reflected in no notable increase of pathway activity (Supplementary Fig. S4B and C).
Fig. 4.

LN319 cell clones stably transfected with WIF1 show reduced Wnt pathway signaling. Two stably transfected LN319 clones were analyzed for WIF1 expression by qRT-PCR (normalized to the control cells transfected with the empty vector, pcDNA3.1) (A) and WIF1 secretion by enzyme-linked immunosorbent assay (ELISA) (B). Wnt pathway signaling was measured both with the TCF luciferase reporter (TOP5/FOP5) and normalized to the control cells (C) and by measuring AXIN2 mRNA expression (D). The specificity of the WIF1-induced effects in the 2 clones was controlled by transfection of specific siRNAs against WIF1 or a respective scrambled control. Wnt pathway signaling was measured using the TCF reporter (E) and WIF1 secretion using ELISA (F). Results are marked with 1 asterisk (*) if P< .05 and 2 (**) if P < .01.
The WIF1-expressing cell clones were utilized to investigate the effect of WIF1-mediated downregulation of the Wnt pathway on proliferation. Anchorage-dependent proliferation measured over 3 days was significantly decreased (P < .005) in WIF1-overexpressing LN319 clones (Fig. 5A). Even more striking results were obtained investigating the effects on anchorage-independent cell growth. The ability to form colonies in soft agar after 3 weeks of culture was indeed greatly reduced upon WIF1 overexpression (Fig. 5B and C). During the soft agar experiment, we observed that WIF1-overexpressing clones were initially able to proliferate, forming very small clusters of cells, but then stopped dividing after a few days, potentially in response to increasing concentrations of secreted WIF1. In accordance, the colony formation potential was reduced in a WIF1 dose-dependent manner. The high expressing WIF1 clone LN319-WIF1_C2 displayed 90% fewer colonies, while in the intermediate clone LN319-WIF1_C6, the colony number was reduced by 63%. Similar results were obtained in LN229 (Supplementary Fig. S3A–E). In contrast, the corresponding experiments in WIF1 stably transduced U87 clones showed initially reduced growth potential that was lost at later passage (passage 4 vs passages 20 to 25) (Supplementary Fig. S4D and E), in line with the observed gain of resistance to WIF1 expression, as detailed above (Supplementary Fig. S4B and C).
Fig. 5.

WIF1 overexpression reduces the growth potential of LN319 cells in vitro and in vivo. Growth of WIF1-transduced LN319 clones and the respective empty vector control (pcDNA3.1) was followed over 3 days in culture (A). Anchorage-independent growth was evaluated in soft agar; representative images are shown (B). The average number of colonies counted in 10 randomly chosen fields is reported (C). Tumor growth kinetics of nude mouse xenografts, after subcutaneous injection of WIF1-overexpressing clones and the corresponding empty vector control cells are displayed. The WIF1-overexpressing clones did not form any measurable tumors. The average tumor volume per group (5 mice) is reported (D). Results are marked with 1 asterisk (*) if P < .05 and 2 (**) if P < .01.
WIF1 Suppresses Tumorigenicity in a Xenograft Mouse Model
Ectopic expression of WIF1 in LN319 cells completely suppressed the inherent tumorigenicity of this glioblastoma cell line. While mice injected with control cells started to develop tumors 25 days after injection, no tumors were detectable in the mice injected with WIF1-expressing cell clones over the observation period of 100 days (Fig. 5D). In contrast, the 2 tested WIF1-transduced U87 clones retained tumorigenicity similar to the vector control, in line with development of resistance to WIF1 in vitro. Altogether, these experiments suggest an important role of the Wnt pathway in the development of glioblastoma and a tumor suppressing function for WIF1.
WIF1 Overexpression Promotes a Senescence-like Proliferation Arrest
Observation of WIF1-overexpressing cells (LN319 and LN229) until confluence revealed a striking change in morphology. While control cells started to grow on top of each other without apparent contact inhibition, the WIF1-expressing cells displayed a phenotype reminiscent of senescent cells with increased cell size. Next we evaluated recognized markers for senescence, including enhanced granularity of the cytoplasm, appearance of multinucleated cells, and presence of senescence-associated β-galactosidase activity.42,43 Quantification of morphological changes was performed using fluorescence-activated cell sorting analysis. Senescence-like cells were defined as: highly granulated cells = high SS; big cells = high FS. We detected an increased percentage of senescence-like cells in WIF1-transfected clones with a positive relationship to WIF1 secretion of the respective clones (Fig. 6A and B, Supplementary Fig. S3F and G). Similar differences were observed upon double staining of the cells with SA-β-galactosidase and DAPI, which visualizes nuclear morphology. In the LN319- and LN229-derived WIF1-overexpressing clones, we scored an increased population of both multinucleated and SA-β-galactosidase positive cells (Fig. 6C–F).
Fig. 6.

WIF1 expression and detection of senescence-like cells. Cell morphology of the different LN319 clones was analyzed by fluorescence-activated cell sorting (FACS) (A). Senescence-like cells were defined as highly granulated cells, high side scatter (SS) (blue rectangle), and big cells, high forward scatter (FS) (red rectangle). (B) Quantification of FACS analysis, % of highly granulated cells (SS high, blue), and % of both highly granulated and big cells (FS and SS high, red). Quantification of LN319 (C) and LN229 (E) cells positive for SA-β-galactosidase activity scored in 10 different randomly chosen fields. (D, F) Representative images of clones stained for SA-β-galactosidase and DAPI are shown (200×). Large, SA-β-galactosidase positive (blue) and multinucleated cells are highlighted with red arrows. Results are marked with 1 asterisk (*) if P < .05 and 2 (**) if P < .01.
Discussion
Little is known about the role of the Wnt pathway in the malignant behavior of human glioblastoma. Using a combined genomics approach, we provided evidence that the Wnt antagonist WIF1 is targeted for silencing in glioblastoma, hence represents a good candidate tumor suppressor. In most glioblastomas, WIF1 silencing is mediated by genomic deletion, promoter hypermethylation, or both. A recent study supports a role for a deregulated Wnt pathway in malignant glioma, showing that additional Wnt pathway inhibitors are epigenetically inactivated, including the family of secreted frizzled-related proteins, dickkopf, and naked.44 In contrast, mutations in β-catenin (CTNNB1) and APC are rare in glioblastoma (1/180 and 1/152; https://cma.nci.nih.gov/cma-tcga/geneView/index).25
Here we demonstrated that forced WIF1 expression significantly reduced Wnt signaling in glioblastoma cell lines, while knockdown of WIF1 induced the pathway. This effect was paralleled by a WIF1 dose-dependent attenuation of cell proliferation in vitro, particularly striking for anchorage-independent growth, and associated with complete abrogation of tumorigenicity. However, the highly malignant glioblastoma cell line U87, although initially sensitive, escaped the effect by either suppressing ectopic expression of WIF1 or by becoming functionally resistant to WIF1 expression over time, restoring activation of the Wnt pathway. In ephitelial and mesenchymal tumors, a tumor suppressing role for WIF1 has been proposed. In gastrointestinal cancer cell lines, restoration of WIF1 expression was shown to reduce growth in vitro,11 and in cell lines from human renal cell carcinoma, prostate cancer, and osteosarcoma WIF1 overexpression has been reported to inhibit tumor growth in vivo.45–47
Here, we propose a mechanism by which WIF1 overexpression may exert the growth-inhibiting effect. The WIF1-dependent emergence of enlarged, flattened cells associated with increased detection of SA-β-galactosidase positive, multinucleated cells suggests that WIF1 overexpression induces a senescence-like phenotype in glioblastoma cells. Wnt signaling is involved in diverse processes, from early embryonic patterning34 to regulation of stem cell self-renewal and differentiation.48,49 Consequently, Wnt pathway dysregulation can dramatically alter differentiation and cell fate decisions.50 Recently, Ye et al.51 reported that downregulation of canonical Wnt signaling was directly associated with the onset of cell senescence in primary human cells. Indeed, in human primary fibroblasts, the process that leads to the formation of senescence-associated heterochromatin foci (SAHF), an early marker of senescence, was initiated upon activation of GSK3β, a key effector of the repressed Wnt signaling pathway.52 This Wnt-dependent formation of SAHF is independent of the RB1 and TP53 pathways, 2 tumor suppressor pathways frequently inactivated in glioblastoma. Thus, induction of senescence via Wnt pathway inhibition may prove a promising therapeutic strategy.
The CNA patterns reported in this study have a most interesting feature: Most of the glioblastomas with a deletion at the WIF1 locus have concomitant high-level amplifications of the proto-oncogenes CDK4 and MDM2 (Fig. 1C), probably organized extrachromosomally in double minutes. This may suggest that the CNAs of this CHR12q14-15 locus alone, combining co-amplification of CDK4 and MDM2 with deletion of the chromosomal region in between, subverts in 1 genetic event 2 important tumor suppressing pathways, the RB- and TP53-pathway, respectively, while simultaneously activating proto-oncogenic Wnt signaling (Fig. 7). Of note, the RB1 and TP53 tumor suppressor pathways are themselves important effectors of senescence. This observation was confirmed in the large TCGA glioblastoma data set (Supplementary Fig. S1) and underlines the need for concerted targeting of signaling pathways that cooperate in glioblastoma, including the Wnt pathway. Specific inhibitors for CDK4 and MDM2 are in clinical development.53 Small molecule inhibitors targeting the Wnt pathway by novel mechanisms have been proposed recently. They comprise inhibitors of Wnt production by targeting Porcn, and inhibitors of Wnt response that stabilize Axin, promoting the association of β-catenin with the destruction complex,54,55 or β-catenin interaction disruptors preventing β-catenin from associating with TCF or cAMP response element binding. The observation of frequent inactivation of genes coding for secreted Wnt antagonists in glioma may favor the use of inhibitors of Wnt production or the development of molecules sequestering Wnt family members. Such intervention may have the additional advantage of interfering with tumor angiogenesis, since the ligands Wnt7a/7b have been shown to be involved in brain angiogenesis and induction of the blood-brain barrier, both relevant factors for glioma vascularization and therapy.56
Fig. 7.
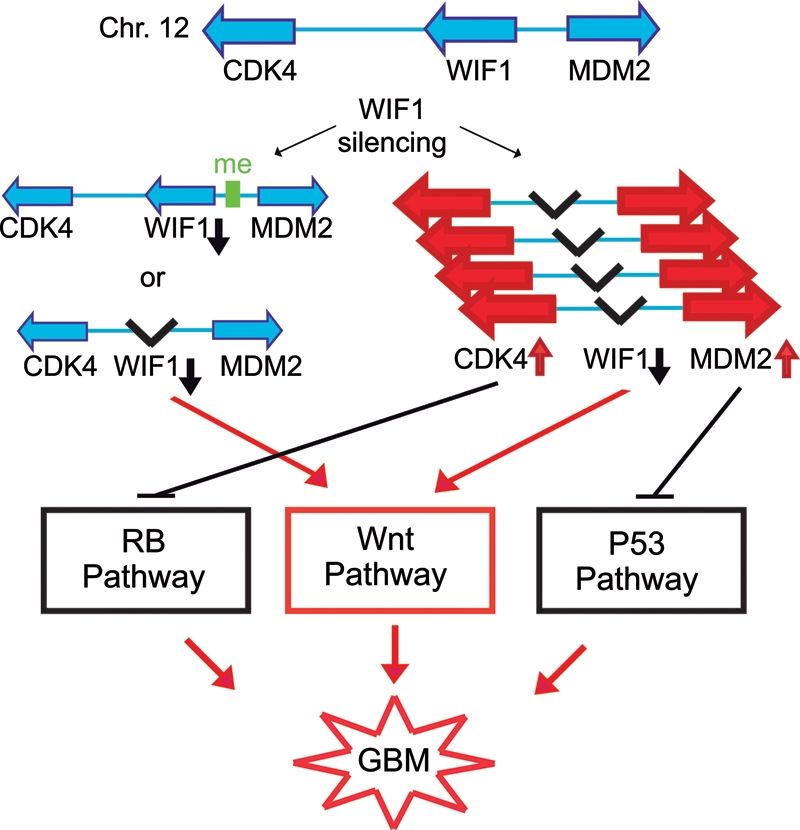
Model for mechanisms implicated in deregulation of both tumor suppressing and proto-oncogenic pathways on chromosome 12. The model suggests that deletion at the WIF1 locus, if concomitant with amplification of the proto-oncongenes CDK4 and MDM2, can subvert the important tumor suppressing pathways regulated by RB1 and TP53 while simultaneously activating proto-oncogenic Wnt signaling.
The present study provides the rationale for investigating inhibitors of Wnt signaling in glioblastoma as a new avenue for individualized therapy. The addition of a Wnt pathway inhibitor to the current standard of care of combined radiochemotherapy with the alkylating agent temozolomide may improve outcomes particularly in patients whose tumors carry a methylated MGMT promoter,15 due to the significant association with WIF1 methylation. However, the importance of the Wnt pathway that is interlinked with other mitogenic pathways may rapidly select for resistance in a corresponding single-agent therapy, as suggested by the experiments with the highly malignant glioblastoma cell line U87.
Supplementary Material
Funding
Nélia and Amadeo Barletta Foundation (W.L.L., M.E.H., R.S.), The Brain Tumor Funders Cooperative (M.E.H), and the National Center of Competence in Research Molecular Oncology (M.E.H., E.M., M.D., A.M.), Swiss National Science Foundation (31003A_122557, M.E.H., M.D., I.V.), and the Leir Charitable Foundation (T.S., E.D.).
Supplementary Material
Acknowledgments
We are indebted to the patients for consenting to donate their tumor tissue for translational research. We thank Dr. Vincent Castella for excellent technical support.
Conflict of interest statement. None declared.
References
- 1.Stupp R, Hegi ME, Mason WP, et al. Effects of radiotherapy with concomitant and adjuvant temozolomide versus radiotherapy alone on survival in glioblastoma in a randomised phase III study: 5-year analysis of the EORTC-NCIC trial. Lancet Oncol. 2009;10(5):459–466. doi: 10.1016/S1470-2045(09)70025-7. doi:10.1016/S1470-2045(09)70025-7. [DOI] [PubMed] [Google Scholar]
- 2.Ein-Dor L, Zuk O, Domany E. Thousands of samples are needed to generate a robust gene list for predicting outcome in cancer. Proc Natl Acad Sci USA. 2006;103(15):5923–5928. doi: 10.1073/pnas.0601231103. doi:10.1073/pnas.0601231103. [DOI] [PMC free article] [PubMed] [Google Scholar]
- 3.McLendon R, Friedman A, Bigner D, et al. Comprehensive genomic characterization defines human glioblastoma genes and core pathways. Nature. 2008;455(7216):1061–1068. doi: 10.1038/nature07385. [DOI] [PMC free article] [PubMed] [Google Scholar]
- 4.Parsons DW, Jones S, Zhang X, et al. An integrated genomic analysis of human glioblastoma multiforme. Science. 2008;321(5897):1807–1812. doi: 10.1126/science.1164382. doi:10.1126/science.1164382. [DOI] [PMC free article] [PubMed] [Google Scholar]
- 5.Murat A, Migliavacca E, Gorlia T, et al. Stem cell-related “self-renewal” signature and high epidermal growth factor receptor expression associated with resistance to concomitant chemoradiotherapy in glioblastoma. J Clin Oncol. 2008;26(18):3015–3024. doi: 10.1200/JCO.2007.15.7164. doi:10.1200/JCO.2007.15.7164. [DOI] [PubMed] [Google Scholar]
- 6.Stupp R, Mason WP, van den Bent MJ, et al. Radiotherapy plus concomitant and adjuvant temozolomide for glioblastoma. N Engl J Med. 2005;352(10):987–996. doi: 10.1056/NEJMoa043330. doi:10.1056/NEJMoa043330. [DOI] [PubMed] [Google Scholar]
- 7.Stupp R, Dietrich P, Ostermann Kraljevic S, et al. Promising survival for patients with newly diagnosed glioblastoma multiforme treated with concomitant radiation plus temozolomide followed by adjuvant temozolomide. J Clin Oncol. 2002;20(5):1375–1382. doi: 10.1200/JCO.2002.20.5.1375. doi:10.1200/JCO.20.5.1375. [DOI] [PubMed] [Google Scholar]
- 8.Reifenberger G, Ichimura K, Reifenberger J, Elkahloun AG, Meltzer PS, Collins VP. Refined mapping of 12q13-q15 amplicons in human malignant gliomas suggests CDK4/SAS and MDM2 as independent amplification targets. Cancer Res. 1996;56(22):5141–5145. [PubMed] [Google Scholar]
- 9.Hsieh JC, Kodjabachian L, Rebbert ML, et al. A new secreted protein that binds to Wnt proteins and inhibits their activities. Nature. 1999;398(6726):431–436. doi: 10.1038/18899. [DOI] [PubMed] [Google Scholar]
- 10.Kawano Y, Kypta R. Secreted antagonists of the Wnt signalling pathway. J Cell Sci. 2003;116(Pt 13):2627–2634. doi: 10.1242/jcs.00623. doi:10.1242/jcs.00623. [DOI] [PubMed] [Google Scholar]
- 11.Taniguchi H, Yamamoto H, Hirata T, et al. Frequent epigenetic inactivation of Wnt inhibitory factor-1 in human gastrointestinal cancers. Oncogene. 2005;24(53):7946–7952. doi: 10.1038/sj.onc.1208910. doi:10.1038/sj.onc.1208910. [DOI] [PubMed] [Google Scholar]
- 12.Urakami S, Shiina H, Enokida H, et al. Epigenetic inactivation of Wnt inhibitory factor-1 plays an important role in bladder cancer through aberrant canonical Wnt/beta-catenin signaling pathway. Clin Cancer Res. 2006;12(2):383–391. doi: 10.1158/1078-0432.CCR-05-1344. doi:10.1158/1078-0432.CCR-05-1344. [DOI] [PubMed] [Google Scholar]
- 13.Yang Z, Wang Y, Fang J, Chen F, Liu J, Wu J. Expression and aberrant promoter methylation of Wnt inhibitory factor-1 in human astrocytomas. J Exp Clin Cancer Res. 2010;29:26. doi: 10.1186/1756-9966-29-26. doi:10.1186/1756-9966-29-26. [DOI] [PMC free article] [PubMed] [Google Scholar]
- 14.Schutz F, Delorenzi M. MAMOT: hidden Markov modeling tool. Bioinformatics. 2008;24(11):1399–1400. doi: 10.1093/bioinformatics/btn201. doi:10.1093/bioinformatics/btn201. [DOI] [PubMed] [Google Scholar]
- 15.Hegi ME, Diserens AC, Gorlia T, et al. MGMT gene silencing and benefit from temozolomide in glioblastoma. New Engl J Med. 2005;352(10):997–1003. doi: 10.1056/NEJMoa043331. doi:10.1056/NEJMoa043331. [DOI] [PubMed] [Google Scholar]
- 16.Murat A, Migliavacca E, Hussain SF, et al. Modulation of angiogenic and inflammatory response in glioblastoma by hypoxia. PLoS ONE. 2009;4(6):e5947. doi: 10.1371/journal.pone.0005947. doi:10.1371/journal.pone.0005947. [DOI] [PMC free article] [PubMed] [Google Scholar]
- 17.Andreeff M, Ruvolo V, Gadgil S, et al. HOX expression patterns identify a common signature for favorable AML. Leukemia. 2008;22(11):2041–2047. doi: 10.1038/leu.2008.198. doi:10.1038/leu.2008.198. [DOI] [PMC free article] [PubMed] [Google Scholar]
- 18.Lal M, Song X, Pluznick JL, et al. Polycystin-1 C-terminal tail associates with beta-catenin and inhibits canonical Wnt signaling. Hum Mol Genet. 2008;17(20):3105–3117. doi: 10.1093/hmg/ddn208. doi:10.1093/hmg/ddn208. [DOI] [PMC free article] [PubMed] [Google Scholar]
- 19.Ishii N, Maier D, Merlo A, et al. Frequent co-alterations of TP53, p16/CDKN2A, p14ARF, PTEN tumor suppressor genes in human glioma cell lines. Brain Pathol. 1999;9(3):469–479. doi: 10.1111/j.1750-3639.1999.tb00536.x. [DOI] [PMC free article] [PubMed] [Google Scholar]
- 20.Lorenzi PL, Reinhold WC, Varma S, et al. DNA fingerprinting of the NCI-60 cell line panel. Mol Cancer Ther. 2009;8(4):713–724. doi: 10.1158/1535-7163.MCT-08-0921. doi:10.1158/1535-7163.MCT-08-0921. [DOI] [PMC free article] [PubMed] [Google Scholar]
- 21.Foltz G, Ryu GY, Yoon JG, et al. Genome-wide analysis of epigenetic silencing identifies BEX1 and BEX2 as candidate tumor suppressor genes in malignant glioma. Cancer Res. 2006;66(13):6665–6674. doi: 10.1158/0008-5472.CAN-05-4453. doi:10.1158/0008-5472.CAN-05-4453. [DOI] [PubMed] [Google Scholar]
- 22.Hatzis P, van der Flier LG, van Driel MA, et al. Genome-wide pattern of TCF7L2/TCF4 chromatin occupancy in colorectal cancer cells. Mol Cell Biol. 2008;28(8):2732–2744. doi: 10.1128/MCB.02175-07. doi:10.1128/MCB.02175-07. [DOI] [PMC free article] [PubMed] [Google Scholar]
- 23.Chan SL, Cui Y, van Hasselt A, et al. The tumor suppressor Wnt inhibitory factor 1 is frequently methylated in nasopharyngeal and esophageal carcinomas. Lab Invest. 2007;87(7):644–650. doi: 10.1038/labinvest.3700547. doi:10.1038/labinvest.3700547. [DOI] [PubMed] [Google Scholar]
- 24.You L, He B, Xu Z, et al. Inhibition of Wnt-2-mediated signaling induces programmed cell death in non-small-cell lung cancer cells. Oncogene. 2004;23(36):6170–6174. doi: 10.1038/sj.onc.1207844. doi:10.1038/sj.onc.1207844. [DOI] [PubMed] [Google Scholar]
- 25.The Cancer Genome Atlas Consortium. Comprehensive genomic characterization defines human glioblastoma genes and core pathways. Nature. 2008;455(7216):1061–1068. doi: 10.1038/nature07385. [DOI] [PMC free article] [PubMed] [Google Scholar]
- 26.Freije WA, Castro-Vargas FE, Fang Z, et al. Gene expression profiling of gliomas strongly predicts survival. Cancer Res. 2004;64(18):6503–6510. doi: 10.1158/0008-5472.CAN-04-0452. doi:10.1158/0008-5472.CAN-04-0452. [DOI] [PubMed] [Google Scholar]
- 27.Rich JN, Hans C, Jones B, et al. Gene expression profiling and genetic markers in glioblastoma survival. Cancer Res. 2005;65(10):4051–4058. doi: 10.1158/0008-5472.CAN-04-3936. doi:10.1158/0008-5472.CAN-04-3936. [DOI] [PubMed] [Google Scholar]
- 28.Phillips HS, Kharbanda S, Chen R, et al. Molecular subclasses of high-grade glioma predict prognosis, delineate a pattern of disease progression, and resemble stages in neurogenesis. Cancer Cell. 2006;9(3):157–173. doi: 10.1016/j.ccr.2006.02.019. doi:10.1016/j.ccr.2006.02.019. [DOI] [PubMed] [Google Scholar]
- 29.Sun L, Hui AM, Su Q, et al. Neuronal and glioma-derived stem cell factor induces angiogenesis within the brain. Cancer Cell. 2006;9(4):287–300. doi: 10.1016/j.ccr.2006.03.003. doi:10.1016/j.ccr.2006.03.003. [DOI] [PubMed] [Google Scholar]
- 30.Horvath S, Zhang B, Carlson M, et al. Analysis of oncogenic signaling networks in glioblastoma identifies ASPM as a molecular target. Proc Natl Acad Sci USA. 2006;103(46):17402–17407. doi: 10.1073/pnas.0608396103. doi:10.1073/pnas.0608396103. [DOI] [PMC free article] [PubMed] [Google Scholar]
- 31.Laffaire J, Everhard S, Idbaih A, et al. Methylation profiling identifies 2 groups of gliomas according to their tumorigenesis. Neuro Oncol. 2010;2010:8. doi: 10.1093/neuonc/noq110. [DOI] [PMC free article] [PubMed] [Google Scholar]
- 32.Yang Z, Wang Y, Fang J, et al. Downregulation of WIF-1 by hypermethylation in astrocytomas. Acta Biochim Biophys Sin (Shanghai) 2010;42(6):418–425. doi: 10.1093/abbs/gmq037. doi:10.1093/abbs/gmq037. [DOI] [PubMed] [Google Scholar]
- 33.Nusse R, Varmus HE. Many tumors induced by the mouse mammary tumor virus contain a provirus integrated in the same region of the host genome. Cell. 1982;31(1):99–109. doi: 10.1016/0092-8674(82)90409-3. doi:10.1016/0092-8674(82)90409-3. [DOI] [PubMed] [Google Scholar]
- 34.Moon RT, Brown JD, Torres M. WNTs modulate cell fate and behavior during vertebrate development. Trends Genet. 1997;13(4):157–162. doi: 10.1016/s0168-9525(97)01093-7. doi:10.1016/S0168-9525(97)01093-7. [DOI] [PubMed] [Google Scholar]
- 35.Forbes SA, Tang G, Bindal N, et al. COSMIC (the Catalogue of Somatic Mutations in Cancer): a resource to investigate acquired mutations in human cancer. Nucleic Acids Res. 2010;38(Database issue):D652–D657. doi: 10.1093/nar/gkp995. doi:10.1093/nar/gkp995. [DOI] [PMC free article] [PubMed] [Google Scholar]
- 36.Hegi ME, Liu L, Herman JG, et al. Correlation of O6-methylguanine methyltransferase (MGMT) promoter methylation with clinical outcomes in glioblastoma and clinical strategies to modulate MGMT activity. J Clin Oncol. 2008;26(25):4189–4199. doi: 10.1200/JCO.2007.11.5964. doi:10.1200/JCO.2007.11.5964. [DOI] [PubMed] [Google Scholar]
- 37.Hegi ME, Diserens AC, Godard S, et al. Clinical trial substantiates the predictive value of O-6-methylguanine-DNA methyltransferase promoter methylation in glioblastoma patients treated with temozolomide. Clin Cancer Res. 2004;10(6):1871–1874. doi: 10.1158/1078-0432.ccr-03-0384. doi:10.1158/1078-0432.CCR-03-0384. [DOI] [PubMed] [Google Scholar]
- 38.Vlassenbroeck I, Califice S, Diserens AC, et al. Validation of real-time methylation-specific PCR to determine O6-methylguanine-DNA methyltransferase gene promoter methylation in glioma. J Mol Diagn. 2008;10(4):332–337. doi: 10.2353/jmoldx.2008.070169. doi:10.2353/jmoldx.2008.070169. [DOI] [PMC free article] [PubMed] [Google Scholar]
- 39.Beier CP, Schmid C, Gorlia T, et al. Pegylated liposomal doxorubicine and prolonged temozolomide in addition to radiotherapy in newly diagnosed glioblastoma - a phase II study. BMC Cancer. 2009;9:308. doi: 10.1186/1471-2407-9-308. doi:10.1186/1471-2407-9-308. [DOI] [PMC free article] [PubMed] [Google Scholar]
- 40.Hegi ME, zur Hausen A, Ruedi D, Malin G, Kleihues P. Hemizygous or homozygous deletion of the chromosomal region containing the p16INK4a gene is associated with amplification of the EGF receptor gene in glioblastomas. Int J Cancer. 1997;73(1):57–63. doi: 10.1002/(sici)1097-0215(19970926)73:1<57::aid-ijc10>3.0.co;2-2. doi:10.1002/(SICI)1097-0215(19970926)73:1<57::AID-IJC10>3.0.CO;2-2. [DOI] [PubMed] [Google Scholar]
- 41.Jho E-h, Zhang T, Domon C, Joo C-K, Freund J-N, Costantini F. Wnt/{beta}-Catenin/Tcf Signaling Induces the Transcription of Axin2, a Negative Regulator of the Signaling Pathway. Mol Cell Biol. 2002;22(4):1172–1183. doi: 10.1128/MCB.22.4.1172-1183.2002. doi:10.1128/MCB.22.4.1172-1183.2002. [DOI] [PMC free article] [PubMed] [Google Scholar]
- 42.Matsumura T. Multinucleation and polyploidization of aging human cells in culture. Adv Exp Med Biol. 1980;129:31–38. doi: 10.1007/978-1-4684-3734-8_4. [DOI] [PubMed] [Google Scholar]
- 43.Chang BD, Broude EV, Dokmanovic M, et al. A senescence-like phenotype distinguishes tumor cells that undergo terminal proliferation arrest after exposure to anticancer agents. Cancer Res. 1999;59(15):3761–3767. [PubMed] [Google Scholar]
- 44.Gotze S, Wolter M, Reifenberger G, Muller O, Sievers S. Frequent promoter hypermethylation of Wnt pathway inhibitor genes in malignant astrocytic gliomas. Int J Cancer. 2010;126(11):2584–2593. doi: 10.1002/ijc.24981. [DOI] [PubMed] [Google Scholar]
- 45.Kawakami K, Hirata H, Yamamura S, et al. Functional significance of Wnt inhibitory factor-1 gene in kidney cancer. Cancer Res. 2009;69(22):8603–8610. doi: 10.1158/0008-5472.CAN-09-2534. doi:10.1158/0008-5472.CAN-09-2534. [DOI] [PubMed] [Google Scholar]
- 46.Yee DS, Tang Y, Li X, et al. The Wnt inhibitory factor 1 restoration in prostate cancer cells was associated with reduced tumor growth, decreased capacity of cell migration and invasion and a reversal of epithelial to mesenchymal transition. Mol Cancer. 2010;9(1):162. doi: 10.1186/1476-4598-9-162. doi:10.1186/1476-4598-9-162. [DOI] [PMC free article] [PubMed] [Google Scholar]
- 47.Rubin EM, Guo Y, Tu K, Xie J, Zi X, Hoang BH. Wnt inhibitory factor 1 decreases tumorigenesis and metastasis in osteosarcoma. Mol Cancer Ther. 2010;9(3):731–741. doi: 10.1158/1535-7163.MCT-09-0147. doi:10.1158/1535-7163.MCT-09-0147. [DOI] [PMC free article] [PubMed] [Google Scholar]
- 48.van de Wetering M, Sancho E, Verweij C, et al. The beta-catenin/TCF-4 complex imposes a crypt progenitor phenotype on colorectal cancer cells. Cell. 2002;111(2):241–250. doi: 10.1016/s0092-8674(02)01014-0. doi:10.1016/S0092-8674(02)01014-0. [DOI] [PubMed] [Google Scholar]
- 49.Reya T, Clevers H. Wnt signalling in stem cells and cancer. Nature. 2005;434(7035):843–850. doi: 10.1038/nature03319. doi:10.1038/nature03319. [DOI] [PubMed] [Google Scholar]
- 50.Boerboom D, White LD, Dalle S, Courty J, Richards JS. Dominant-stable beta-catenin expression causes cell fate alterations and Wnt signaling antagonist expression in a murine granulosa cell tumor model. Cancer Res. 2006;66(4):1964–1973. doi: 10.1158/0008-5472.CAN-05-3493. doi:10.1158/0008-5472.CAN-05-3493. [DOI] [PubMed] [Google Scholar]
- 51.Ye X, Zerlanko B, Kennedy A, Banumathy G, Zhang R, Adams PD. Downregulation of Wnt signaling is a trigger for formation of facultative heterochromatin and onset of cell senescence in primary human cells. Mol Cell. 2007;27(2):183–196. doi: 10.1016/j.molcel.2007.05.034. doi:10.1016/j.molcel.2007.05.034. [DOI] [PMC free article] [PubMed] [Google Scholar]
- 52.Ali A, Hoeflich KP, Woodgett JR. Glycogen synthase kinase-3: properties, functions, and regulation. Chem Rev. 2001;101(8):2527–2540. doi: 10.1021/cr000110o. doi:10.1021/cr000110o. [DOI] [PubMed] [Google Scholar]
- 53.Benouaich-Amiel A, Mazza E, Massard C, et al. Phase I study of the oral CDK-TRKA inhibitor PHA-848125 in recurrent malignant glioma (MG) J Clin Oncol (Meeting Abstracts) 2010;28(15 suppl):2087. [Google Scholar]
- 54.Chen B, Dodge ME, Tang W, et al. Small molecule-mediated disruption of Wnt-dependent signaling in tissue regeneration and cancer. Nat Chem Biol. 2009;5(2):100–107. doi: 10.1038/nchembio.137. doi:10.1038/nchembio.137. [DOI] [PMC free article] [PubMed] [Google Scholar]
- 55.Lu J, Ma Z, Hsieh JC, et al. Structure-activity relationship studies of small-molecule inhibitors of Wnt response. Bioorg Med Chem Lett. 2009;19(14):3825–3827. doi: 10.1016/j.bmcl.2009.04.040. [DOI] [PMC free article] [PubMed] [Google Scholar]
- 56.Liebner S, Plate KH. Differentiation of the brain vasculature: the answer came blowing by the Wnt. J Angiogenes Res. 2010;2(1):1. doi: 10.1186/2040-2384-2-1. doi:10.1186/2040-2384-2-1. [DOI] [PMC free article] [PubMed] [Google Scholar]
- 57.Tsafrir D, Tsafrir I, Ein-Dor L, Zuk O, Notterman DA, Domany E. Sorting points into neighborhoods (SPIN): data analysis and visualization by ordering distance matrices. Bioinformatics. 2005;21(10):2301–2308. doi: 10.1093/bioinformatics/bti329. Epub 2005 Feb 2318 doi:10.1093/bioinformatics/bti329. [DOI] [PubMed] [Google Scholar]
Associated Data
This section collects any data citations, data availability statements, or supplementary materials included in this article.