

Abstract
Purpose
To develop a flow-sensitive dephasing (FSD) preparative scheme to facilitate multi-directional flow signal suppression in three-dimensional balanced steady-state free precession (SSFP) imaging and to validate the feasibility of the refined sequence for noncontrast MR angiography (NC-MRA) of the hand.
Materials and Methods
A new FSD preparative scheme was developed that combines two conventional FSD modules. Studies using a flow phantom (gadolinium doped water 15 cm/sec) and the hands of 11 healthy volunteers (6 males and 5 females) were performed to compare the proposed FSD scheme with its conventional counterpart with respect to the signal suppression of multi-directional flow. In 9 of the 11 healthy subjects and 2 patients with suspected vasculitis and documented Raynaud’s phenomenon, respectively, balanced SSFP imaging coupled with the new FSD scheme was compared with spatial-resolution-matched (0.94 × 0.94 × 0.94 mm3) contrast-enhanced (CE) MRA (0.15 mmol/kg gadopentetate dimeglumine) in terms of overall image quality, venous contamination, motion degradation, and arterial conspicuity.
Results
The proposed FSD scheme was able to suppress two-dimensional flow signal in the flow phantom and hands and yielded significantly higher arterial conspicuity scores than the conventional scheme did on NC-MRA at the regions of common digitals and proper digitals. Compared with CE-MRA, the refined NC-MRA technique yielded comparable overall image quality and motion degradation, significantly less venous contamination, and significantly higher arterial conspicuity score at digital arteries.
Conclusion
The FSD-based NC-MRA technique is improved in the depiction of multi-directional flow by applying a two-module FSD preparation, which enhances its potential to serve as an alternative MR angiography technique for the assessment of hand vascular abnormalities.
Keywords: MR angiography, noncontrast MRA, hand MRA, systemic sclerosis, flow-sensitive
Introduction
Vascular abnormalities of the hand, including trauma, thromboembolic disease, vasculitis, vascular malformations, and Raynaud’s phenomenon/disease, can cause markedly diminished functional capacity and quality of life (1). The gold standard of diagnostic imaging in clinical practice remains digital subtraction angiography that, however, poses a variety of risks to patients (2–4). Increasingly, contrast-enhanced (CE) MR angiography (MRA) is being used as an alternative non-invasive, radiation-free imaging modality (1, 5). Despite continuing advances in CE-MRA techniques, its diagnostic performance may be compromised in hand imaging, whereby small vessel caliber and short arteriovenous transit times present competing demands of high spatial resolution and short imaging times (5–10). More importantly, recent safety concerns with the use of gadolinium-based MR contrast agents in patients with renal insufficiency have triggered renewed interests in noncontrast MRA (NC-MRA) techniques (11–13).
Conventional NC-MRA techniques, time-of-flight (TOF) (14) and phase-contrast (PC) (15), were previously employed for hand MRA, but long imaging times and susceptibility to higher-order flow effects have precluded their clinical acceptance (1, 16, 17).
Diagnostic quality hand MRA has been reported recently with an electrocardiographically (ECG) triggered three-dimensional (3D) variable-flip-angle fast spin-echo (FSE) sequence (18). As a fresh blood imaging (FBI) technique (19), it exploits arterial flow pulsatility to generate a dark-blood artery image set during the systolic cardiac phase and a bright-blood artery image set during the diastolic phase (20). Both image sets are subtracted to highlight arteries while suppressing signals from other tissues.
ECG-triggered flow-sensitive dephasing (FSD) prepared 3D segmented balanced steady-state free precession (SSFP) is another newly developed technique for NC-MRA (21, 22). This method shares several features with the above FBI technique, including suppression of fast-flow signal based on intra-voxel spin-phase dispersion, systolic and diastolic acquisitions, and image subtraction. Nevertheless, a unique feature is that arterial blood contrast is achieved prior to rather than during signal readouts, through FSD magnetization preparation (21, 23–26). This permits flexible configuration of flow sensitization with respect to its direction, which is highly valuable for MRA of the hand that involves multi-directional arterial flow. However, the previously used FSD preparative module is unidirectional flow sensitive (22). Suboptimal signal suppression of flow in certain directions may result in an overestimation of the severity of vascular pathologies.
The primary purpose of our study was to develop a multi-directional flow signal suppression FSD preparative scheme and to evaluate its effectiveness. In addition, it was aimed to validate the feasibility of the refined FSD-prepared balanced SSFP sequence for hand MRA, with high-spatial-resolution CE-MRA as a non-invasive reference standard.
Materials and Methods
This prospective study was Health Insurance Portability and Accountability Act compliant and was approved by our institutional review board. Informed consent was obtained from all subjects.
Theory and MR Sequence Design
The FSD-based NC-MRA technique requires two consecutive signal measurements (21). The measurement during the cardiac diastole using a zero-gradient-strength FSD preparation (i.e. T2 preparation) is generally reliable to provide bright arterial blood signal because of flow-insensitivity and high blood contrast inherent with a balanced SSFP acquisition (27). The performance of the NC-MRA technique thus relies on the systolic measurement in which fast-flowing arterial blood spins need to be sufficiently dephased within a voxel by applied balanced flow-sensitizing gradients (referred to as FSD gradients hereafter) during the FSD preparation.
Spin dephasing requires that flowing spins have the flow components along the direction of applied FSD gradients. Previous hand MRA studies employed a conventional FSD preparative module whereby FSD gradients were applied along the readout (RO) and phase-encoding (PE) directions simultaneously (Fig. 1a) (22). However, such gradient pulse configuration essentially renders the flow-sensitization unidirectional, as derived from the vector sum of all FSD gradients (dashed arrow in Fig. 1a). If blood flow is perpendicular to this direction, there will be no suppression of blood signal. This can be appreciated by analyzing a flowing spin’s phase, φ, based on the following equation (28):
| [1] |
where γ is the gyromagnetic ratio, v⃗ is the velocity of a flowing spin, m⃗1 is the vector sum of the first-order gradient moments introduced by individual FSD gradient pairs (Fig. 1a). With the above orthogonal condition satisfied, intra-voxel blood spins with the velocities of various magnitudes but identical direction will not be dephased from each other, thereby resulting in null phase dispersion and consequently unsuppressed signal. Thus, the conventional FSD module may result in a suboptimal vessel segment depiction on MR angiograms.
Figure 1.
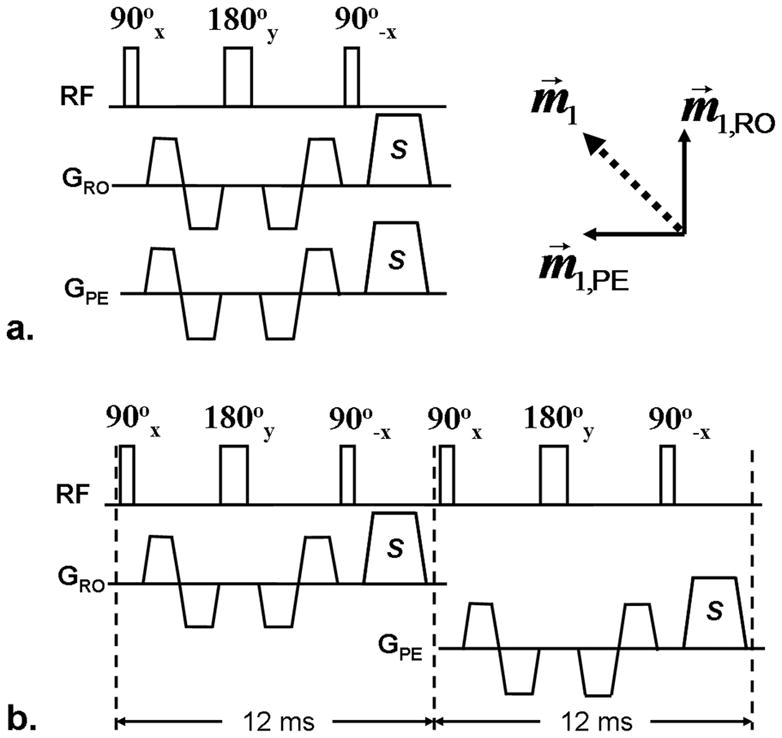
Diagrams of the single-module (a) and two-module FSD schemes (b). FSD gradient pairs are applied along the readout (RO) and phase-encoding (PE) directions simultaneously in the single-module scheme, resulting in a single-direction flow sensitization (measured by first-order gradient moment m⃗1) that coincides with the direction of the vector sum (dashed arrow) of respective flow sensitization (m⃗1,RO and m⃗1,PE) provided by applied FSD gradients. S: spoiler gradients to eliminate remnant transverse magnetization.
To achieve signal suppression of multi-directional blood flow, we propose that two (or three for three-dimensional flow) conventional FSD preparative modules are connected in series, with balanced FSD gradients applied along the RO direction in the first module and along the PE direction in the second one (Fig. 1b). The spoiler gradients applied at the end of the preceding FSD module ensure that dephased flow spin components will not be rephased in the subsequent one. Thus, flow components along individual directions can be suppressed independently by their corresponding modules.
Subjects
Eleven healthy volunteers (6 males and 5 females; age range, 24–57 years; mean age, 34 years) with no history of hand vascular disease and two patients referred with suspected vasculitis (female; age, 61 years) and documented Raynaud’s phenomenon secondary to systemic sclerosis (SSc) (female; age, 54 years), respectively, participated in this study. All subjects with an estimated glomerular filtration rate (eGFR) of above 60 mL/min/1.73 m2 were eligible for CE-MRA.
Flow Phantom Study
The flow phantom experiment was performed on a 1.5 Tesla MR system (Magnetom Espree; Siemens AG Healthcare, Erlangen, Germany) using a 6-channel phased-array body matrix coil and spine coil. Gadolinium-doped water (0.25mM) was pumped, at a flow rate of 15 cm/sec, through a cylindrical silicone tube (internal diameter = 4.8 mm). Two segments (after sufficiently long transition to avoid interference of flow) of the tube were immersed, perpendicular to each other (Fig. 2a), in a tap-water bath and imaged at the iso-center of the bore.
Figure 2.

Schematics of the flow phantom (a) and full-volume maximum intensity projection MRA images obtained using FSD1 (b) and FSD2 (c) methods, respectively. The phantom consists of two perpendicular silicone tube segments in which gadolinium-doped water flow in the directions denoted by arrows. The two segments are placed at 45° and −45° with respect to the readout direction. The FSD1 scheme is only capable of depicting the flow coinciding with the direction of vector sum of the readout and phase-encoding directions. However, the FSD2 scheme is sensitive to both flows. RO: readout. PE: phase-encoding. SL: slice.
The balanced SSFP sequences with conventional one-module FSD preparation (FSD1) (Fig. 1a) and two-module FSD preparation (FSD2) (Fig. 1b), respectively, were successively performed for 3D coronal MRA imaging. To demonstrate the benefit of the FSD2 sequence, the two target tube segments were placed at 45° and −45°, respectively, with respect to the RO direction. In the dark-flow measurement, the first-order gradient moment (m1) applied in either the RO or PE direction of each FSD module was 240 mT·ms2/m. A simulated ECG signal was used with an R-R interval of 1000 ms and a trigger delay time of 200 ms. Relevant imaging parameters included: repetition time (TR)/echo time (TE) = 3.9/1.7 ms, flip angle (FA) = 90°, spatial resolution = 0.94×0.94×0.94 mm3, acquisition time = 1.9 min per scan (including dark-artery and bright-artery measurements).
Volunteer Study
All volunteer experiments were performed on the same MR system. Subjects were placed in the prone position with their upper extremities in pronation above the head for bilateral hand imaging (18). The fingers were spread slightly and taped to reduce motion artifacts. Two 6-channel phased-array body matrix coils were placed on both sides of the hands to achieve optimal coverage. A three-lead wireless vector cardiogram was set up.
After a tri-plane localizer scan, each subject underwent a two-dimensional gradient-echo phase-contrast flow scan (encoding velocity = 50 cm/sec) at the level of wrist. Systolic (peak systolic flow) and diastolic trigger times were derived based on a velocity versus time curve (Mean Curve; Leonardo; Siemens).
Subsequently, two NC-MRA scans, using FSD1 and FSD2 sequences respectively, were performed in a randomized order. The optimal m1 to be applied in the RO direction was identified at the digital fingers using the previously described method (29). For simplicity, we used the same m1-value in the PE direction whenever needed to be applied. The used m1-value ranged from 40 to 120 mT·ms2/m. An oblique coronal acquisition with a left-to-right PE direction was employed. Relevant imaging parameters included: TR/TE = 3.9/1.7 ms, FA = 90°, FOV = 316×316 mm2, matrix = 336×336, 56–60 0.94-mm-thick slices, spectral-selective fat saturation, receiver bandwidth = 710 Hz/pixel, centric view-ordering in the PE direction and linear view-ordering in the partition-encoding (parE) direction, 60 lines/shot and 3 shots/partition, generalized autocalibrating partially parallel acquisition (GRAPPA) acceleration factor = 2 in the PE direction, acquisition time = 3–6 min per scan (including dark-artery and bright-artery measurements). The scan was repeated if data were corrupted by severe misregistration artifacts.
Following NC-MRA scans, high-spatial-resolution CE-MRA was performed with a 3D gradient-echo fast low-angle shot (FLASH) acquisition after the administration of 0.15 mmol gadopentetate dimeglumine (Magnevist; Bayer HealthCare Pharmaceuticals Inc., Wayne, NJ) per kilogram of body weight followed by 20 mL saline flush (both at 2 mL/sec) using an automated injector (Spectris; Medrad, Inc., Indianola, PA). The imaging slab used in NC-MRA imaging was copied. The contrast agent transit time was determined through a time-resolved angiography with interleaved stochastic trajectories (TWIST) acquisition (contrast dose: 0.05 mmol/kg body weight; injection rate: 2 mL/sec; 24 frames at 3 sec/frame). Relevant imaging parameters for high-spatial-resolution CE-MRA were: TR/TE = 3.3/1.2 ms, FA = 25°, FOV = 315×360 mm2, matrix = 336×384, 56 0.94-mm-thick slices (spatial resolution matched with NC-MRA scans), time-to-center = 7.8 sec, PE partial Fourier factor = 6/8, parE partial Fourier factor = 6/8, bandwidth = 565 Hz/pixel, GRAPPA acceleration factor = 2 in the PE direction, time of each measurement = 22 sec, one pre-injection measurement followed by two consecutive post-injection measurements.
Patient study
The patient study was performed on a 1.5 Tesla MR system (Magnetom Avanto; Siemens AG Healthcare, Erlangen, Germany). The above volunteer imaging protocol was employed (with minor hardware-related adaption of imaging parameters) except that only FSD2 NC-MRA and CE-MRA scans were performed to reduce examination times. The used m1-value in the RO or PE direction was 110 mT·ms2/m.
Image Analysis
Image analysis was performed by two blinded radiologists (XXX and XXX) in consensus on a workstation (Leonardo; Siemens). Multiplanar reconstruction (MPR) and maximum intensity projection (MIP) techniques were used for post-processing and evaluation of subtracted 3D MRA image sets.
Images acquired from two NC-MRA scans of volunteers were reviewed in a random order. Fifteen segments per hand were respectively evaluated for arterial segment conspicuity: superficial palmar arch, deep palmar arch, three common digital (index/middle, middle/ring, ring/little), princeps pollicis, proximal radialis indicis, proper digital arteries in the index (two: medial side or distal radialis indicis and lateral side), middle (two: medial side and lateral side), ring (two: medial side and lateral side), and little fingers (two: medial side and lateral side). A four-point scale was used herein (18): 0, nondiagnostic or absent; 1, poor, impairing diagnosis; 2, suboptimal without diagnostic impairment; 3, good arterial signal intensity. In addition, venous contamination was assessed on a per-subject basis using a three-point scale (0, absent; 1, present, not affecting image interpretation; 2, present, affecting image interpretation) (18).
Images acquired using FSD2 NC-MRA and CE-MRA methods in volunteer studies were scored in a random order. The criteria from Lim et al. (18) were employed herein. Overall image quality was assessed using a four-point scale (0, nondiagnostic; 1, poor; 2, satisfactory; 3, excellent). Venous contamination was assessed on a three-point scale as described above. Motion degradation was assessed for palm and digits, separately (0, absent; 1, present, not affecting image interpretation; 2, present, affecting image interpretation; 3, severe, rendering images nondiagnostic). All above three assessments were made on a per-subject basis. Furthermore, on each hand, arterial segment conspicuity was assessed using the method described above, and whether a digital finger could be visualized to the terminal third (at least supplied by one proper digital artery) was recorded.
Statistical Analysis
The 15 arterial segments were grouped into four regions: I, palmar arches; II, princeps pollicis and proximal radialis indicis; III, common digitals; IV, proper digitals. When comparing FSD1 to FSD2, a particular attention was also directed to a subgroup of segments that are located at approximately 90° (referred to as “Special Angle”) with respect to the vector sum of the RO and PE directions. For simplicity, five segments that were generally observable (conspicuity score > 0) were included in the “Special Angle” subgroup on the right hand (common digit of index/middle, princeps pollicus, proximal radialis indicis, proper index medial, and proper index lateral) and left hand (deep palmar arch, common digit ring/little, proper ring medial, proper ring lateral, proper little medial), respectively.
All ordinal scale scores were presented as means±standard deviations. Wilcoxon signed rank tests were used for the following statistical comparisons: a) the difference in arterial segment conspicuity between FSD1 and FSD2 NC-MRA for all segments combined, four regions, and “Special Angle” subgroups, respectively; b) the difference in venous contamination between FSD1 and FSD2 NC-MRA; c) the difference in arterial segment conspicuity between FSD2 NC-MRA and CE-MRA for all segments combined and four regions; d) the difference in overall image quality, venous contamination, and motion degradation, respectively, between FSD2 NC-MRA and CE-MRA. For comparisons a) and c), the right and left hands were analyzed separately due to the directional variance of blood flows. A p value of less than 0.05 was considered to indicate a statistically significant difference. Commercially available software (SPSS Inc., Chicago, IL) was used for all analyses.
Results
Flow Phantom Study
Flow phantom images acquired using FSD1 and FSD2 sequences, respectively, are shown in Fig. 2. The FSD1 sequence was only able to depict the flow coinciding with the vector sum of all FSD gradients (Fig. 2b). On closer examination of the dark-flow data set, flow signal in the other tube segment was not suppressed at all. In contrast, the two tube segments were equally depicted when using the FSD2 sequence (Fig. 2c).
Volunteer Study
NC-MRA using FSD1 and FSD2 sequences was obtained in all 11 volunteers, although three of them had a second NC-MRA scan for FSD1 (1 subject) imaging or FSD2 imaging (2 subjects) due to appreciable motion-related image artifacts. No arrhythmias-related ECG-gating problems were observed.
Fig. 3 shows two examples whereby certain signal loss on MIP MRA was observed at several arterial segments when using the FSD1 method. Notice that these segments are generally located at the “Special Angle” with respect to the vector sum of the RO and PE directions. Such signal defects mimicking vessel narrowing were markedly ameliorated by the FSD2 method.
Figure 3.
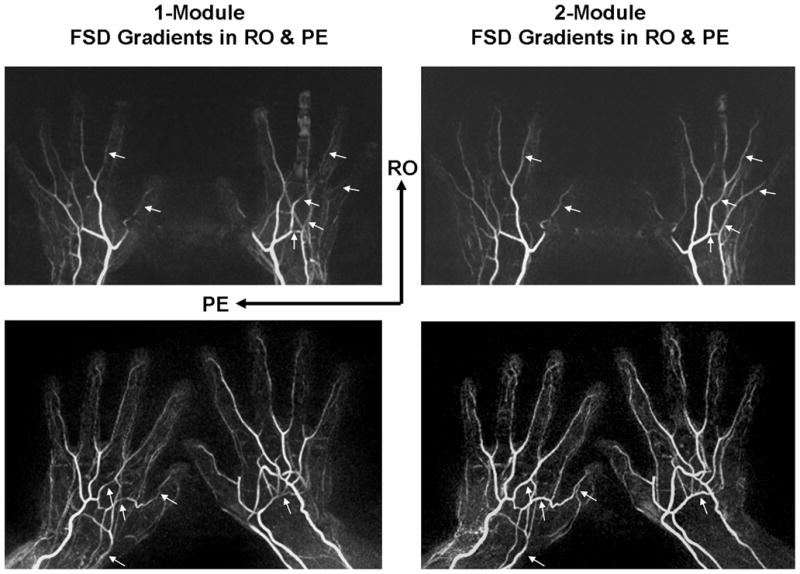
Comparison of MRA obtained using FSD1 and FSD2 methods, respectively, in two healthy volunteers (top row and bottom row). Signal defects are observed at several arterial segments (arrows) on FSD1-based NC-MRA, which are dramatically improved on FSD2-based NC-MRA. Notice that these segments were generally located at approximately 90° with respect to the vector sum of the readout (RO) and phase-encoding (PE) directions. Shown herein are full-volume maximum intensity projections.
A complete superficial palmar arch was visualized only in two hands and therefore this segment was typically scored 0 for conspicuity. This was deemed normal variant anatomy by our radiologists according to CE-MRA. To obtain a valid performance evaluation for both NC-MRA and CE-MRA techniques, this segment was excluded from the computation of mean arterial segment conspicuity score and statistical tests. Evaluation of arterial segment conspicuity for FSD1 versus FSD2 is summarized in Table 1. On both right and left hands, the FSD2 technique demonstrated significantly higher conspicuity scores in all 14 segments combined, in the regions of common digitals and proper digitals, and in the “Special Angle” subgroup. Higher mean conspicuity scores were also obtained in the two other regions with FSD2, although statistical significance was not achieved. Moreover, FSD2 was shown not to entail more appreciable venous contamination while bringing above benefits (FSD1 0.5±0.6 vs. FSD2 0.5±0.7, p = 1.00).
Table 1.
Comparison of vessel segment conspicuity assessed on healthy volunteer MR angiograms obtained with FSD1- and FSD2-based NC-MRA methods (11 subjects).
| Right Hand | Left Hand | |||||
|---|---|---|---|---|---|---|
| FSD1 | FSD2 | p Value | FSD1 | FSD2 | p Value | |
| Palmar Arches | 2.6 ± 0.9 | 2.7 ± 0.9 | 0.32 | 1.8 ± 1.4 | 2.4 ± 1.2 | 0.10 |
| Princeps Pollicis & Proximal Radialis Indicis | 1.8 ± 1.2 | 2.1 ± 1.2 | 0.08 | 1.9 ± 1.2 | 2.1 ± 1.3 | 0.16 |
| Common Digitals | 2.8 ± 0.4 | 3.0 ± 0.0 | 0.02 | 2.6 ± 0.7 | 3.0 ± 0.2 | 0.01 |
| Proper Digitals | 2.0 ± 1.1 | 2.2 ± 1.1 | 0.01 | 1.7 ± 1.2 | 2.0 ± 1.2 | < 0.001 |
| “Special Angle” Subgroup | 2.0 ± 1.1 | 2.4 ± 1.1 | 0.001 | 1.8 ± 1.2 | 2.3 ± 1.0 | < 0.001 |
| All Segments | 2.2 ± 1.1 | 2.4 ± 1.0 | < 0.001 | 1.9 ± 1.2 | 2.2 ± 1.1 | < 0.001 |
Note: Data are presented as mean ± standard deviation. A p value of less than 0.05 was considered to indicate a statistically significant difference. “Special Angle” subgroup on the right hand included common digit of index/middle, princeps pollicus, proximal radialis indicis, proper index medial, and proper index lateral; “Special Angle” subgroup on the left hand included deep palmar arch, common digit ring/little, proper ring medial, proper ring lateral, proper little medial.
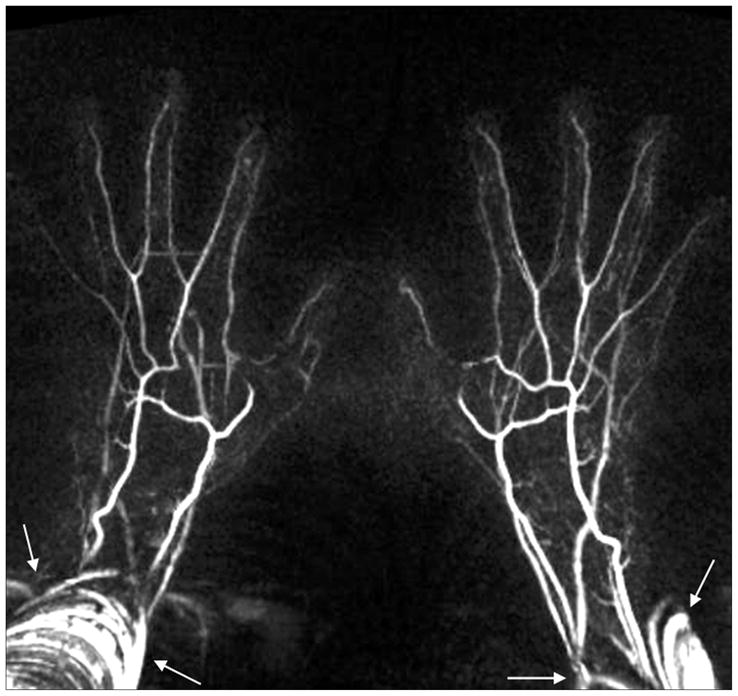
Nine out of 11 volunteers had both FSD2 and CE-MRA data sets (In the two other volunteers, one with eGFR < 60 mL/min/1.73 m2, and the other was discontinued due to discomfort). Qualitative scores and comparison are summarized in Table 2. Overall image quality was similar between two techniques. Banding artifacts associated with balanced SSFP acquisitions were observed in 5 of 9 cases, as shown in Fig. 4, but they were located at the periphery of the FOV with essentially no adverse effects on the visualization of the hand. Significant lower venous contamination scores were obtained using FSD2. Venous overlay was often observed at digital finger tips on CE-MRA (Fig. 5). The MRA obtained using FSD2 also exhibited venous signals at the palm in some cases, but those generally did not interfere with the visualization of arterial segments owing to high spatial resolution (Fig. 5a and 6a), especially upon sub-volume MIP (Fig. 6b). No motion degradation was observed at palm and digits on CE-MRA, but mild motion degradation (score = 1) and moderate motion degradation (score = 2) were observed at digits on FSD2 MRA in one and two volunteers, respectively, mostly likely due to involuntary movement during scanning.
Table 2.
Comparison of qualitative assessments performed on healthy volunteer MR angiograms obtained with FSD2-based NC-MRA and CE-MRA methods (9 subjects).
| Overall Image Quality | Venous Contamination | Motion Degradation (Palmar) | Motion Degradation (Digital) | |
|---|---|---|---|---|
| FSD2 | 2.6 ± 0.5 | 0.6± 0.7 | 0.0 ± 0.0 | 0.6 ± 0.9 |
| CE-MRA | 1.9 ± 0.9 | 1.2 ± 0.7 | 0.0 ± 0.0 | 0.0 ± 0.0 |
| p Value | 0.13 | 0.01 | 1.00 | 0.10 |
Note: Data are presented as mean ± standard deviation. A p value of less than 0.05 was considered to indicate a statistically significant difference.
Figure 4.
Example FSD-based NC-MRA showing banding artifacts as associated with balanced SSFP acquisitions. Note that artifacts are located at the periphery of the field of view with essentially no adverse effects on the visualization of the hand.
Figure 5.
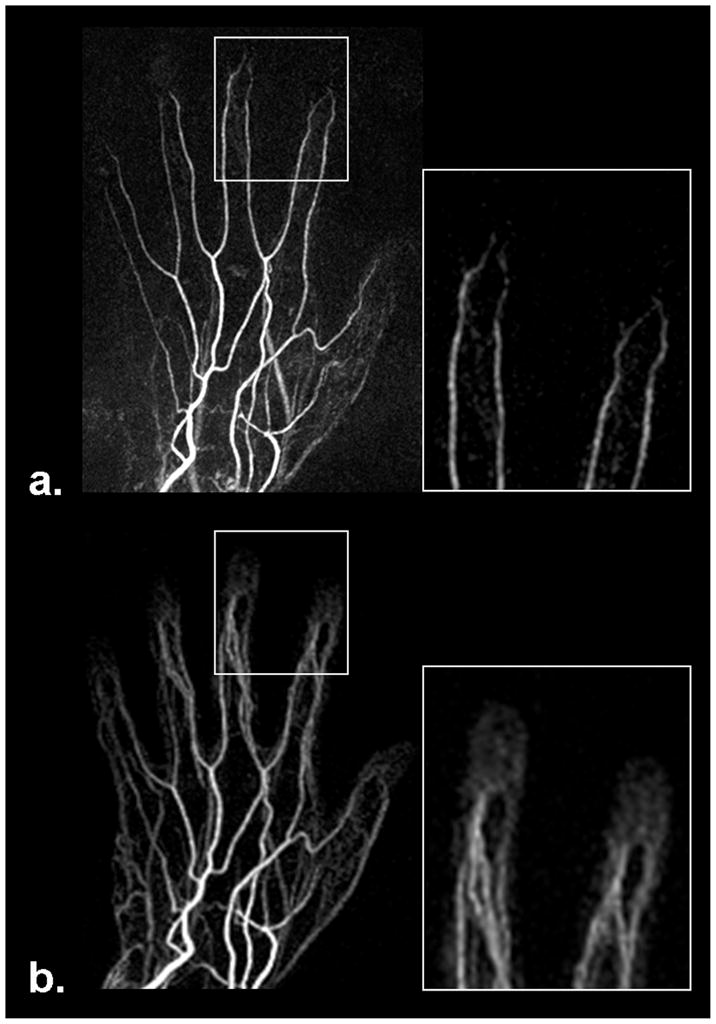
Comparison of MRA obtained using FSD-based NC-MRA (a) and CE-MRA (b) techniques, respectively. FSD MRA offers superior depiction of terminal 3rd region, whereas soft-tissue contrast enhancement often interferes with the visualization of the region when using CE-MRA due to the short arteriovenous contrast transit time. Shown herein are full-volume maximum intensity projections.
Figure 6.
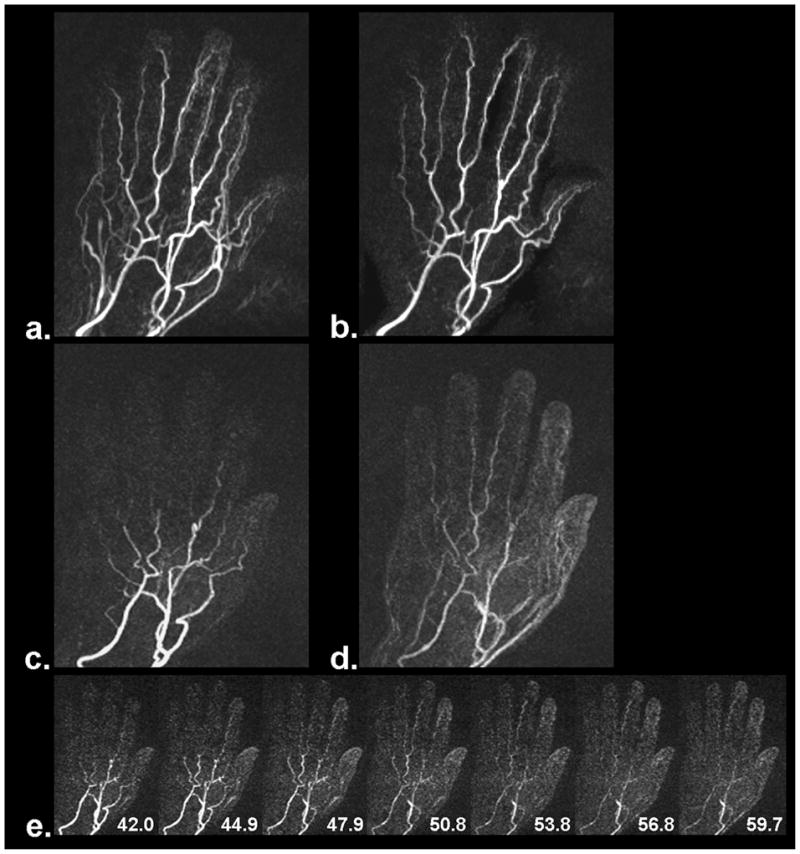
MRA results from a volunteer with slow contrast filling in the hand. The entire arterial system is well depicted by the FSD-based NC-MRA method (a), especially after venous overlay was manually removed through selective maximum intensity projection (b). However, the depiction became inferior when using CE-MRA (two frames, c and d). Slow contrast filling in the hand is indicated by a series of time-resolved contrast images (e). The numbers shown on the time-resolved contrast images are time stamps in units of second.
Evaluation of arterial segment conspicuity for FSD2 MRA versus CE-MRA is summarized in Table 3. FSD2 MRA was generally comparable to CE-MRA in terms of the mean scores in all palmar regions. In contrast, the issue of venous overlay with contrast agents in the region of proper digitals was resolved by using FSD2, thereby yielding significantly improved segment conspicuity (2.3±1.1 vs. 1.5±1.1, p < 0.001). Defining that a vessel conspicuity score of 1–3 means visible, 219 (81.1%) out of 270 segments were visualized using FSD2 and 215 (79.6%) segments visualized using CE-MRA, with 204 in common. Terminal third region was visualized in 48 (66.7%) out of 72 digital fingers using FSD2, in sharp contrast to 8 (11.1%) using CE-MRA due to either rapid opacification of soft tissue (Fig. 5b) or incomplete arterial enhancement (Fig. 6c and 6d).
Table 3.
Comparison of vessel segment conspicuity assessed on healthy volunteer MR angiograms obtained with FSD2-based NC-MRA and CE-MRA methods (9 subjects).
| Right Hand | Left Hand | |||||
|---|---|---|---|---|---|---|
| FSD2 | CE-MRA | p Value | FSD2 | CE-MRA | p Value | |
| Palmar Arches | 2.7 ± 1.0 | 2.7 ± 1.0 | 1.00 | 2.3 ± 1.3 | 2.7 ± 1.0 | 0.32 |
| Princeps Pollicis & Proximal Radialis Indicis | 2.2 ± 1.2 | 2.3 ± 1.2 | 0.26 | 2.2 ± 1.3 | 2.3 ± 0.9 | 0.48 |
| Common Digitals | 3.0 ± 0.0 | 3.0 ± 0.0 | 1.00 | 3.0 ± 0.2 | 3.0 ± 0.0 | 0.32 |
| Proper Digitals | 2.3 ± 1.1 | 1.5 ± 1.1 | < 0.001 | 2.0 ± 1.1 | 1.5 ± 1.0 | < 0.001 |
| All Segments | 2.5 ± 1.0 | 2.0 ± 1.1 | < 0.001 | 2.3 ± 1.1 | 2.0 ± 1.0 | 0.002 |
Note: Data are presented as mean ± standard deviation. Superficial palmar arch is not included because it is rarely seen in the volunteer group. A p value of less than 0.05 was considered to indicate a statistically significant difference.
Figure 6 demonstrates a case whereby the entire arterial system was well depicted by the FSD2 MRA method (Fig. 6a and 6b). However, it became difficult when using CE-MRA (two frames, Fig. 6c and 6d) due to slow contrast filling, as verified by time-resolved contrast-enhanced MIP image series (Fig. 6e).
Patient Study
In the first patient study, FSD2 and CE-MRA yielded comparable diagnostic quality. Normal bilateral hand arterial anatomy was demonstrated with no evidence of thrombus or vasculopathy, while FSD2 offered superior depiction of digital arteries (arrows) (Fig. 7). In the second patient study, the MRA using FSD2 exhibited better image quality and sharper vessel delineation than CE-MRA (Fig. 8). Severe vasculopathy was observed with both techniques, but FSD2 was able to depict more patent segments.
Figure 7.
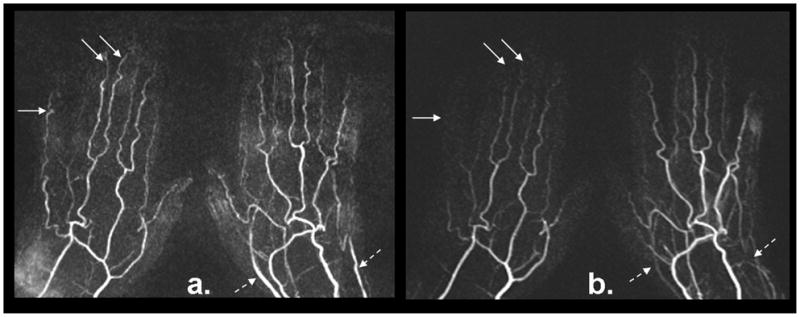
FSD-based NC-MRA (a) and CE-MRA (b) from a 61-year-old female patient with suspected vasculitis. Both techniques yield comparable image quality. Normal bilateral hand arterial anatomy with no evidence of thrombus or vasculopathy is observed. The angiogram using the FSD technique demonstrated superior depiction of digital arteries (solid arrows), although venous contamination is more evident at the wrist and palm not affecting the visualization of the arteries (dashed arrows).
Figure 8.
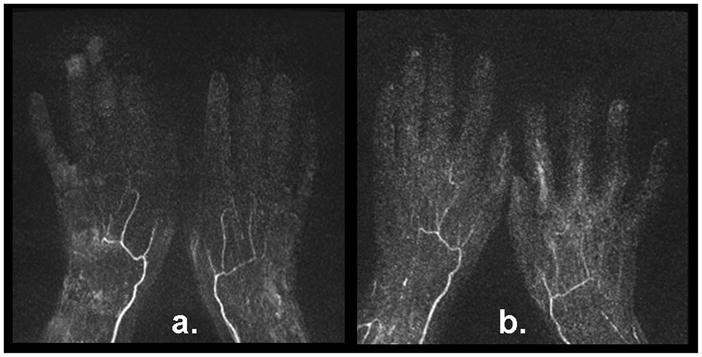
FSD-based NC-MRA (a) and CE-MRA (b) from a 54-year-old female patient with documented secondary Raynaud’s phenomenon. Severe vasculopathy was observed with both techniques The MR angiogram using the FSD technique demonstrated more patent vessel segments and sharper delineation.
Discussion
FSD preparation has previously been employed as a black-blood technique for vessel wall or plaque imaging (23, 25, 26, 30, 31). The same mechanism was recently utilized in NC-MRA (21). This method eliminates a complete exchange of blood in the entire imaging volume by virtue of its nonselective preparative nature. Thus, it is well suited for imaging arteries with relatively slow flow, such as digital arteries, and is also compatible with a 3D in-plane data acquisition that allows for more time-efficient hand MRA, as opposed to TOF and PC MRA.
FSD gradients are usually applied in all three logic axes simultaneously in order to impart flow sensitization to all dimensions (23, 25, 26, 30, 31). This does not always hold true for a coherent flow that are perpendicular to the vector sum of all applied FSD gradients. One may propose to apply the individual FSD gradients along three logic axes in a temporally separated fashion, as proposed for isotropic diffusion imaging by Wong et al. (32). However, this approach will not be effective if all FSD gradients are still applied within a single RF pulse module (90°x-180°y-90°−x) because flowing spins can be dephased by the gradient pair applied along one logic axis and then be rephased to some extent by the gradient pair applied along another logic axis. This cumulative effect on spin phase can be eliminated by using our proposed FSD scheme that has spoiler gradients between adjacent modules to serve as an “isolator”.
The flaw of the conventional FSD module (FSD1) and the benefit of the new module (FSD2) were clearly demonstrated on the flow phantom. Two major modifications are incorporated into FSD2: a) the change in the direction of m1 applied in the first module and b) the addition of the second module. In fact, the latter one is the more essential contributor to the improved flow conspicuity shown in the phantom study. For the particular phantom set-up shown in Fig. 2a, flow depiction could be enhanced by using the first module of FSD2 only. This is because both of the tube segments contain the flow component coinciding with the RO direction and, if m1 is sufficiently large, the signal of intra-tube flow would be reliably suppressed in the dark-artery measurement. However, if a third tube segment is present perpendicular to the RO direction, this single module may not be able to suppress the flow signal in it, as explained in the Theory section and indicated by the results shown in Fig. 2b. In this case, a second module with the m1 applied in the PE direction will play a crucial role. Hence, the two-module scheme is indispensable to the reliability of FSD-based NC-MRA techniques.
In volunteer studies, FSD2 has been shown to provide significantly higher vessel conspicuity scores than FSD1 in the regions of common digitals and proper digitals as well as the “Special Angle” subgroup. However, this improvement was not traded for by more appreciable venous contamination, which would otherwise occur if using FSD1 with a higher m1 value. Our results also suggest that FSD1 should be used in black-blood vessel wall imaging with cautions in the presence of multi-directional flow.
It is noteworthy that reduced flow signals may result when using FSD2, as demonstrated in our phantom study. A major reason is the flow signal loss in the bright-blood measurement owing to the prolonged T2 decay. Nevertheless, the substantially enhanced arterial segment conspicuity obtained with FSD2 suggests that such a side effect has little influence on the diagnostic value of FSD-based NC-MRA. On the other hand, this signal-drop issue can be mitigated by further shortening the FSD module.
We anticipate that the refined FSD-based MRA technique may be better suited for imaging the tortuous arterial system of the hand, compared to its NC-MRA counterpart, FBI (18). The FBI techniques have flow sensitivity along the RO direction only, and the flow in other directions may not be reliably depicted. However, the present technique may not work as well as FBI at 3.0 Tesla or higher main magnetic field due to off-resonance artifacts associated with the balanced SSFP acquisition. Therefore, a systemic comparison study on the diagnostic performance of the two NC-MRA techniques would be a future research topic. Another potential issue awaiting investigation is the impact of reduced arterial flow pulsatility and/or velocity on NC-MRA image quality. As aforementioned, these two factors serve as the basis to make both FSD- and FBI-based NC-MRA techniques feasible. Severe venous signal contamination may interfere with the visualization of arteries as the arterial flow pulsatility or the velocity difference between arterial and venous flows increasingly diminish, which likelyoccurs in the patient population.
This investigative study demonstrates an advantage of the FSD-based NC-MRA technique over CE-MRA in depicting digital arteries, although comparable overall image quality and arterial conspicuity are observed with both techniques in most vascular segments. Using our imaging protocol, FSD-based NC-MRA provides true isotropic submillimeter-spatial-resolution, whereas CE-MRA achieves the same spatial resolution by means of partial Fourier reconstruction in both PE and parE directions while keeping the scan time short (22 sec). Hence, FSD-based MRA yields sharper vessel delineation. Without constraints in the bolus imaging window, an even higher spatial resolution is achievable with the technique if a longer scan time can be tolerated. This will favor the visualization of small-caliber hand vessels. On the other hand, while CE-MRA is a clinically accepted means for hand MRA, bolus timing is still a challenge arising from the short arteriovenous transit time or extremely slow arterial blood filling. This rendered an inferior depiction of the terminal third region in our study. Consequently, the FSD-based NC-MRA technique is expected to be better suited for the assessment of hand vascular involvement in SSc given that lesions have been primarily observed in the digital arteries (33, 34).
Admittedly, there are three potential issues when using the proposed NC-MRA technique rather than the CE-MRA technique. First, banding artifacts associated with a balanced SSFP acquisition may interfere with arterial segment visualization, thereby necessitating B0-field shimming. Second, motion artifacts associated with long-scan-time 3D subtractive imaging and prone position may be problematic. Care should be taken in positioning subjects. The lateral decubitus position may be employed with only one hand scanned. Third, suboptimal angiogram may result due to magnetic field-distorted ECG signals or arrhythmia-induced unstable heart period in patients. When the above issues occur, however, the data acquisition can be repeated, an option that is not afforded by CE-MRA.
In conclusion, the flaw of a conventional FSD preparative scheme in suppression of multi-directional flow signal is demonstrated, and the FSD-based NC-MRA technique is enhanced in the depiction of multi-directional flow by applying a two-module FSD preparation. Preliminary in-vivo studies have demonstrated that comparable arterial conspicuity can be obtained with the NC-MRA technique, with CE-MRA as a reference. Such a characteristic along with high spatial resolution and superior depiction of digital terminals indicates its potential of serving as an alternative to CE-MRA for the assessment of hand vascular abnormalities. However, this work involves a small number of patients, and large-scale clinical studies are warranted to establish the diagnostic value of this NC-MRA approach.
Acknowledgments
Funding Support: NIH/NHLBI R01 HL096119
The authors thank Xiaoming Bi, Ph.D., and Sven Zuehlsdorff, Ph.D., of Siemens Healthcare for assistance in pulse sequence programming.
References
- 1.Lee VS, Lee HM, Rofsky NM. Magnetic resonance angiography of the hand. Invest Radiol. 1998;33:687–698. doi: 10.1097/00004424-199809000-00025. [DOI] [PubMed] [Google Scholar]
- 2.Loring LA, Hallisey MJ. Arteriography and interventional therapy for diseases of the hand. Radiographics. 1995;15:1299–1310. doi: 10.1148/radiographics.15.6.8577958. [DOI] [PubMed] [Google Scholar]
- 3.Rofsky NM. MR angiography of the hand and wrist. Magn Reson Imaging Clin N Am. 1995;3:345–359. [PubMed] [Google Scholar]
- 4.Vogelzang RL. Arteriography of the hand and wrist. Hand Clin. 1991;7:63–86. [PubMed] [Google Scholar]
- 5.Connell DA, Koulouris G, Thorn DA, Potter HG. Contrast-enhanced MR angiography of the hand. Radiographics. 2002;22:583–599. doi: 10.1148/radiographics.22.3.g02ma16583. [DOI] [PubMed] [Google Scholar]
- 6.Brauck K, Maderwald S, Vogt FM, Zenge M, Barkhausen J, Herborn CU. Time-resolved contrast-enhanced magnetic resonance angiography of the hand with parallel imaging and view sharing: initial experience. Eur Radiol. 2007;17:183–192. doi: 10.1007/s00330-006-0275-5. [DOI] [PubMed] [Google Scholar]
- 7.Gluecker TM, Bongartz G, Ledermann HP, Bilecen D. MR angiography of the hand with subsystolic cuff-compression optimization of injection parameters. AJR Am J Roentgenol. 2006;187:905–910. doi: 10.2214/AJR.05.1007. [DOI] [PubMed] [Google Scholar]
- 8.Goldfarb JW, Hochman MG, Kim DS, Edelman RR. Contrast-enhanced MR angiography and perfusion imaging of the hand. AJR Am J Roentgenol. 2001;177:1177–1182. doi: 10.2214/ajr.177.5.1771177. [DOI] [PubMed] [Google Scholar]
- 9.Krause U, Pabst T, Kenn W, Hahn D. High resolution contrast enhanced MR-angiography of the hand arteries: preliminary experiences. Vasa. 2002;31:179–184. doi: 10.1024/0301-1526.31.3.179. [DOI] [PubMed] [Google Scholar]
- 10.Winterer JT, Scheffler K, Paul G, et al. Optimization of contrast-enhanced MR angiography of the hands with a timing bolus and elliptically reordered 3D pulse sequence. J Comput Assist Tomogr. 2000;24:903–908. doi: 10.1097/00004728-200011000-00017. [DOI] [PubMed] [Google Scholar]
- 11.Grobner T. Gadolinium--a specific trigger for the development of nephrogenic fibrosing dermopathy and nephrogenic systemic fibrosis? Nephrol Dial Transplant. 2006;21:1104–1108. doi: 10.1093/ndt/gfk062. [DOI] [PubMed] [Google Scholar]
- 12.Marckmann P, Skov L, Rossen K, et al. Nephrogenic systemic fibrosis: suspected causative role of gadodiamide used for contrast-enhanced magnetic resonance imaging. J Am Soc Nephrol. 2006;17:2359–2362. doi: 10.1681/ASN.2006060601. [DOI] [PubMed] [Google Scholar]
- 13.Steger-Hartmann T, Hofmeister R, Ernst R, Pietsch H, Sieber MA, Walter J. A review of preclinical safety data for magnevist (gadopentetate dimeglumine) in the context of nephrogenic systemic fibrosis. Invest Radiol. 2010;45:520–528. doi: 10.1097/RLI.0b013e3181e960c9. [DOI] [PubMed] [Google Scholar]
- 14.Laub GA. Time-of-flight method of MR angiography. Magn Reson Imaging Clin N Am. 1995;3:391–398. [PubMed] [Google Scholar]
- 15.Moran PR. A flow velocity zeugmatographic interlace for NMR imaging in humans. Magn Reson Imaging. 1982;1:197–203. doi: 10.1016/0730-725x(82)90170-9. [DOI] [PubMed] [Google Scholar]
- 16.Krause U, Pabst T, Kenn W, Wittenberg G, Hahn D. MR angiography of the hand arteries. Angiology. 2001;52:763–772. doi: 10.1177/000331970105201106. [DOI] [PubMed] [Google Scholar]
- 17.Miyazaki M, Lee VS. Nonenhanced MR angiography. Radiology. 2008;248:20–43. doi: 10.1148/radiol.2481071497. [DOI] [PubMed] [Google Scholar]
- 18.Lim RP, Storey P, Atanasova IP, et al. Three-dimensional electrocardiographically gated variable flip angle FSE imaging for MR angiography of the hands at 3.0 T: initial experience. Radiology. 2009;252:874–881. doi: 10.1148/radiol.2531090290. [DOI] [PMC free article] [PubMed] [Google Scholar]
- 19.Miyazaki M, Takai H, Sugiura S, Wada H, Kuwahara R, Urata J. Peripheral MR angiography: separation of arteries from veins with flow-spoiled gradient pulses in electrocardiography-triggered three-dimensional half-Fourier fast spin-echo imaging. Radiology. 2003;227:890–896. doi: 10.1148/radiol.2273020227. [DOI] [PubMed] [Google Scholar]
- 20.Wedeen VJ, Meuli RA, Edelman RR, et al. Projective imaging of pulsatile flow with magnetic resonance. Science. 1985;230:946–948. doi: 10.1126/science.4059917. [DOI] [PubMed] [Google Scholar]
- 21.Fan Z, Sheehan J, Bi X, Liu X, Carr J, Li D. 3D noncontrast MR angiography of the distal lower extremities using flow-sensitive dephasing (FSD)-prepared balanced SSFP. Magn Reson Med. 2009;62:1523–1532. doi: 10.1002/mrm.22142. [DOI] [PMC free article] [PubMed] [Google Scholar]
- 22.Sheehan JJ, Fan Z, Davarpanah AH, et al. Nonenhanced MR angiography of the hand with flow-sensitive dephasing-prepared balanced SSFP sequence. Radiology. 2011 doi: 10.1148/radiol.10100851. In press. [DOI] [PMC free article] [PubMed] [Google Scholar]
- 23.Koktzoglou I, Li D. Diffusion-prepared segmented steady-state free precession: Application to 3D black-blood cardiovascular magnetic resonance of the thoracic aorta and carotid artery walls. J Cardiovasc Magn Reson. 2007;9:33–42. doi: 10.1080/10976640600843413. [DOI] [PubMed] [Google Scholar]
- 24.Pell GS, Lewis DP, Branch CA. Pulsed arterial spin labeling using TurboFLASH with suppression of intravascular signal. Magn Reson Med. 2003;49:341–350. doi: 10.1002/mrm.10373. [DOI] [PubMed] [Google Scholar]
- 25.Sirol M, Itskovich VV, Mani V, et al. Lipid-rich atherosclerotic plaques detected by gadofluorine-enhanced in vivo magnetic resonance imaging. Circulation. 2004;109:2890–2896. doi: 10.1161/01.CIR.0000129310.17277.E7. [DOI] [PubMed] [Google Scholar]
- 26.Wang J, Yarnykh VL, Hatsukami T, Chu B, Balu N, Yuan C. Improved suppression of plaque-mimicking artifacts in black-blood carotid atherosclerosis imaging using a multislice motion-sensitized driven-equilibrium (MSDE) turbo spin-echo (TSE) sequence. Magn Reson Med. 2007;58:973–981. doi: 10.1002/mrm.21385. [DOI] [PubMed] [Google Scholar]
- 27.Krishnam MS, Tomasian A, Malik S, et al. Three-dimensional imaging of pulmonary veins by a novel steady-state free-precession magnetic resonance angiography technique without the use of intravenous contrast agent: initial experience. Invest Radiol. 2009;44:447–453. doi: 10.1097/RLI.0b013e3181a7c6cb. [DOI] [PubMed] [Google Scholar]
- 28.Haacke EM, Brown RW, Thompson MR, Venkatesan R. Magnetic resonance imaging physical principles and sequence design. New York: Wiley-Liss; 1999. p. 673. [Google Scholar]
- 29.Fan Z, Zhou X, Bi X, Dharmakumar R, Carr J, Li D. Determination of the optimal first-order gradient moment for flow-sensitive dephasing magnetization-prepared 3D noncontrast MR angiography. Magn Reson Med. 2011 doi: 10.1002/mrm.22847. In press. [DOI] [PMC free article] [PubMed] [Google Scholar]
- 30.Bornstedt A, Burgmaier M, Hombach V, Marx N, Rasche V. Dual stack black blood carotid artery CMR at 3T: Application to wall thickness visualization. J Cardiovasc Magn Reson. 2009;11:45. doi: 10.1186/1532-429X-11-45. [DOI] [PMC free article] [PubMed] [Google Scholar]
- 31.Makhijani MK, Hu HH, Pohost GM, Nayak KS. Improved blood suppression in three-dimensional (3D) fast spin-echo (FSE) vessel wall imaging using a combination of double inversion-recovery (DIR) and diffusion sensitizing gradient (DSG) preparations. J Magn Reson Imaging. 2010;31:398–405. doi: 10.1002/jmri.22042. [DOI] [PMC free article] [PubMed] [Google Scholar]
- 32.Wong EC, Cox RW, Song AW. Optimized isotropic diffusion weighting. Magn Reson Med. 1995;34:139–143. doi: 10.1002/mrm.1910340202. [DOI] [PubMed] [Google Scholar]
- 33.Avouac J, Guerini H, Wipff J, et al. Radiological hand involvement in systemic sclerosis. Ann Rheum Dis. 2006;65:1088–1092. doi: 10.1136/ard.2005.044602. [DOI] [PMC free article] [PubMed] [Google Scholar]
- 34.Janevski B. Arteries of the hand in patients with scleroderma. Diagn Imaging Clin Med. 1986;55:262–265. [PubMed] [Google Scholar]