

Abstract
Background and Aims
Chemoembolization is a standard treatment for hepatocellular carcinoma (HCC). Radioembolization with 90Y microspheres is a new, transarterial approach to radiation therapy. We performed a comparative effectiveness analysis of these therapies in patients with HCC.
Methods
We collected data from 463 patients who were treated with transarterial locoregional therapies (chemoembolization or radioembolization) over a 9-year period. We excluded patients who were not appropriate for comparison and analyzed data from 245 (122 who received chemoembolization and 123 who received radioembolization). Patients were followed for signs of toxicity; all underwent imaging analysis at baseline and follow-up timepoints. Overall survival was the primary outcome measure. Secondary outcomes included safety, response rate, and time-to-progression. Uni- and multi-variate analyses were performed.
Results
Abdominal pain and increased transaminase activity were more frequent following chemoembolization (P<.05). There was a trend that patients treated with radioembolization had a higher response rate than with chemoembolization (49% vs. 36%, P=0.104). Although time-to-progression was longer following radioembolization than chemoembolization (13.3 months vs 8.4 months, P=0.046), median survival times were not statistically different (17.4 months vs 20.5 months, P=0.232). Among patients with intermediate-stage disease, survival was similar between groups that received chemoembolization (17.5 months) and radioembolization (17.2 months, P=0.42).
Conclusion
Patients with HCC treated by chemoembolization or radioembolization with 90Y microspheres had similar survival times. Radioembolization resulted in longer time-to-progression and less toxicity than chemoembolization. Post-hoc analyses of sample size indicated that a randomized study with >1000 patients would be required to establish equivalence of survival times between patients given the different therapies.
Keywords: liver cancer, radiotherapy, chemotherapy, clinical trial
Introduction
Hepatocellular carcinoma (HCC) claims over half a million lives annually1. While surgical treatments (transplantation/resection) provide the best curative outcomes, most patients present at an advanced stage2. Systemic targeted therapies play a role in advanced disease3, 4. Locoregional therapies (LRTs) have demonstrated therapeutic efficacy for HCC in selected patients, with chemoembolization conveying a survival benefit. Chemoembolization now represents one of the standards of care [Barcelona Clinic Liver Cancer (BCLC) stage B]. Yttrium-90 microspheres (90Y radioembolization) has regulatory approval for liver cancer and is recognized as a treatment option for HCC by the National Comprehensive Cancer Network guidelines as well as the recent Consensus Recommendations of the National Cancer Institute Clinical Trials Planning Meeting5, 6.
We recently demonstrated survival outcomes following 90Y that are comparable to chemoembolization7. Given these findings, our center recently initiated a phase 2 randomized controlled trial (RCT) with response rate (RR)/time-to-progression (TTP) as endpoints comparing 90Y to chemoembolization. However, it has become clear that in order to show survival equivalence between these two interventions, a prohibitively large number of patients would be required. Given this, we undertook a comprehensive comparative effectiveness analysis between 90Y and chemoembolization using recently described methodology7-12.
Methods
463 consecutive HCC patients were treated with either chemoembolization or 90Y at our institution over a 9-year period. Patients were considered for transarterial therapies if they exhibited unresectable HCC (determined by transplant surgery) and bilirubin <3.0 mg/dL. Criteria used to create the comparison cohorts for this analysis were based on excluding patients who: a) were treated with both chemoembolization and 90Y at any time, b) exhibited portal vein thrombosis (PVT); PVT is a well-recognized approved indication for 90Y and a contraindication for chemoembolization (risk of ischemic hepatitis), c) exhibited extrahepatic metastases (confounding variable), or d) lacked imaging follow-up from expedited transplantation (see Figure 1: study flow chart). This resulted in the identification of 245 patients that could have been safely treated with either option (chemoembolization N=122, 90Y N=123); they represent the study group. This project was compliant with the Health Insurance Portability and Accountability Act, approved by the Northwestern University Institutional Review Board, and was registered (NCT00530010). The data were closed on December 31, 2008.
Figure 1.
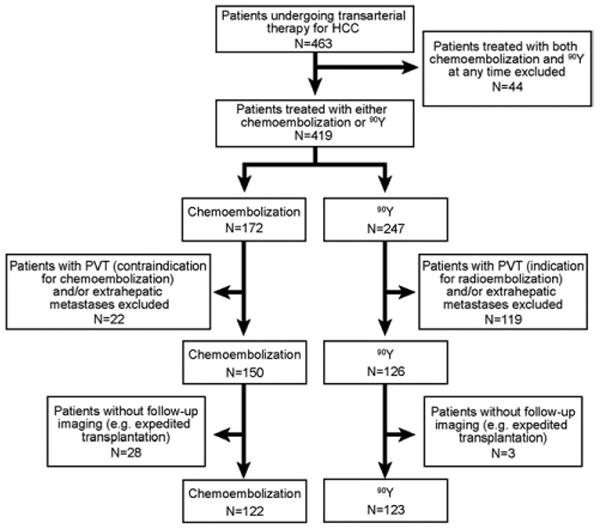
Study flow chart.
Evaluation and Staging
Diagnostic criteria for HCC included biopsy or radiographic findings as defined by guidelines13. Baseline staging was performed by Child-Pugh (liver function), United Network for Organ Sharing (UNOS TNM) (based on tumour size/number) and BCLC classification systems (composite of function, tumour size/number and symptoms) (eTable 1)13. Patients were classified as BCLC C if they exhibited HCC-related symptoms (e.g. tumour-related capsular or referred pain, cancer-related symptoms). The decision to treat with chemoembolization or 90Y was consensus-based during weekly HCC conference represented by medical oncology, hepatology, transplant surgery and interventional radiology.
BCLC is one of several staging systems used for HCC; it has been endorsed as the preferred system14, 15. This system groups patients into six potential treatments: curative options for early disease (BCLC A: resection, transplantation, ablation), palliative options for intermediate (BCLC B: chemoembolization) or advanced disease (BCLC C: sorafenib), and supportive care for end-stage disease (BCLC D)13. However, HCC heterogeneity at presentation results in individualized patient decision-making that often does not permit the simple assignment of the suggested treatment within a BCLC stage; these patients usually receive other treatment (often chemoembolization) based on organ availability, patient-specific factors, contraindications and institutional practices. Despite this, we used the BCLC construct as our rationale for selecting chemoembolization as the standard of care and hence, the comparison group for radioembolization13.
Chemoembolization
Patients were admitted on the day of treatment and received prophylactic intravenous antibiotics. Chemoembolization was performed using 30 mg mitomycin, 30 mg adriamycin and 100 mg cisplatin mixed with lipiodol, followed by arterial embolization using permanent occlusive 300-500 micron particles. Patients were discharged 1-2 days following chemoembolization with a 5-day course of antibiotics and a 2-week course of analgesics and antiemetics as needed16.
Yttrium-90 Radioembolization
The microspheres used were glass-based (TheraSphere®, Ottawa, Canada) and are comprised of 20-30 micron beta-emitting particles. Pre-treatment mesenteric angiography and technetium-99m macroaggregated albumin scans were performed to assess gastrointestinal flow and lung shunting17. Patients were discharged 2-6 hours after treatment without the need for hospitalization on a prophylactic 5-day course of proton-pump inhibitors17.
Toxicity and Clinical Follow-up
Clinical and laboratory adverse events were recorded using National Cancer Institute Common Terminology Criteria v3.0 during routine clinic visits. Adverse events were assessed one month after treatment, and then every 2-3 months coinciding with imaging follow-up. All toxicities (laboratory, clinical) reported at anytime following treatment (no 30-day time cut-off) were recorded and are reported herein. Patients were followed until death; final date of death was confirmed by using the social security death index and/or direct confirmation by family members. Otherwise, patients were censored at the last known clinic follow-up.
AFP Analysis
Patients with baseline alpha-fetoprotein (AFP) >200 ng/ml were included in an exploratory tumour marker subanalysis. Baseline AFP was compared to the nadir per previous methodology18. Rates of >50% reduction, >90% reduction and complete normalization (AFP ≤13 ng/ml) were determined.
Imaging Analysis
Patients were followed using triphasic computerized tomography or contrast-enhanced magnetic resonance imaging one month following treatment and at scheduled 2-3 month intervals on protocol. Response rate (RR) was assessed using World Health Organization (WHO) size and European Association for Study of the Liver (EASL) necrosis criteria (eTable 2) 3, 14, 19-21.
Statistical Analyses and Survival
Baseline patients characteristics between the two groups were compared using the t-test (means) or Mann-Whitney U test (median) for continuous variables, and Chi-square or Fisher exact test (for small n or highly imbalanced table cells) for categorical data. Data were summarized using descriptive statistics (mean and standard deviation for continuous variables; count and frequency for categorical variables). Time-to-response, TTP and survival analyses were performed from the date of first LRT and were censored to curative therapy7, 13. A TTP endpoint was defined as any of the following: progression by WHO, EASL, UNOS stage, development of any portal vein thrombosis (tumour or bland), appearance of new lesions or extrahepatic metastases (eTable 1). Sub-stratification analyses by BCLC and Child-Pugh stage were also performed. Univariate (Kaplan-Meier) and multivariate analyses (Cox proportional hazards) were conducted to compare survival between groups22, 23. In order to interpret the data most conservatively, P-values <0.1 on univariate analyses were corrected for multiple comparisons using Bonferroni methodology.
The following variables were entered into the multivariate model: age, gender, Eastern Cooperative Oncology Group (ECOG) performance status, AFP, Child-Pugh class, UNOS stage and treatment received (chemoembolization or 90Y). Factors were included in the multivariate model if P<.25 in univariate analysis (unadjusted for multiple comparisons). Individual components of composite variables were excluded from multivariate analyses (see Table 4 legend, eTable 1, eTable 3 legend).
Table 4. Uni/Multivariate Analyses (Survival).
| UNIVARIATE ANALYSIS (Kaplan Meier and Logrank Test) |
MULTIVARIATE ANALYSIS (Cox Proportional Hazards Model)** |
|||||
|---|---|---|---|---|---|---|
| Predictor | Category | Hazard ratio (CI) | P | Adj. P* | Hazard ratio (CI) | P |
| Age | <65 | 1.70 (1.16-2.50) | 0.007 | 0.091 | 1.29 (0.83-1.99) | 0.260 |
| ≥65 | 1.00 | 1.00 | ||||
| Gender | Female | 1.40 (0.89-2.17) | 0.138 | 1.69 (1.06-2.68) | 0.027 | |
| Male | 1.00 | 1.00 | ||||
| Ethnicity | African-American | 0.98 (0.58-1.67) | 0.941 | - | - | |
| Hispanic | 1.06 (0.58-1.92) | 0.849 | - | - | ||
| Asian | 0.72 (0.38-1.37) | 0.319 | - | - | ||
| Caucasian | 1.00 | - | - | |||
| Child-Pugh Class*** | A | 0.79 (0.54-1.15) | 0.215 | 0.58 (0.39-0.88) | 0.010 | |
| B/C | 1.00 | 1.00 | ||||
| Baseline Bilirubin | <2 mg/dL | 1.22 (0.69-2.15) | 0.490 | - | - | |
| ≥2 mg/dL | 1.00 | - | - | |||
| Baseline Albumin | >3.5 mg/dL | 0.55 (0.29-1.07) | 0.077 | - | - | |
| ≤3.5 mg/dL | 1.00 | - | - | |||
| Ascites | Absent | 0.56 (0.35-0.88) | 0.011 | 0.143 | - | - |
| Present | 1.00 | - | - | |||
| ECOG Performance Status | 0 | 0.50 (0.34-0.74) | 0.005 | 0.065 | 0.57 (0.37-0.87) | 0.009 |
| >0 | 1.00 | 1.00 | ||||
| AFP (ng/mL) | ≤200 | 0.59 (0.40-0.87) | 0.008 | 0.104 | 0.77 (0.51-1.16) | 0.209 |
| >200 | 1.00 | 1.00 | ||||
| UNOS Stage*** | T1/T2 | 0.37 (0.23-0.60) | <.001 | <.001 | 0.33 (0.19-0.56) | <0.001 |
| T3 | 0.45 (0.29-0.70) | <.001 | 0.005 | 0.48 (0.30-0.77) | 0.003 | |
| T4a | 1.00 | 1.00 | ||||
| Maximum Baseline Dimension | ≤5 cm | 0.78 (0.46-1.33) | 0.366 | - | - | |
| 5-10 cm | 1.07 (0.61-1.88) | 0.812 | - | - | ||
| >10 cm | 1.00 | - | - | |||
| Solitary/Multifocal | Solitary | 0.56 (0.37-0.83) | 0.004 | 0.052 | - | - |
| Multifocal | 1.00 | - | - | |||
| Treatment | Radioembolization | 0.80 (0.55-1.16) | 0.232 | 1.06 (0.70-1.62) | 0.780 | |
| Chemoembolization | 1.00 | 1.00 | ||||
Abbreviations: CI, confidence interval; EASL, European Association for Study of the Liver; ECOG, Eastern Cooperative Oncology Group; HR, hazard ratio; UNOS, United Network for Organ Sharing; WHO, World Health Organization.
P-value adjusted for multiple comparisons (correction factor n=13).
Factors were included in multivariate analysis if P <.25 in univariate analysis (unadjusted for multiple comparisons).
Only 1 variable was chosen if there was overlapping of factors of the categorical variables; ie, (1) ascites, baseline bilirubin and baseline albumin were excluded because these variables are captured in Child-Pugh class; (2) distribution (solitary/multifocal) and maximum baseline dimension were excluded because these variables are captured in UNOS stage.
Hazard ratio estimates were based on simultaneous analysis of all predicated variables. Assumption of proportionality was tested using log-minus-log plot and was met. Uni/multivariate analyses were also performed in the BCLC B subgroup. This study was powered (80%) to detect a hazard ratio of >1.45 or <0.69 between 90Y and chemoembolization using two-sided alpha of 0.05 and median survival time of 17.5 months with chemoembolization. All analyses were conducted using SAS 9.2 (SAS, Cary, NC); a P-value <.05 was considered statistically significant.
Results
Patient Sample and Baseline Characteristics
Table 1 summarizes the baseline patient demographics. 90Y patients were older (66 vs. 61 yrs, P<.001). Both groups were treatment naïve (>90%) and had comparable rates of portal hypertension, ascites, cirrhosis, tumour distribution, bilirubin and cancer stage (UNOS, BCLC and Child-Pugh).
Table 1. Baseline Patient Characteristics.
| Characteristic N (%) | TACE N=122 |
90Y N=123 |
P | |
|---|---|---|---|---|
| Demographics | ||||
| Age (years) | Median | 61 | 66 | <.001 |
| Range | 33-88 | 30-88 | ||
| Ethnic Group | Caucasian | 79 (65) | 91 (74) | 0.40 |
| Asian | 13 (11) | 12 (10) | ||
| Hispanic | 15 (12) | 9 (7) | ||
| African-American | 15 (12) | 11 (9) | ||
| Gender | Male | 102 (84) | 87 (71) | 0.14 |
| Female | 20 (16) | 36 (29) | ||
| Etiology | Alcohol | 21 (17) | 20 (16) | 0.24 |
| HCV | 56 (46) | 42 (35) | ||
| HCV + Alcohol | 2 (2) | 6 (4) | ||
| HBV | 12 (10) | 13 (11) | ||
| NASH | 1 (1) | 5 (4) | ||
| Cryptogenic | 25 (20) | 28 (23) | ||
| Unknown | 5 (4) | 9 (7) | ||
| Method of Diagnosis | Imaging | 71 (58) | 68 (55) | 0.49 |
| Biopsy | 51 (42) | 55 (45) | ||
| Prior Failed Therapies | None | 112 (92) | 112 (91) | 0.81 |
| RFA | 6 (5) | 8 (7) | ||
| Resection | 4 (3) | 3 (2) | ||
| Imaging Characteristics | ||||
| Portal Hypertension | Present | 98 (80) | 90 (73) | 0.22 |
| Absent | 24 (20) | 33 (27) | ||
| Ascites | Present | 21 (17) | 16 (13) | 0.38 |
| Absent | 101 (83) | 107 (87) | ||
| Cirrhosis | Present | 112 (92) | 106 (86) | 0.22 |
| Absent | 10 (8) | 17 (14) | ||
| Lobar Distribution | Unilobar | 80 (66) | 79 (64) | 0.9 |
| Bilobar | 42 (34) | 44 (36) | ||
| Distribution | Solitary | 57 (47) | 55 (45) | 0.85 |
| Multifocal | 65 (53) | 68 (55) | ||
| Largest Tumour Size (cm) | Median (Inter-quartile range) | 3.6 (2.6-5.7) | 4.5 (3.1-6.6) | 0.10 |
| AFP (ng/mL) | >200 | 38 (30) * | 41 (33) * | 0.82 |
| ≤200 | 84 (70) | 82 (67) | ||
| Staging | ||||
| UNOS | T1 | 4 (3) | 1 (1) | 0.44 |
| T2 | 46 (38) | 44 (36) | ||
| T3 | 35 (29) | 43 (35) | ||
| T4a (≥4 tumours) | 37 (30) | 35 (28) | ||
| BCLC | A | 47 (39) | 43 (35) | 0.95 |
| B | 61 (50) | 65 (53) | ||
| C | 12 (9) | 13 (10) | ||
| D | 2 (2) | 2 (2) | ||
| Child-Pugh | A | 67 (55) | 67 (54) | 0.99 |
| B | 53 (43) | 54 (44) | ||
| C | 2 (2) | 2 (2) | ||
Follow-up AFP was not available in 1 chemoembolization and 1 radioembolization patient, TACE=chemoembolization
Treatment Characteristics
The median number of chemoembolization treatments was 2 [inter-quartile range (IQR):1-3]; it was 1 for 90Y (IQR:1-2) (P=0.09). Mean days hospitalized per treatment session was 1.8 (range:1-11) for chemoembolization and 0 for 90Y (P<.001). Mean cumulative days hospitalized was 3.4 (range:1-22) for chemoembolization and 0 for 90Y (P<.001). Median administered liver and lung radiation doses of 90Y were 110 Gy [95% confidence interval (CI):102-115] and 3.7 Gy (CI:2.9-5), respectively. For 90Y, prophylactic coil embolization of non-target vessels was performed in 40/123 patients (33%); this rate was consistent throughout the study period.
Clinical/Laboratory Toxicities
Table 2 lists the clinical and laboratory toxicities. Although fatigue and fever were more common following 90Y and diarrhea was more common with chemoembolization, these observations were not maintained upon P-value correction. Both abdominal pain (P<.001) and elevated transaminases (29% vs. 11%, P=0.004) were more common with chemoembolization. There were no gastrointestinal ulcers.
Table 2. Toxicity Analyses.
| Characteristic | TACE N=122 |
90Y N=123 |
P | Adj. P* | |
|---|---|---|---|---|---|
| Clinical Toxicities | |||||
| Fatigue | Total | 47 (38) | 68 (55) | 0.012 | 0.074 |
| Child-Pugh A | 28/67 (42) | 41/67 (62) | 0.038 | 0.226 | |
| Child-Pugh B/C | 19/55 (35) | 27/56 (48) | 0.179 | ||
| Abdominal Pain | Total | 46 (38) | 18 (15) | <.001 | <.001 |
| Child-Pugh A | 25/67 (37) | 5/67 (7) | <.001 | <.001 | |
| Child-Pugh B/C | 21/55 (38) | 13/56 (23) | 0.818 | ||
| Nausea/Vomiting | Total | 25 (20) | 18 (15) | 0.299 | |
| Child-Pugh A | 14/67 (21) | 11/67 (16) | 0.658 | ||
| Child-Pugh B/C | 11/55 (20) | 7/56 (13) | 0.314 | ||
| Anorexia | Total | 16 (13) | 13 (11) | 0.675 | |
| Child-Pugh A | 8/67 (12) | 7/67 (10) | 1.000 | ||
| Child-Pugh B/C | 8/55 (15) | 6/56 (11) | 0.580 | ||
| Fever/Chills | Total | 2 (2) | 10 (8) | 0.034 | 0.205 |
| Child-Pugh A | 2/67 (3) | 9/67 (13) | 0.055 | 0.328 | |
| Child-Pugh B/C | 0/55 (0) | 1/56 (2) | 1.000 | ||
| Diarrhea | Total | 10 (8) | 2 (2) | 0.019 | 0.115 |
| Child-Pugh A | 9/67 (13) | 2/67 (3) | 0.055 | 0.328 | |
| Child-Pugh B/C | 1/55 (2) | 0/56 (0) | 1.000 | ||
| Grade 3-4 Laboratory Toxicities | |||||
| Bilirubin | Total | 25 (20) | 20 (16) | 0.490 | |
| Child-Pugh A | 11/67 (16) | 8/67 (12) | 0.621 | ||
| Child-Pugh B/C | 14/55 (25) | 12/56 (21) | 0.659 | ||
| Alkaline Phosphatase | Total | 3 (2) | 3 (2) | 1.000 | |
| Child-Pugh A | 1/67 (2) | 1/67 (2) | 1.000 | ||
| Child-Pugh B/C | 2/55 (4) | 2/56 (4) | 1.000 | ||
| ALT/AST | Total | 36 (29) | 14 (11) | 0.0008 | 0.004 |
| Child-Pugh A | 18/67 (27) | 10/67 (15) | 0.136 | ||
| Child-Pugh B/C | 18/55 (33) | 4/56 (7) | 0.0008 | 0.004 | |
| Albumin | Total | 26 (21) | 15 (12) | 0.082 | 0.41 |
| Child-Pugh A | 10/67 (15) | 4/67 (6) | 0.156 | ||
| Child-Pugh B/C | 16/55 (29) | 11/56 (19) | 0.275 | ||
| Creatinine | Total | 4 (3) | 4 (3) | 1.000 | |
| Child-Pugh A | 1/67 (2) | 1/67 (2) | 1.000 | ||
| Child-Pugh B/C | 3/55 (4) | 3/56 (6) | 1.000 | ||
P-value adjusted for multiple comparisons (correction factor n=6 and 5 for clinical and laboratory toxicities respectively); TACE=chemoembolization
Alpha-fetoprotein Subanalysis
Both chemoembolization (N=37) and 90Y (N=40) resulted in significant reduction of AFP [(chemoembolization: baseline 985 ng/ml (IQR:445-4148); nadir 390 ng/ml (IQR:66-1606), (P=0.008)]; [90Y: baseline 1246 ng/ml (IQR:593-9205); nadir 73 ng/ml (IQR:27-2321), (P<.001)]. 22 (59%) and 32 (80%) of the chemoembolization and 90Y patients exhibited >50% AFP reduction (P=0.086), with a median time to >50% AFP reduction of 2.6 months (CI:2.1-3.9) for 90Y and 3.9 months (CI:2.8-7.5) for chemoembolization. 14 (38%) and 19 (48%) of the chemoembolization and 90Y patients exhibited >90% AFP reduction, respectively (P=0.532). Complete normalization was seen in 4 (11%) and 9 (22%) of the chemoembolization and 90Y patients, respectively (P=0.288).
Imaging Outcomes
Response rate
Table 3 lists the imaging outcomes stratified by stage. 1065 scans were reviewed (mean: 4.3 scans/patient). RR by WHO trended towards 90Y over chemoembolization (49% vs. 36%, P=0.104). Median time to WHO partial response was shorter with 90Y than chemoembolization (6.6 vs. 10.3 months, P=0.050). By EASL, RRs were similar (chemoembolization: 69%, 90Y: 72%, P=0.748), with faster time to EASL response with 90Y (1.2 vs. 2.2 months, P=0.016).
Table 3. Imaging and Survival Outcomes.
| Characteristic | TACE N=122 |
90Y N=123 |
P | Adj. P* | TACE N=122 |
90Y N=123 |
P | Adj. P* | |
|---|---|---|---|---|---|---|---|---|---|
| WHO Response | EASL Response | ||||||||
| Time to Response (Months) (CI) | 10.3 (7.7-16) | 6.6 (4.2-8.6) | 0.025 | 0.050 | 2.2 (1.5-3.0) | 1.2 (1.1-2.1) | 0.008 | 0.016 | |
| OVERALL RESPONSE RATE | 44/122 (36) | 60/123 (49) | 0.052 | 0.104 | 84/122 (69) | 88/123 (72) | 0.748 | ||
| Child-Pugh A | Overall | 25/67 (37) | 36/67 (54) | 0.082 | 0.164 | 43/67 (64) | 52/67 (78) | 0.128 | |
| T1/T2 | 7/24 (29) | 12/22 (55) | 0.134 | 20/24 (83) | 19/22 (86) | 1.00 | |||
| T3 | 9/18 (50) | 15/24 (63) | 0.533 | 12/18 (67) | 21/24 (88) | 0.139 | |||
| T4a (≥ 4 tumours) | 9/25 (36) | 9/21 (43) | 0.764 | 11/25 (44) | 12/21 (57) | 0.554 | |||
| Child-Pugh B | Overall | 19/53 (36) | 24/54 (44) | 0.478 | 40/53 (75) | 36/54 (67) | 0.429 | ||
| T1/T2 | 9/25 (36) | 8/22 (36) | 1.00 | 19/25 (76) | 15/22 (68) | 0.745 | |||
| T3 | 4/16 (25) | 11/19 (58) | 0.086 | 0.172 | 12/16 (75) | 16/19 (84) | 0.677 | ||
| T4a (≥ 4 tumours) | 6/12 (50) | 5/13 (38) | 1.00 | 9/12 (75) | 5/13 (38) | 0.111 | |||
| Child-Pugh C | Overall | 0/2 (0) | 0/2 (0) | - | - | 1/2 (50) | 0/2 (0) | - | |
| BCLC | A | 15/47 (32) | 20/43 (47) | 0.229 | 38/47 (81) | 33/43 (77) | 0.827 | ||
| B | 27/61 (44) | 33/65 (51) | 0.581 | 40/61 (66) | 46/65 (71) | 0.664 | |||
| C | 2/12 (17) | 7/13 (54) | 0.097 | 0.194 | 5/12 (42) | 9/13 (69) | 0.238 | ||
| D | 0/2 (0) | 0/2 (0) | - | 1/2 (50) | 0/2 (0) | - | |||
| Time-to-Progression | Survival | ||||||||
| OVERALL (Months) (CI) | 8.4 (7.3-10.6) | 13.3 (9.3-25) | 0.023 | 0.046 | 17.4 (13.9-18.7) | 20.5 (15.7-29.1) | 0.232 | ||
| Child-Pugh A | Overall | 9.6 (7.6-11.7) | 21.9 (10.8-27.1) | 0.19 | 17.5 (14.8-20.7) | 22.1 (17.2-32.6) | 0.13 | ||
| T1/T2 | 11.3 (7.2-32.9) | 27.1 (8, -) | 0.8 | - (11.4, -) | 26.9 (17.1-27.4) | 0.7 | |||
| T3 | 12.8 (6.1, -) | 21.9 (10.8-25.9) | 0.42 | 19.2 (13.9-31.5) | 35.7 (18.2, -) | 0.049 | 0.098 | ||
| T4a (≥ 4 tumours) | 9.4 (7.3-11.5) | 8.6 (5, -) | 0.6 | 15.1 (12.6-18.2) | 14.9 (7.7-22.1) | 0.68 | |||
| Child-Pugh B | Overall | 7.7 (5.8-10.7) | 13 (8.4-25.1) | 0.06 | 0.12 | 17.4 (10.7-24.4) | 17.0 (11.2-30.2) | 0.7 | |
| T1/T2 | 6.8 (4.3-20.2) | 13 (6.2-25.1) | 0.19 | 26 (12.8-46.1) | 29.1 (17, -) | 0.68 | |||
| T3 | 7 (3.1-19.6) | 17.7 (8.4-33.8) | 0.057 | 0.114 | 17.4 (10.6-26.4) | 38.3 (11.4-41.6) | 0.8 | ||
| T4a (≥ 4 tumours) | 7.7 (5.8, -) | 5.4 (3, -) | 0.56 | 10.0 (4.7-17.9) | 6.8 (5.3-13.6) | 0.97 | |||
| Child-Pugh C | Overall | 4.4 (-, -) | 1.6 (-, -) | 0.7 | 11.3 (-, -) | 2.4 (-, -) | 0.09 | 0.18 | |
| BCLC | A | 8.8 (6.8-20.2) | 25.1 (8-27.2) | 0.4 | 45.4 (15.1-46.1) | 27.3 (17.1-30.2) | 0.74 | ||
| B | 9.4 (7.2-11.5) | 13.3 (8.4-25.9) | 0.047 | 0.094 | 17.5 (14.8-18.7) | 17.2 (11.4-29.6) | 0.42 | ||
| C | 7.9 (3.6, -) | 13.8 (10.8, -) | 0.38 | 9.3 (6.2-11.5) | 22.1 (11.2, -) | 0.04 | 0.08 | ||
| D | 4.4 (-, -) | 1.6 (-, -) | 0.7 | 11.3 (-, -) | 2.4 (-, -) | 0.09 | 0.18 | ||
P-value adjusted for multiple comparisons (correction factor n=2); TACE=chemoembolization
Time-to-Progression
96 patients progressed (90Y: 42, chemoembolization: 54). By median TTP, 90Y outperformed chemoembolization (13.3 months vs. 8.4 months, P=0.046).
Survival
Table 3 also reports survival. The number of chemoembolization and 90Y patients censored was 44 and 31, respectively (transplantation N=73, resection N=2). 113 patients died (chemoembolization: 59, 90Y: 54) during the median follow-up time of 32.6 months for chemoembolization and 22.7 months for 90Y. Overall, both treatments resulted in similar overall survival (Figure 2). Exceptions to this were noted in two subgroups; there was improved survival with 90Y in Child-Pugh A T3 and BCLC C patients (Table 3) on univariate analysis; this was not maintained when correcting for multiple comparisons. BCLC B patients exhibited nearly identical survival times (17.5 months vs. 17.2 months, P=0.42). Survival was also not different between the groups after excluding patients that had been censored to curative therapies, or by intention-to-treat analysis when comparing the groups prior to excluding those that had no follow-up imaging (chemoembolization N=150, 90Y N=126; see study flow chart, survival data not shown).
Figure 2.
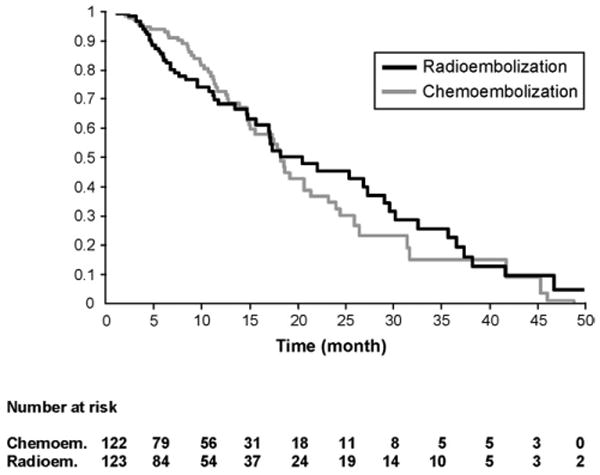
Survival distribution function by treatment group adjusted for covariates (P = .7803).
Uni/Multivariate Analyses
Uni/multivariate analyses are presented in Table 4. Female gender [Hazard ratio (HR): 1.69, CI:1.06-2.68], ECOG 0 (HR:0.57, CI:0.37-0.87), Child-Pugh class A (HR: 0.58, CI:0.39-0.88), UNOS T3 (HR:0.48, CI:0.30-0.77) and UNOS T1/T2 (HR:0.33, CI:0.19-0.56) were significant prognosticators of survival. Treatment received (chemoembolization or 90Y) was not (HR:1.06, CI:0.70-1.62) (Figure 2). In the BCLC B subanalysis (eTable 3), Child-Pugh class A, ECOG 0 and UNOS T3 were significant prognosticators of survival. Again, treatment received was not (HR:0.86, CI:0.50-1.47).
Testing for Survival Equivalence: Post Hoc Projected Sample Size Analysis
Based on these results and the lack of clear survival difference between treatment groups, we conducted a post-hoc sample size estimate needed for a RCT testing for therapeutic (survival) equivalence. Assuming 17.5 months median survival for chemoembolization (standard of care) and a clinical equivalence limit set at 2 months (lower limit: 15.5 months, upper limit: 19.5 months; 60 months follow-up), approximately 870 would be needed to demonstrate survival equivalence with an 80% power and a type I error of 0.05. This increases to >1000 patients if a screening failure rate of 15% is applied.
Discussion
HCC is a condition where many patients present beyond potentially curative options2. Sorafenib has been shown to extend survival in advanced disease3, 4. Radiofrequency ablation for small tumours is potentially curative, although large RCTs comparing to resection are lacking24. In non-ablatable disease, palliation with chemoembolization in selected patients improves survival when compared to best supportive care25. Chemoembolization has therefore become the transarterial standard of care for unresectable HCC patients12, 13.
Although chemoembolization and 90Y are both delivered through the hepatic artery, they are mechanistically quite different. Chemoembolization involves the injection of chemotherapy into liver tumours with a macroembolic effect and arterial occlusion26. This results in a cascade of events including overexpression of hypoxia-inducible factor 1α and vascular endothelial growth factor27. Clinically, this is manifest as pain and post-embolization syndrome, often requiring anti-inflammatories, narcotics and hospitalization for management27. Permanent occlusion of hepatic vessels is also a possibility. In contradistinction, 90Y involves the hepatic injection of radioactive particles without arterial occlusion (microembolic effect)28. Hence, there is no hypoxia-initiated cascade; clinical sequelae are derived from radiation and include post-radioembolization syndrome, dominated by fatigue managed without hospitalization. Vessel patency also permits subsequent arterial treatment if necessary.
90Y represents a novel transarterial brachytherapy device with regulatory approval for the treatment of HCC with or without PVT, or as a bridge to surgery or transplantation. Our center implemented this therapy after observing enhanced tolerability in elderly patients (no post-embolization syndrome), the convenience of outpatient treatment, and its unique role in PVT. This represents a paradigm shift from chemoembolization, where hospitalization is necessary and PVT is a contraindication15. In the presence of PVT, the hepatic artery may be the sole source of blood supply to the liver; a microembolic therapy such as 90Y provides a new option for patients with compromised portal flow28. Further studies in PVT are required, particularly since systemic agents have shown survival benefit in advanced HCC3, 4, 29.
We and others have demonstrated that 90Y can be used safely and effectively with survival outcomes similar to chemoembolization7, 30, 31. Although a RCT comparing 90Y to chemoembolization would be ideal, enrollment requirements for such a trial may compromise its feasibility. Therefore, while a randomized phase 2 study is underway at our institution, we chose to foreshadow potential challenges of a phase 3 RCT (survival) by performing a comparative effectiveness analysis. Comparative effectiveness research is being proposed as a methodology to gain insight into treatment options that reflect “real-world” clinical practices and patient treatment algorithms9, 10, 32.
Safety
Although both groups experienced fatigue, nausea and anorexia, differences in toxicities were noted. Chemoembolization patients were more likely to experience abdominal pain (P<.001). Furthermore, similar to previous reports, chemoembolization patients exhibited significantly higher hepatic transaminase elevation (P=0.004)33, 34. Although 90Y patients received fewer treatments, this did not reach statistical significance.
90Y patients were significantly older than those undergoing chemoembolization. Despite this, our data showed that 90Y was a well-tolerated outpatient treatment with no hospitalizations, underscoring a lower need for in-patient resource utilization.
AFP Response Subanalysis
Both treatments resulted in a significant reduction of AFP. This finding has been shown to prognosticate therapeutic benefit following LRT and chemotherapy18, 35.
Imaging Outcomes
Time-to-response was notably shorter with 90Y. Comparing with the standard of care (chemoembolization), the WHO RR favored 90Y but was not statistically significant. The most striking difference was in overall TTP, where 90Y significantly outperformed chemoembolization. However, prolonged TTP following 90Y did not translate directly into improved survival. In advanced disease where survival is limited (10-11 months), TTP has been correlated with survival3. However, in this patient cohort where overall survival was slightly longer (16-20 months), prolonging TTP may not have had the same effect. One potential explanation might rest in survival time; survival in these patients may have been sufficiently long for any potential survival benefit from delaying tumour growth (prolonged TTP) to be offset by the deleterious effects of chronic background cirrhosis and liver failure. Despite this, TTP is still clinically relevant; delaying TTP as a bridge to transplantation might decrease drop-out rates and improve the chance of a life-saving transplant before death from cirrhosis. This finding favoring 90Y is consistent with two recent radiologic-pathologic analyses36, 37
Survival
Survival data demonstrated similar outcomes between the groups on both univariate and multivariate analyses for the entire cohort as well as BCLC B patients. As previously reported, Child-Pugh A T3 and BCLC C patients demonstrated a longer survival with 90Y over chemoembolization31. This subgroup observation of survival difference should be interpreted with caution given the small sample size and loss of statistical significance following P-value correction.
Future Studies
Radioembolization presents an evolving therapeutic tool in the management of HCC. However, econometric cost analyses comparing in-patient chemoembolization (hospitalization, chemotherapy) and outpatient 90Y (device) will need to be performed, particularly since they appear to exhibit similar patient survival. Although our data did not find statistically significant differences in survival between 90Y and chemoembolization, we cannot conclude survival equivalence.
One of the questions we set out to answer was whether a RCT comparing these two treatments was feasible. Given our experience, we believe several factors limit the feasibility of such a study. HCC is unique in that survival as an outcome is dependent on two co-existing conditions (malignancy and cirrhosis); death may be caused by either factor. Therefore, the choice of a staging system incorporating these variables is essential, especially in the context of treatment decisions. As demonstrated in this study, survival was similar between the two treatments. However, survival equivalence would be difficult to confirm since >1000 patients would be required. Such a study would require a multi-center approach, itself presenting a problem given the current lack of technical and methodological standardization of what is considered the current standard of care-chemoembolization. Studies in HCC necessitating this magnitude of enrollment are rare. As an example, the seminal study of sorafenib in advanced HCC required 121 centers worldwide and reported on 602 randomized patients3. It is also difficult to envision the source of funding for such a study given the current economic environment. Moreover, similar to surgical expertise required for resection/transplantation, the use of chemoembolization or radioembolization also require specific skills; the number of centers that possess this expertise may be limited. Therefore, with this comparative effectiveness analysis, we have attempted to provide an alternative to a RCT while our institutional randomized phase 2 study is conducted.
Strengths and Limitations
There are strengths and limitations to this study. Strengths include the relevance of the study question, as well as the comprehensive comparison of toxicity, imaging and survival from a real-world clinical scenario at a large comprehensive cancer and transplant center; this is the intent of comparative effectiveness10. All toxicities were reported without the usual 30-day post treatment time cut-off, thereby minimizing attribution bias. Although controversial, the statistical methods included adjusted P-values and conclusions were drawn following adjustment, permitting cautious interpretation38, 39. It is noteworthy that most HCC studies exclude Child-Pugh B patients; these patients were well-represented in both cohorts and provided insight into this understudied group. Nearly identical patient baseline cancer stage(s) permitted a thorough comparison between treatments; any heterogeneity would theoretically affect both arms equally. Our center has significant experience with chemoembolization and 90Y, thereby permitting a comprehensive comparison and internal methodological standard7, 12. The importance of in-patient stay and total days hospitalized was recognized as a relevant clinical parameter; this was measured and described. This type of analysis also addresses the reality that clinicians commonly discuss and offer patients several potential treatments for any given HCC status, despite the lack of direct or randomized comparative data between the proposed options (e.g. resection versus ablation for HCC). The weaknesses of the study were mitigated by utilizing conservative reporting methodology, especially for variables assessing response to therapy. Outcome variables (response, TTP, survival) were calculated from time of first treatment, with censoring to curative therapy. TTP was very conservatively measured and, although not clearly stated in the guidelines, included the development of any portal vein thrombosis as an endpoint (clinically relevant finding). Given the improved tolerability and outpatient nature, there was a tendency to treat the elderly with 90Y, representing an inherent bias in favor of chemoembolization. Younger patients were also more likely to receive chemoembolization as a bridge to transplantation. Although both groups had mature follow-up, it was longer with chemoembolization, highlighting the slight difference in time when the treatments were performed. Cost factors were not addressed; this is a complex matter that plagues both treatments as well as all cancer therapies (surgical, systemic, locoregional) in general. These will be the subject of future analyses. Finally, in the absence of randomization, comparative effectiveness analyses may be limited by unmeasured confounders (clinical, social factors) and other selection biases (e.g. physician, local expertise) that may affect treatment decisions, outcomes, as well as the generalizability of these findings10, 40, 41.
Conclusion
Our data show similar survival outcomes between 90Y and chemoembolization for HCC21, 42-44. Despite the older age in the 90Y group, it was better tolerated than chemoembolization with fewer toxicities and treatments, without the need for in-patient hospitalization as a resource. The longer TTP associated with 90Y has drop-out implications in potential recipients being bridged or downstaged to transplantation. While the importance of RCTs is fully acknowledged, we caution that a study aimed at showing survival equivalence may not be logistically feasible and unlikely to yield further clinically relevant information. Although currently there are ongoing randomized studies with transarterial LRTs, none have selected overall survival as the primary endpoint, supporting our findings reported here, as well as the notion of a statistical barrier to demonstrating survival equivalence. Given the results of this comparative effectiveness analysis, we believe a strong case can be made to consider 90Y at least equivalent to chemoembolization as one of the standards of care for HCC. Rather than complete a >1000 patient RCT comparing these two treatments, we believe a better utilization of resources would be to move the science forward, combine this therapy with other approaches, and integrate with the rapidly evolving field of targeted biologics.
Supplementary Material
Acknowledgments
We would like to thank Karen Marshall RN, Sharon Coffey RN, Krystina Salzig RN, Peggy Gilbertsen RN, Jennifer Karp RN and Elizabeth Gonda RN for their compassionate care of our patients.
Role of Funding: There was no funding provided for this study. RS and RAO are supported in part by NIH grant CA126809.
Footnotes
Conflict of Interest: Riad Salem, Laura Kulik, Al Benson and Mary Mulcahy are advisors to MDS Nordion. None of the other authors have any conflict of interest.
Data: The statistical analysis of the entire data sets pertaining to efficacy (specifically primary and major secondary efficacy endpoints) and safety (specifically, serious adverse events as defined in federal guidelines) have been independently confirmed by a biostatistician who is not employed by the corporate entity; and 2) the corresponding author had full access to all of the data and takes full responsibility for the veracity of the data and analysis.
Author contributions:
-study concept/design: RS, RJL, LK, AR, SS, KM, RAO, MA, ABB, MFM
-acquisition of data: RS, RJL, AR, RKR, KTS, RG, PN, FHM, VY, SI, SS, TB, VLG, BA, SN, KM, RC, RLV, AAN, SR, HBC, JC, RAO, MFM
-analysis/interpretation of data: RS, LK, EW, AR, SI, SS, BA, MA, ABB, MFM
-drafting of the manuscript-RS, LK, AR, MFM
-critical revision of the manuscript-all authors
-statistical analysis: RS, EW, AR
-study supervision: RS, LK, EW, AR, SI, SS, BA, RAO, MA, AB, MFM
Publisher's Disclaimer: This is a PDF file of an unedited manuscript that has been accepted for publication. As a service to our customers we are providing this early version of the manuscript. The manuscript will undergo copyediting, typesetting, and review of the resulting proof before it is published in its final citable form. Please note that during the production process errors may be discovered which could affect the content, and all legal disclaimers that apply to the journal pertain.
References
- 1.El-Serag HB. Hepatocellular carcinoma and hepatitis C in the United States. Hepatology. 2002;36:S74–83. doi: 10.1053/jhep.2002.36807. [DOI] [PubMed] [Google Scholar]
- 2.Mazzaferro V, Regalia E, Doci R, et al. Liver transplantation for the treatment of small hepatocellular carcinomas in patients with cirrhosis. N Engl J Med. 1996;334:693–9. doi: 10.1056/NEJM199603143341104. [DOI] [PubMed] [Google Scholar]
- 3.Llovet JM, Ricci S, Mazzaferro V, et al. Sorafenib in advanced hepatocellular carcinoma. N Engl J Med. 2008;359:378–90. doi: 10.1056/NEJMoa0708857. [DOI] [PubMed] [Google Scholar]
- 4.Cheng AL, Kang YK, Chen Z, et al. Efficacy and safety of sorafenib in patients in the Asia-Pacific region with advanced hepatocellular carcinoma: a phase III randomised, double-blind, placebo-controlled trial. Lancet Oncol. 2009;10:25–34. doi: 10.1016/S1470-2045(08)70285-7. [DOI] [PubMed] [Google Scholar]
- 5.Thomas MB, Jaffe D, Choti MM, et al. Hepatocellular carcinoma: consensus recommendations of the National Cancer Institute Clinical Trials Planning Meeting. J Clin Oncol. 2010;28:3994–4005. doi: 10.1200/JCO.2010.28.7805. [DOI] [PMC free article] [PubMed] [Google Scholar]
- 6.Benson AB, 3rd, Abrams TA, Ben-Josef E, et al. NCCN clinical practice guidelines in oncology: hepatobiliary cancers. J Natl Compr Canc Netw. 2009;7:350–91. doi: 10.6004/jnccn.2009.0027. [DOI] [PMC free article] [PubMed] [Google Scholar]
- 7.Salem R, Lewandowski RJ, Mulcahy MF, et al. Radioembolization for hepatocellular carcinoma using Yttrium-90 microspheres: a comprehensive report of long-term outcomes. Gastroenterology. 2010;138:52–64. doi: 10.1053/j.gastro.2009.09.006. [DOI] [PubMed] [Google Scholar]
- 8.Pandharipande PV, Gazelle GS. Comparative effectiveness research: what it means for radiology. Radiology. 2009;253:600–5. doi: 10.1148/radiol.2533091286. [DOI] [PubMed] [Google Scholar]
- 9.Tunis SR, Benner J, McClellan M. Comparative effectiveness research: Policy context, methods development and research infrastructure. Stat Med. 2010;29:1963–76. doi: 10.1002/sim.3818. [DOI] [PubMed] [Google Scholar]
- 10.El-Serag HB, Talwalkar J, Kim WR. Efficacy, effectiveness, and comparative effectiveness in liver disease. Hepatology. 2010;52:403–7. doi: 10.1002/hep.23819. [DOI] [PubMed] [Google Scholar]
- 11.Conway PH, Clancy C. Charting a path from comparative effectiveness funding to improved patient-centered health care. JAMA. 2010;303:985–6. doi: 10.1001/jama.2010.259. [DOI] [PubMed] [Google Scholar]
- 12.Lewandowski RJ, Mulcahy MF, Kulik LM, et al. Chemoembolization for hepatocellular carcinoma: comprehensive imaging and survival analysis in a 172-patient cohort. Radiology. 2010;255:955–65. doi: 10.1148/radiol.10091473. [DOI] [PMC free article] [PubMed] [Google Scholar]
- 13.Llovet JM, Di Bisceglie AM, Bruix J, et al. Design and endpoints of clinical trials in hepatocellular carcinoma. J Natl Cancer Inst. 2008;100:698–711. doi: 10.1093/jnci/djn134. [DOI] [PubMed] [Google Scholar]
- 14.Bruix J, Sherman M, Llovet JM, et al. Clinical management of hepatocellular carcinoma. Conclusions of the Barcelona-2000 EASL conference. European Association for the Study of the Liver. J Hepatol. 2001;35:421–30. doi: 10.1016/s0168-8278(01)00130-1. [DOI] [PubMed] [Google Scholar]
- 15.Bruix J, Sherman M. Management of hepatocellular carcinoma. Hepatology. 2005;42:1208–36. doi: 10.1002/hep.20933. [DOI] [PubMed] [Google Scholar]
- 16.Bruix J, Sala M, Llovet JM. Chemoembolization for hepatocellular carcinoma. Gastroenterology. 2004;127:S179–88. doi: 10.1053/j.gastro.2004.09.032. [DOI] [PubMed] [Google Scholar]
- 17.Salem R, Thurston KG. Radioembolization with 90Yttrium Microspheres: A State-of-the-Art Brachytherapy Treatment for Primary and Secondary Liver Malignancies: Part 1: Technical and Methodologic Considerations. J Vasc Interv Radiol. 2006;17:1251–78. doi: 10.1097/01.RVI.0000233785.75257.9A. [DOI] [PubMed] [Google Scholar]
- 18.Riaz A, Ryu RK, Kulik LM, et al. Alpha-fetoprotein response after locoregional therapy for hepatocellular carcinoma: oncologic marker of radiologic response, progression, and survival. J Clin Oncol. 2009;27:5734–42. doi: 10.1200/JCO.2009.23.1282. [DOI] [PubMed] [Google Scholar]
- 19.Forner A, Ayuso C, Varela M, et al. Evaluation of tumor response after locoregional therapies in hepatocellular carcinoma: are response evaluation criteria in solid tumors reliable? Cancer. 2009;115:616–23. doi: 10.1002/cncr.24050. [DOI] [PubMed] [Google Scholar]
- 20.Therasse P, Arbuck SG, Eisenhauer EA, et al. New guidelines to evaluate the response to treatment in solid tumors. European Organization for Research and Treatment of Cancer, National Cancer Institute of the United States, National Cancer Institute of Canada. J Natl Cancer Inst. 2000;92:205–16. doi: 10.1093/jnci/92.3.205. [DOI] [PubMed] [Google Scholar]
- 21.Riaz A, Miller FH, Kulik LM, et al. Imaging response in the primary index lesion and clinical outcomes following transarterial locoregional therapy for hepatocellular carcinoma. JAMA. 2010;303:1062–9. doi: 10.1001/jama.2010.262. [DOI] [PMC free article] [PubMed] [Google Scholar]
- 22.Kaplan EL, Meier P. Nonparametric estimation from incomplete observations. J Am Stat Assoc. 1958;53:457–481. [Google Scholar]
- 23.Cox DR, Oaks D. Analysis of Survival Data. Chapman & Hall; 1984. [Google Scholar]
- 24.Lencioni R, Cioni D, Crocetti L, et al. Early-stage hepatocellular carcinoma in patients with cirrhosis: long-term results of percutaneous image-guided radiofrequency ablation. Radiology. 2005;234:961–7. doi: 10.1148/radiol.2343040350. [DOI] [PubMed] [Google Scholar]
- 25.Llovet JM, Real MI, Montana X, et al. Arterial embolisation or chemoembolisation versus symptomatic treatment in patients with unresectable hepatocellular carcinoma: a randomised controlled trial. Lancet. 2002;359:1734–9. doi: 10.1016/S0140-6736(02)08649-X. [DOI] [PubMed] [Google Scholar]
- 26.Leelawat K, Laisupasin P, Kiatdilokrut A, et al. The effect of doxorubicin on the changes of serum vascular endothelial growth factor (VEGF) in patients with hepatocellular carcinoma after transcatheter arterial chemoembolization (TACE) J Med Assoc Thai. 2008;91:1539–43. [PubMed] [Google Scholar]
- 27.Virmani S, Rhee TK, Ryu RK, et al. Comparison of hypoxia-inducible factor-1alpha expression before and after transcatheter arterial embolization in rabbit VX2 liver tumors. J Vasc Interv Radiol. 2008;19:1483–9. doi: 10.1016/j.jvir.2008.06.017. [DOI] [PMC free article] [PubMed] [Google Scholar]
- 28.Sato K, Lewandowski RJ, Bui JT, et al. Treatment of Unresectable Primary and Metastatic Liver Cancer with Yttrium-90 Microspheres (TheraSphere(R)): Assessment of Hepatic Arterial Embolization. Cardiovasc Intervent Radiol. 2006;29:522–9. doi: 10.1007/s00270-005-0171-4. [DOI] [PubMed] [Google Scholar]
- 29.Kulik LM, Carr BI, Mulcahy MF, et al. Safety and efficacy of (90)Y radiotherapy for hepatocellular carcinoma with and without portal vein thrombosis. Hepatology. 2007;47:71–81. doi: 10.1002/hep.21980. [DOI] [PubMed] [Google Scholar]
- 30.Geschwind JF, Salem R, Carr BI, et al. Yttrium-90 microspheres for the treatment of hepatocellular carcinoma. Gastroenterology. 2004;127:S194–205. doi: 10.1053/j.gastro.2004.09.034. [DOI] [PubMed] [Google Scholar]
- 31.Lewandowski RJ, Kulik LM, Riaz A, et al. A comparative analysis of transarterial downstaging for hepatocellular carcinoma: chemoembolization versus radioembolization. Am J Transplant. 2009;9:1920–8. doi: 10.1111/j.1600-6143.2009.02695.x. [DOI] [PubMed] [Google Scholar]
- 32.Garber AM, Tunis SR. Does comparative-effectiveness research threaten personalized medicine? N Engl J Med. 2009;360:1925–7. doi: 10.1056/NEJMp0901355. [DOI] [PubMed] [Google Scholar]
- 33.Goin JE, Dancey JE, Roberts CA, et al. Comparison of Post-embolization Syndrome in the Treatment of Patients with unresectable Hepatocellular Carcinoma: Trans-catheter Arterial Chemo-embolization versus Yttrium-90 Glass Microspheres. World J of Nuc Med. 2004;3:49–56. [Google Scholar]
- 34.Lammer J, Malagari K, Vogl T, et al. Prospective randomized study of doxorubicin-eluting-bead embolization in the treatment of hepatocellular carcinoma: results of the PRECISION V study. Cardiovasc Intervent Radiol. 2010;33:41–52. doi: 10.1007/s00270-009-9711-7. [DOI] [PMC free article] [PubMed] [Google Scholar]
- 35.Chan SL, Mo FK, Johnson PJ, et al. New utility of an old marker: serial alpha-fetoprotein measurement in predicting radiologic response and survival of patients with hepatocellular carcinoma undergoing systemic chemotherapy. J Clin Oncol. 2009;27:446–52. doi: 10.1200/JCO.2008.18.8151. [DOI] [PubMed] [Google Scholar]
- 36.Riaz A, Kulik L, Lewandowski RJ, et al. Radiologic-pathologic correlation of hepatocellular carcinoma treated with internal radiation using yttrium-90 microspheres. Hepatology. 2009;49:1185–93. doi: 10.1002/hep.22747. [DOI] [PubMed] [Google Scholar]
- 37.Riaz A, Lewandowski RJ, Kulik L, et al. Radiologic-Pathologic Correlation of Hepatocellular Carcinoma Treated with Chemoembolization. Cardiovasc Intervent Radiol. 2009 doi: 10.1007/s00270-009-9766-5. [DOI] [PMC free article] [PubMed] [Google Scholar]
- 38.Gyorffy B, Gyorffy A, Tulassay Z. The problem of multiple testing and solutions for genome-wide studies. Orv Hetil. 2005;146:559–63. [PubMed] [Google Scholar]
- 39.Cleophas TJ, Zwinderman AH. Clinical trials are often false positive: a review of simple methods to control this problem. Curr Clin Pharmacol. 2006;1:1–4. doi: 10.2174/157488406775268228. [DOI] [PubMed] [Google Scholar]
- 40.Rubin DB. On the limitations of comparative effectiveness research. Stat Med. 2010;29:1991–5. doi: 10.1002/sim.3960. discussion 1996-7. [DOI] [PubMed] [Google Scholar]
- 41.Normand SL, McNeil BJ. What is evidence? Stat Med. 2010;29:1985–8. doi: 10.1002/sim.3933. discussion 1996-7. [DOI] [PMC free article] [PubMed] [Google Scholar]
- 42.Kooby DA, Egnatashvili V, Srinivasan S, et al. Comparison of yttrium-90 radioembolization and transcatheter arterial chemoembolization for the treatment of unresectable hepatocellular carcinoma. J Vasc Interv Radiol. 2010;21:224–30. doi: 10.1016/j.jvir.2009.10.013. [DOI] [PubMed] [Google Scholar]
- 43.D'Avola D, Lnarrairaegui M, Bilbao JI, et al. A retrospective comparative analysis of the effect of Y90-radioembolization on the survival of patients with unresectable hepatocellular carcinoma. Hepatogastroenterology. 2009;56:1683–8. [PubMed] [Google Scholar]
- 44.Carr BI, Kondragunta V, Buch SC, et al. Therapeutic equivalence in survival for hepatic arterial chemoembolization and yttrium 90 microsphere treatments in unresectable hepatocellular carcinoma: a Two-Cohort Study. Cancer. 2010;116:1305–1314. doi: 10.1002/cncr.24884. [DOI] [PMC free article] [PubMed] [Google Scholar]
Associated Data
This section collects any data citations, data availability statements, or supplementary materials included in this article.