

Abstract
Next-generation DNA sequencing technologies are facilitating large-scale association studies of rare genetic variants. The depth of the sequence read coverage is an important experimental variable in the next-generation technologies and it is a major determinant of the quality of genotype calls generated from sequence data. When case and control samples are sequenced separately or in different proportions across batches, they are unlikely to be matched on sequencing read depth and a differential misclassification of genotypes can result, causing confounding and an increased false positive rate. Data from Pilot Study 3 of the 1000 Genomes project was used to demonstrate that a difference between the mean sequencing read depth of case and control samples can result in false-positive association for rare and uncommon variants, even when the mean coverage depth exceeds 30X in both groups. The degree of the confounding and inflation in the false-positive rate depended on the extent to which the mean depth was different in the case and control groups. A logistic regression model was used to test for association between case-control status and the cumulative number of alleles in a collapsed set of rare and uncommon variants. Including each individual's mean sequence read depth across the variant sites in the logistic regression model nearly eliminated the confounding effect and the inflated false positive rate. Furthermore, accounting for the potential error by modeling the probability of the heterozygote genotype calls in the regression analysis had a relatively minor but beneficial effect on the statistical results.
Keywords: Case-control study, Next-generation DNA sequencing, False-positive association, Genome-wide Association
Introduction
As the search for the genetic causes of common diseases continues, candidate disease genes and regions, identified through genome-wide or other experiments, will routinely be investigated comprehensively for rare and common disease alleles by next-generation DNA sequencing[Bansal, et al. 2010; Bodmer and Bonilla 2008; Manolio, et al. 2009; Metzker 2010]. Full exome sequencing has proven to be a powerful approach for identifying rare mutations responsible for Mendelian disorders [Ng, et al. 2010] and complete human genome sequencing for genetic association studies of Mendelian diseases is currently possible [Roach, et al. 2010] and is forthcoming for common diseases [Metzker 2010]. Research in optimal study designs and statistical methods for association studies of common genetic variants, generally single nucleotide polymorphisms, and common disease or quantitative trait outcomes has been ongoing for decades; the experimental and statistical problems are well understood and solutions for many of the problems have been found [Balding 2006]. Genetic studies of rare alleles using next-generation DNA sequencing are in their relative infancy and continued research is required to identify the experimental and statistical problems underlying the experimental approach and find the optimal solutions that will ensure that such experiments are fruitful and robust [Morris and Zeggini 2010].
Although appropriate for studying common disease association with common genetic variants, the general analytical approach of between-group comparison of the allele or genotype frequencies at a single variant is not a viable approach for studying rare variants and common diseases in unrelated individuals. It is neither practical nor feasible to collect samples that are large enough to produce reliable statistics for rare genetic variants. To overcome this statistical challenge, methods that pool or collapse observations across rare variant sites that give measures of cumulative allele counts have been proposed. Collapsing overcomes the intractable statistical power problem inherent in a single-variant approach but raises new problems related to how to optimally collapse variant sites and count of allele and how to compute the statistical significance of observed sets of cumulative alleles [Bansal, et al. 2010; Morris and Zeggini 2010].
The earliest version of the collapsing approach compared the frequency of individuals carrying the minor alleles at any one of a set of rare variants in the case and control groups and a Fisher's exact test was used for computing the statistical significance of the observed difference [Morgenthaler and Thilly 2007]. Li and Leal [Li and Leal 2008] proposed the combined multivariate and collapsing (CMC) method which tested for a difference in the cumulative frequency of sets of collapsed alleles between groups using a Hotelling's T-squared statistic [Xiong, et al. 2002]. The CMC approach could simultaneously tests for frequency differences in collapsed sets of rare alleles and single common polymorphisms and it had many other desirable properties that made it superior to the simple approach that preceded it. Madsen and Browning [Madsen and Browning 2009] proposed a collapsing method that weighted each variant within a collapsed set according to its allele frequency such that rare variants made a larger contribution to the cumulative allele count than did common variants. All individuals were ranked according to their cumulative allele weights and a Wilcoxon rank test was carried out with the statistical significance of the sum of the case ranks being computed through permutation [Lehmann 1975]. Most recently, methods that compute optimal weights based on the predicted function of the rare variants [Price, et al. 2010] and that account for the direction of the association of each rare variant have been proposed [Han and Pan 2010]. Modern regression methods that use regularization and shrinkage parameters to deal with the overfitting and colinearity issues that arise from fitting models to large, complex and spare data have recently found a new application in rare variant analysis, including ridge regression [Malo, et al. 2008] and LASSO [Hoggart, et al. 2008; Zhou, et al. 2010], as well as other modeling approaches [Capanu and Begg 2010; Guo and Lin 2009; Luan and Li 2008]. A statistical method based on a hidden Markov Model was recently proposed specifically for genome-wide analysis of rare variants [Garner 2010]. The new methods for studying rare genetic variation and common diseases each have their own assumptions, strengths and weaknesses and until multiple large experimental datasets become freely available, the relative performance of the current approaches cannot be comprehensively assessed.
In general, current statistical methods for association analysis of rare alleles and common disease outcomes test for a significant difference in the distribution of rare alleles observed between case and control samples; how the distribution is described and the difference is assessed differentiates the various approaches. If case and control samples are prepared and sequenced in the same batch or their numbers are matched within batches, then the samples should be similar with respect to the experimental variables that can affect variant identification and error rates. If case and control samples are processed and/or sequenced separately or in an unmatched design, systematic differences in the experimental variables can arise between the samples. These systematic differences in experimental variables are generally referred to as batch differences and they can result in differential misclassification of genotypes [Leek, et al. 2010]. Sequencing read depth is a very important experimental variable in next-generation sequencing [Metzker 2010]. Sequence read depth is defined here as the number of filtered and aligned sequencing reads covering a specific nucleotide site or position in the genome and is subsequently referred to as the sequence or sequencing depth. The sequencing depth is the most informative characteristic used by the popular allele calling methods and it is highly correlated with the probability that an allele is called incorrectly [Li and Durbin 2009; Li, et al. 2008; McKenna, et al. 2010]. The sequencing depth varies greatly within and between experiments.
Given the considerable expense of large-scale next-generation DNA sequencing experiments, study designs that rely on public sequence data, e.g., the 1000 Genomes Project [Durbin, et al. 2010], or shared controls, e.g., the Wellcome Trust Case Control Consortium, make strong economic sense. The advantages and potential pitfalls of such study designs have been studied in the context of common SNP association studies [Garner 2006; Zhuang, et al. 2010]. When cases and control samples are prepared and/or sequenced differentially, they are unlikely to have similar patterns of depth across the sequenced regions. A simple statistical test of the mean depth in the case and control samples would indicate the extent to which the samples are different and whether or not the sequencing depth is a significant predictor of the outcome. Because sequencing depth is correlated with the accuracy of the allele calls, it is likely to be correlated with the number of alleles observed in a sample. Studies of rare alleles are most sensitive to the base calling error rate because a single error can result in a monomorphic site falsely becoming a rare variant. If sequencing depth is correlated with case-control status it will be a confounder in an association analysis and cause false positive associations between rare alleles and the outcome. Fortunately, the depth is easily measured and reported in next-generation sequencing experiments and is not a latent variable. Two popular approaches for handling known confounding variables in case-control studies is either matching the case and control samples on the confounder variable prior to the collection of genetic data and subsequent analysis, or by statistically adjusting for the confounder variable by including it as an additional predictor variable in a multiple linear or logistic regression model.
The current study investigated the use of the case-control study design to study the role of rare alleles within a large genomic region of interest when the case and control samples have different average sequencing depth. Publicly available data from the 1000 Genomes Project Pilot Study 3 [Durbin, et al. 2010] was used to demonstrate the problem of confounding due to differential depth in case and control samples. The extent of the confounding is investigated under a range of sampling scenarios. A linear adjustment for mean depth in a logistic regression model was evaluated as a remedy for the confounding.
Materials
Data from the 1000 Genomes Pilot Study 3 was used for all analyses [Durbin, et al. 2010]. Pilot 3 did included sequencing of approximately 1000 exons at a high depth of about 70X coverage. In order to keep the data as homogenous as possible, only the Illumina data from the 90 CEPH samples that had been processed through the Broad Institute pipeline was included. The Broad pipeline mapped the Illumina generated reads using MAQ [Li and Durbin 2009; Li, et al. 2008]. GATK was used for duplicate removal and base quality calibration, respectively, and variants were called using the UnifiedGenotyper program [McKenna, et al. 2010]. Only called data was used for the current study; no attempt was made to align and assemble the sequence reads or call variants using other methods. The downloaded data included genotypes for 90 individuals at 1,431,207 nucleotide sites in the human genome. The downloaded file (“CEU.BI.pilot3.vcf”) included for each individual at each site; the genotype call, the genotype quality score (analogous to a Phred score [Ewing and Green 1998]), and the filtered read depth at the site. For each variant site, the call rate was calculated as the number of scored genotype calls (only sites with a minimum of 1X coverage were scored) divided by 90. More information on the dataset can be found at www.1000genomes.org.
Methods
Quality scores were converted to probabilities of correctly called genotypes using the function, Pr(Correct Call) = 1 – 10(Quality Score/-10). An individual's allele score for a given variants site was given by the sum of the correct call probabilities for all heterozygote genotypes at the site and a value of 2.0 for each minor allele homozygote. This allele score was computed to reflect the uncertainty in the heterozygote genotype calls. An individual's allele count at a given variant site was given by the sum of the minor alleles at the site. The mean depth was computed for each individual using the depth measurements at all sampled sites where an allele call was made and depth was greater than 0.
A logistic regression model was used to test for association. Each individual was assigned a dichotomous case-control status based on the sampling process described in the Results section. All variants within a defined frequency range were collapsed and the cumulative number of minor alleles and the sum of the allele scores were computed as the primary predictor variable. The logistic regression models assumed that the genetic variants were independent and did not include any weighting or conditioning on characteristics of the alleles. For each individual, all alleles in the defined frequency range were collapsed to create a single predictor variable. Multivariate logistic regression models included a mean depth predictor variable in addition to the cumulative allele variable. The p-value for the allele variable was computed for each replicate dataset and the proportion of replicates meeting specific p-values thresholds was reported for each set of conditions considered in the analysis.
In addition to the logistic regression analysis, each replicate dataset was analyzed using a permutation-based test similar to a Wilcoxon rank test [Lehmann 1975]. Each individual was ranked according to their cumulative allele count or score and the sum of the ranks of the case individuals was computed. The statistical significance of the observed rank sum was computed from a null distribution of ranks. In 10,000 replicate datasets, case-control status was randomly assigned to each individual in the sample while maintaining the 1:1 case-control sampling and the sum of the case ranks was calculated to form the null distribution. This approach is similar to the method proposed by Madsen and Browning [Madsen and Browning 2009] with no weighting applied to the variant sites.
Case and control samples with different mean sequencing depths were generated to demonstrate the confounding problem and evaluate the ability to correct for it in a statistical analysis. The mean depth for each of the 90 Caucasian Pilot Phase III samples was computed from the selected set of variant sites and the samples were ranked accordingly. Replicate case and control comparison groups of 100 individuals each were generated by sampling individuals with replacement according to their position in the upper or lower 50th percentile of the ranked samples (45 individuals in each percentile). To generate a sample of cases, 100 individuals were sampled with replacement from the upper 50th percentile of the mean depth ranked samples with probability equal to k, and from the lower 50th percentile with probability 1 – k. A control sample was similarly generated by sampling individuals from the lower 50th percentile of the ranked samples with probability k, and from the upper 50th percentile with probability 1 – k. The probability k was termed the group mixing percentage and was assessed at values of 0.2, 0.3, 0.4 and 0.5. At k = 0.5, the case and control samples are matched on the mean depth variable. For each replicate, 1000 variants sites were randomly selected from the full set of variant sites, and the total number of minor alleles (or total allele score) was calculated across all sites for each of the 100 case and 100 control individuals. These total allele counts were the independent variables in the logistic regression and rank tests. Variant sites having allele frequencies greater than 0.05 were not included among the sampled set of 1000 variants sites. While a variant with an allele frequency between 0.01 and 0.05 would be considered low rather than rare, the selection of 1000 segregating sites within the given allele frequency range provided and adequate number of minor alleles, given the small sample sizes of 100 case and 100 control individuals, such there was adequate statistical power to investigate the confounding.
Results
The mean sequencing depth across the 90 Caucasian individuals in the 1000 Genomes Pilot Phase 3 was computed for the 2374 rare variant sites that had between one and five minor alleles present in the 180 sampled chromosomes and no missing data, i.e, 100% call rate. The relationship between the number of alleles observed and the average sequencing depth is shown in Figure 1. Monomorphic sites were not included because they represented the overwhelming majority of observations and obscured subtle relationships in the data. A linear regression model was fit to the data to predict the effect of depth on the number of minor alleles observed. The point estimate of the regression coefficient was -0.00616, corresponding to a reduction of roughly one third of an allele for each 50-fold increase in sequence depth; or a decrease of a full allele for each 162-fold increase in depth. An underlying negative relationship between sequencing depth and error rate (i.e., as sequencing depth increases the number of incorrect allele calls decreases) is believed to be the cause of the negative relationship observed here, and is the source of the confounding problem.
Figure 1.

Relationship between the average sequence read depth at a variant site and the number of minor alleles observed in 90 CEPH samples. Analysis was restricted to sites with between one and five minor alleles and variant sites with complete data (minimum call rate = 1.0).
Figure 1a shows the distribution of p-values computed from the logistic regression model and generated from the analysis of 10,000 replicate case-control samples. All sites had complete data, i.e., minimum call rate of 1.0, the group mixing percentage was 30%, and the independent variable in the regression model was the sum of the allele counts. The mean depth in the case sample was 57.3, versus 95.7 for the control sample and there was no statistical adjustment in the regression model to correct for the difference. The distribution of p-values was profoundly non-uniform with a median of 0.14, suggesting that a significant difference in the cumulative number of rare alleles between the case and control samples was observed among the majority of simulated replicates. Figure 1b shows the results from the analysis of the same simulated replicates used to generate Figure 1a however, the logistic regression models included the sum of the allele scores rather than the discrete allele counts. Incorporating the uncertainty in the allele calls into the statistical analysis only had a minor effect on flattening the distribution; the median p-value was 0.205. Figure 1c shows the distribution of p-values computed from the same set of replicate data sets using a multiple logistic regression model with the total allele counts and the mean depth variables included in the model. The distribution in Figure 1c more closely resembles the null distribution of p-values with a median of 0.485, suggesting that much of the confounding effect of sequencing depth is removed by accounting for the variable in the statistical model, although some inflation of the statistics remains. Accounting for uncertainty in the allele calls by including the sum of the allele scores and accounting for the confounding with the mean sequence depth in the multiple logistic regression model further reduced the confounding problem, with the distribution of p-values having a median of 0.485 and a nearly uniform distribution (Figure 1d).
The extent of the confounding and the effectiveness of the adjustment were assessed for a range of group mixing percentages, and with up to 10% missing data at each site (Table I). For each pair of mixing percentage and call rate parameters, four logistic regression models were tested with the following predictor variables: the sum of the allele counts; the sum of the allele scores; the sum of the allele counts and the mean depth; and the sum of the allele scores and the mean depth. The percentage of 10,000 replicate datasets in which the allele sum variable showed p-values less than 0.05, 0.01 and 0.001 are given in Table I. Table I includes the individual mean allele counts and scores, and overall mean depth by case and control status computed from the 10,000 replicates.
Table I.
Results from analysis of 10,000 replicate datasets with confounding using logistic regression.
| Group Mixing (%) | Mean Allele Count (Case/Control) | Mean Allele Score (Case/Control) | Group Mean Depth (Case/Control) | Logistic Regression Results | |||||
|---|---|---|---|---|---|---|---|---|---|
| Allele Coding | Confounder Adjustment | Minimum Call Rate | P-value < 0.05 (%) | P-value < 0.01 (%) | P-value < 0.001 (%) | ||||
| Count | None | 20 | 1.00 | 27.2 / 24.0 | 26.0 / 23.5 | 48.1 / 104.8 | 57.59 | 33.62 | 11.13 |
| Score | None | 20 | 1.00 | 44.94 | 22.37 | 6.19 | |||
| Count | Depth | 20 | 1.00 | 6.69 | 1.44 | 0.18 | |||
| Score | Depth | 20 | 1.00 | 6.47 | 1.42 | 0.19 | |||
| Count | None | 30 | 1.00 | 26.6 / 24.6 | 25.5 / 23.9 | 57.3 / 95.7 | 31.35 | 12.10 | 2.27 |
| Score | None | 30 | 1.00 | 23.60 | 8.28 | 1.37 | |||
| Count | Depth | 30 | 1.00 | 5.84 | 1.13 | 0.12 | |||
| Score | Depth | 30 | 1.00 | 5.20 | 0.91 | 0.11 | |||
| Count | None | 40 | 1.00 | 26.1 / 25.0 | 25.1 / 24.2 | 66.3 / 88.5 | 11.35 | 3.07 | 0.34 |
| Score | None | 40 | 1.00 | 9.54 | 2.16 | 0.27 | |||
| Count | Depth | 40 | 1.00 | 5.16 | 0.94 | 0.10 | |||
| Score | Depth | 40 | 1.00 | 4.82 | 0.72 | 0.07 | |||
| Count | None | 20 | 0.90 | 28.4 / 24.9 | 26.4 / 23.8 | 39.1 / 85.1 | 58.63 | 34.52 | 11.66 |
| Score | None | 20 | 0.90 | 43.76 | 21.33 | 6.29 | |||
| Count | Depth | 20 | 0.90 | 7.12 | 1.90 | 0.25 | |||
| Score | Depth | 20 | 0.90 | 7.04 | 1.85 | 0.21 | |||
| Count | None | 30 | 0.90 | 27.8 / 24.5 | 25.9 / 24.2 | 46.6 / 77.7 | 31.34 | 13.37 | 2.86 |
| Score | None | 30 | 0.90 | 22.97 | 8.43 | 1.59 | |||
| Count | Depth | 30 | 0.90 | 6.40 | 1.25 | 0.15 | |||
| Score | Depth | 30 | 0.90 | 5.77 | 1.09 | 0.09 | |||
| Count | None | 40 | 0.90 | 27.2 / 26.0 | 25.5 / 24.6 | 53.9 / 70.2 | 12.09 | 3.38 | 0.42 |
| Score | None | 40 | 0.90 | 9.73 | 2.56 | 0.29 | |||
| Count | Depth | 40 | 0.90 | 5.62 | 1.08 | 0.07 | |||
| Score | Depth | 40 | 0.90 | 5.22 | 0.89 | 0.03 | |||
The results shown in the top half of Table I were computed from replicate case and control samples with variant sites having a minimum call rate of 1.00. Restricting the analysis to sites with complete data eliminated potential effects of missing data. Increasing the group mixing caused a decrease in the difference between the mean allele count, the mean allele score and the overall mean depth in the case and control samples, and a decrease in the percentage of replicates meeting each p-value threshold. The calculated differences in the overall mean depths between the case and control samples were 56.7, 46.0 and 38.4, for group mixing percentages of 20, 30 and 40, respectively. The case and control individuals differed by approximately 3, 2 and 1 allele count and 2.5, 1.5 and 1.0 allele score for mixing percentages of 20, 30 and 40%, respectively. Consistent with the results shown in Figure 1, higher mean depth was correlated with fewer minor alleles. Modeling the alleles as scores reduced the difference between the case and control samples but the effect was not large enough to eliminate the highly inflated false positive rate. When the logistic regression model did not include the depth variable, the p-values were highly biased away from the null expectations resulting in high false positive rates. The false positive rates decreased as the case and control groups became more similar with respect to mean depth, allele counts and scores. However, with 40% group mixing and high mean depth in both groups, two to three times the number of replicates expected to exceed the p-value thresholds under the null were observed. Including the mean depth variable in the logistic regression model eliminated much of the bias in the distribution of p-values and nearly corrected the false-positive problem. The degree to which the mean depth variable eliminates the confounding depends on the how different the case and control samples are with respect to the confounder. With mixing percentages of 30 and 40%, the p-value thresholds closely resemble the expectations under the null, while they remain somewhat inflated when the mixing percentage is only 20. The models that included the sum of the allele scores showed lower false positive rates than those that included the discrete allele counts variable. The most complete adjustment was observed with the multiple logistic regression model that included both the allele score and mean depth variables.
The results shown in the bottom half of Table I included variant sites with up to 10% missing data (minimum call rate = 0.90). Sampling the additional variants with missing data decreased the difference in the mean depth between the case and control groups from what was found when only complete data was included; however, the difference in the case and control individual allele counts and scores increased. The relationship between mean depth and alleles observed was weakened by the inclusion of variants with incomplete data. While the false positive rates should decrease as the mean depths of the comparison groups become more similar, the inclusion of incomplete data increased the case and control allele count and score differences, resulting in a marginally higher false positive rate when sites with missing data are included. While the call rate is positively correlated with depth and should be partially accounted for in the regression models with the mean depth variable, the call rate is strongly related to the total allele counts because it defines the total number of observations at a variant site. Including variant sites with missing data reduced the effectiveness of the statistical adjustment for the confounder, although significant correction for the bias was shown and the results closely resemble those for complete data.
Table II shows the results from the analysis of the simulated replicates using the rank test. The ranked test showed consistently higher false positive rates than the logistic regression method without correction, indicating that the ranked sum test is more powerful for detecting differences in the sum of the allele counts and allele scores between cases and controls in this context. The rank test of allele scores showed less bias in the p-value distribution than the test of the allele counts, although a considerable and unacceptable false-positive problem remained.
Table II.
Results from analysis of 10,000 replicates with confounding using rank test.
| Group Mixing (%) | Rank Test Results | ||||
|---|---|---|---|---|---|
| Allele Coding | Minimum Call Rate | P-value < 0.05 (%) | P-value < 0.01 (%) | P-value < 0.001 (%) | |
| Count | 20 | 1.00 | 70.34 | 45.52 | 19.66 |
| Score | 20 | 1.00 | 57.29 | 32.66 | 11.76 |
| Count | 30 | 1.00 | 43.91 | 20.25 | 5.48 |
| Score | 30 | 1.00 | 34.68 | 14.35 | 3.25 |
| Count | 40 | 1.00 | 18.85 | 5.68 | 1.04 |
| Score | 40 | 1.00 | 15.77 | 4.42 | 0.74 |
| Count | 20 | 0.90 | 70.62 | 46.45 | 19.92 |
| Score | 20 | 0.90 | 56.11 | 31.29 | 11.35 |
| Count | 30 | 0.90 | 44.27 | 20.81 | 6.22 |
| Score | 30 | 0.90 | 33.67 | 14.45 | 3.55 |
| Count | 40 | 0.90 | 19.84 | 6.45 | 1.31 |
| Score | 40 | 0.90 | 16.13 | 4.88 | 0.88 |
Table III shows the results for the logistic regression analysis of simulated samples with the mixing percentage fixed at 50%, resulting in case and control samples that were matched on their average sequencing depth. The results show a close fit to the expected uniform distribution of p-values under the null hypothesis of no association between rare variants and disease. When variants with up to 10% missing data are included the results show that the logistic regression model gives slightly conservative results.
Table III.
Results from analysis of 10,000 replicates without confounding using logistic regression.
| Logistic Regression Results | |||||
|---|---|---|---|---|---|
| Allele Coding | Confounder Adjustment | Minimum Call Rate | P-value < 0.05 (%) | P-value < 0.01 (%) | P-value < 0.001 (%) |
| Count | None | 1.00 | 5.01 | 0.92 | 0.05 |
| Count | Depth | 1.00 | 5.11 | 0.94 | 0.06 |
| Score | None | 1.00 | 5.17 | 0.91 | 0.03 |
| Score | Depth | 1.00 | 5.11 | 0.86 | 0.04 |
| Count | None | 0.90 | 4.74 | 0.78 | 0.04 |
| Count | Depth | 0.90 | 4.75 | 0.71 | 0.06 |
| Score | None | 0.90 | 4.72 | 0.76 | 0.04 |
| Score | Depth | 0.90 | 4.77 | 0.72 | 0.07 |
Discussion
Using genotypes from next-generation DNA sequence data for 90 CEPH samples generated in Pilot Study 3 of the 1000 Genomes Project, a negative relationship was found between the mean sequencing depth at a variant site and the number of minor alleles observed at the site. The number of alleles at the site decreased as the sequencing depth increased. The reason for the observed relationship was assumed to be an underlying negative correlation between the error rate and the sequencing depth. As sequencing depth increases, the probability that a genotype is miscalled as a heterozygote decreases. There are potentially important implications of this relationship in case-control association studies of rare alleles using next-generation sequencing. When case and control samples are sequenced separately or differentially among batches, the comparison groups are unlikely to be matched with respect to sequence depth. The case and control groups are likely to have significantly different depths across the sequenced regions and at the specific variant sites of interest. Therefore, sequence depth can be a confounder in case-control association studies and lead to false positive results, as demonstrated in this report using real data.
The confounding effect of sequencing depth was found when both the case and control comparison groups had substantially greater than 30X coverage (the minimum mean coverage depth was 39.1) and the negative relationship between the number of alleles and depth was present even when the coverage was relatively deep. The difference in the mean sequencing depth between the comparison groups was the primary determinant of the extent of confounding and false positive rate. This result suggests that the confounding problem will be particularly acute when coverage is relatively thin among one of the comparison groups and the difference between groups is large, such as if one were to use 1000 Genomes Project data as a control group to compare with deeply sequenced cases in an association study of rare alleles. The 1000 Genomes Project is sequencing human genomes at approximately 4X depth.
The current study assessed confounding due to depth in a sample of 100 cases and an equal number of controls with genotype data from 1000 variant sites. In practice, fewer than 1000 rare variant sites would more likely be included in a single statistical test and the magnitude of the confounding investigated here could be an exaggeration of what would be found in an investigation of a single genomic region. However, a subtle confounding effect should not be discounted. Weak statistical confounding due to population admixture has only a marginal influence on a case-control association test of a single SNP, however, in a genome-wide analysis of hundreds of thousands of SNPs, the weak confounding has a significant impact on the distribution of the association statistics. Weak confounding due to sequencing depth would likewise have a significant impact on the distribution of rare variant association tests in a genome-wide study; a study design that will soon be affordable.
Including a mean depth linear predictor of case-control status in a logistic regression model was shown to provide good statistical adjustment for the confounding effect of sequence depth. Furthermore, incorporating the uncertainty in the heterozygote genotype calls by modeling the probability of the call being correct had a relatively minor but beneficial impact on the results. The simple logistic regression model used to test for association with the cumulative sets of minor alleles fit the expectations under the null but showed less power than the rank test. More sophisticated regression models that use prior information to weight variant sites and define collapsing sets should increase power.
The current study demonstrated the confounding potential of sequence coverage depth in case-control association studies of low frequency and rare alleles. Fortunately, the coverage depth is measured and reported by all sequence analysis software, and a simple statistical test can assess whether or not the case and control samples differ with respect to the experimental variable. If a significant difference in the case and control sequence depth is found, the confounding effect of the variable can be accounted for by including the mean sequencing depth as a linear predictor in a regression model. Other approaches for adjusting or accounting for the confounding are possible and should be investigated.
Figure 2.


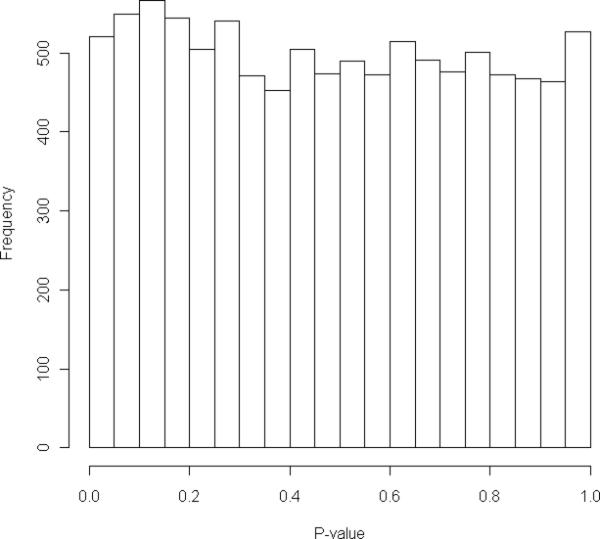
Distribution of p-values from logistic regression analysis of cumulative minor allele counts from 1000 variant sites in 100 case and control individuals. Distribution was generated from 10,000 replicates. Minimum call rate was 1.0 and group mixing percentage was 30%. Each replicates was analyzed by four logistic regression models included the following predictor variables: the sum of the allele counts (Figure 2a); the sum of the allele scores (Figure 2b); the sum of the allele counts and the mean sequence read depth (Figure 2c); and the sum of the allele scores and the mean sequence read depth (Figure 2d).
Acknowledgements
This work was supported by NIDDK/NIH grants R56DK089184 and R01DK081645 to CG.
References
- Balding DJ. A tutorial on statistical methods for population association studies. Nat Rev Genet. 2006;7(10):781–91. doi: 10.1038/nrg1916. [DOI] [PubMed] [Google Scholar]
- Bansal V, Libiger O, Torkamani A, Schork NJ. Statistical analysis strategies for association studies involving rare variants. Nat Rev Genet. 2010;11(11):773–85. doi: 10.1038/nrg2867. [DOI] [PMC free article] [PubMed] [Google Scholar]
- Bodmer W, Bonilla C. Common and rare variants in multifactorial susceptibility to common diseases. Nat Genet. 2008;40(6):695–701. doi: 10.1038/ng.f.136. [DOI] [PMC free article] [PubMed] [Google Scholar]
- Capanu M, Begg CB. Hierarchical Modeling for Estimating Relative Risks of Rare Genetic Variants: Properties of the Pseudo-Likelihood Method. Biometrics. 2010 doi: 10.1111/j.1541-0420.2010.01469.x. [DOI] [PMC free article] [PubMed] [Google Scholar]
- Consortium” TWTC-C Genome-wide association study of 14,000 cases of seven common diseases and 3,000 shared controls. Nature. 2007;447(7145):661–78. doi: 10.1038/nature05911. [DOI] [PMC free article] [PubMed] [Google Scholar]
- Durbin RM, Abecasis GR, Altshuler DL, Auton A, Brooks LD, Durbin RM, Gibbs RA, Hurles ME, McVean GA. A map of human genome variation from population-scale sequencing. Nature. 2010;467(7319):1061–73. doi: 10.1038/nature09534. [DOI] [PMC free article] [PubMed] [Google Scholar]
- Ewing B, Green P. Base-calling of automated sequencer traces using phred. II. Error probabilities. Genome Res. 1998;8(3):186–94. [PubMed] [Google Scholar]
- Garner C. The use of random controls in genetic association studies. Hum Hered. 2006;61(1):22–6. doi: 10.1159/000091833. [DOI] [PubMed] [Google Scholar]
- Garner C. A statistical method for scanning the genome for regions with rare disease alleles. Genet Epidemiol. 2010;34(5):386–95. doi: 10.1002/gepi.20483. [DOI] [PubMed] [Google Scholar]
- Guo W, Lin S. Generalized linear modeling with regularization for detecting common disease rare haplotype association. Genet Epidemiol. 2009;33(4):308–16. doi: 10.1002/gepi.20382. [DOI] [PMC free article] [PubMed] [Google Scholar]
- Han F, Pan W. A data-adaptive sum test for disease association with multiple common or rare variants. Hum Hered. 2010;70(1):42–54. doi: 10.1159/000288704. [DOI] [PMC free article] [PubMed] [Google Scholar]
- Hoggart CJ, Whittaker JC, De Iorio M, Balding DJ. Simultaneous analysis of all SNPs in genome-wide and re-sequencing association studies. PLoS Genet. 2008;4(7):e1000130. doi: 10.1371/journal.pgen.1000130. [DOI] [PMC free article] [PubMed] [Google Scholar]
- Leek JT, Scharpf RB, Bravo HC, Simcha D, Langmead B, Johnson WE, Geman D, Baggerly K, Irizarry RA. Tackling the widespread and critical impact of batch effects in high-throughput data. Nat Rev Genet. 2010;11(10):733–9. doi: 10.1038/nrg2825. [DOI] [PMC free article] [PubMed] [Google Scholar]
- Lehmann EL. Nonparametric Statistical Methods Based on Ranks. McGraw-Hill; New York: 1975. [Google Scholar]
- Li B, Leal SM. Methods for detecting associations with rare variants for common diseases: application to analysis of sequence data. Am J Hum Genet. 2008;83(3):311–21. doi: 10.1016/j.ajhg.2008.06.024. [DOI] [PMC free article] [PubMed] [Google Scholar]
- Li H, Durbin R. Fast and accurate short read alignment with Burrows-Wheeler transform. Bioinformatics. 2009;25(14):1754–60. doi: 10.1093/bioinformatics/btp324. [DOI] [PMC free article] [PubMed] [Google Scholar]
- Li H, Ruan J, Durbin R. Mapping short DNA sequencing reads and calling variants using mapping quality scores. Genome Res. 2008;18(11):1851–8. doi: 10.1101/gr.078212.108. [DOI] [PMC free article] [PubMed] [Google Scholar]
- Luan Y, Li H. Group additive regression models for genomic data analysis. Biostatistics. 2008;9(1):100–13. doi: 10.1093/biostatistics/kxm015. [DOI] [PubMed] [Google Scholar]
- Madsen BE, Browning SR. A groupwise association test for rare mutations using a weighted sum statistic. PLoS Genet. 2009;5(2):e1000384. doi: 10.1371/journal.pgen.1000384. [DOI] [PMC free article] [PubMed] [Google Scholar]
- Malo N, Libiger O, Schork NJ. Accommodating linkage disequilibrium in genetic-association analyses via ridge regression. Am J Hum Genet. 2008;82(2):375–85. doi: 10.1016/j.ajhg.2007.10.012. [DOI] [PMC free article] [PubMed] [Google Scholar]
- Manolio TA, Collins FS, Cox NJ, Goldstein DB, Hindorff LA, Hunter DJ, McCarthy MI, Ramos EM, Cardon LR, Chakravarti A. Finding the missing heritability of complex diseases. Nature. 2009;461(7265):747–53. doi: 10.1038/nature08494. others. [DOI] [PMC free article] [PubMed] [Google Scholar]
- McKenna A, Hanna M, Banks E, Sivachenko A, Cibulskis K, Kernytsky A, Garimella K, Altshuler D, Gabriel S, Daly M. The Genome Analysis Toolkit: a MapReduce framework for analyzing next-generation DNA sequencing data. Genome Res. 2010;20(9):1297–303. doi: 10.1101/gr.107524.110. others. [DOI] [PMC free article] [PubMed] [Google Scholar]
- Metzker ML. Sequencing technologies - the next generation. Nat Rev Genet. 2010;11(1):31–46. doi: 10.1038/nrg2626. [DOI] [PubMed] [Google Scholar]
- Morgenthaler S, Thilly WG. A strategy to discover genes that carry multi-allelic or mono-allelic risk for common diseases: a cohort allelic sums test (CAST). Mutat Res. 2007;615(1-2):28–56. doi: 10.1016/j.mrfmmm.2006.09.003. [DOI] [PubMed] [Google Scholar]
- Morris AP, Zeggini E. An evaluation of statistical approaches to rare variant analysis in genetic association studies. Genet Epidemiol. 2010;34(2):188–93. doi: 10.1002/gepi.20450. [DOI] [PMC free article] [PubMed] [Google Scholar]
- Ng SB, Buckingham KJ, Lee C, Bigham AW, Tabor HK, Dent KM, Huff CD, Shannon PT, Jabs EW, Nickerson DA. Exome sequencing identifies the cause of a mendelian disorder. Nat Genet. 2010;42(1):30–5. doi: 10.1038/ng.499. others. [DOI] [PMC free article] [PubMed] [Google Scholar]
- Price AL, Kryukov GV, de Bakker PI, Purcell SM, Staples J, Wei LJ, Sunyaev SR. Pooled association tests for rare variants in exon-resequencing studies. Am J Hum Genet. 2010;86(6):832–8. doi: 10.1016/j.ajhg.2010.04.005. [DOI] [PMC free article] [PubMed] [Google Scholar]
- Roach JC, Glusman G, Smit AF, Huff CD, Hubley R, Shannon PT, Rowen L, Pant KP, Goodman N, Bamshad M. Analysis of genetic inheritance in a family quartet by whole-genome sequencing. Science. 2010;328(5978):636–9. doi: 10.1126/science.1186802. others. [DOI] [PMC free article] [PubMed] [Google Scholar]
- Xiong M, Zhao J, Boerwinkle E. Generalized T2 test for genome association studies. Am J Hum Genet. 2002;70(5):1257–68. doi: 10.1086/340392. [DOI] [PMC free article] [PubMed] [Google Scholar]
- Zhou H, Sehl ME, Sinsheimer JS, Lange K. Association screening of common and rare genetic variants by penalized regression. Bioinformatics. 2010;26(19):2375–82. doi: 10.1093/bioinformatics/btq448. [DOI] [PMC free article] [PubMed] [Google Scholar]
- Zhuang JJ, Zondervan K, Nyberg F, Harbron C, Jawaid A, Cardon LR, Barratt BJ, Morris AP. Optimizing the power of genome-wide association studies by using publicly available reference samples to expand the control group. Genet Epidemiol. 2010;34(4):319–26. doi: 10.1002/gepi.20482. [DOI] [PMC free article] [PubMed] [Google Scholar]