Abstract
Aim
Skeletal muscle interleukin-6 (IL-6) expression is induced by continuous contraction, overload-induced hypertrophy and during muscle regeneration. The loss of IL-6 can alter skeletal muscle’s growth and extracellular matrix remodeling response to overload-induced hypertrophy. IGF-1 gene expression and related signaling through Akt/mTOR is a critical regulator of muscle mass. The significance of IL-6 expression during the recovery from muscle atrophy is unclear. This study’s purpose was to determine the effect of IL-6 loss on mouse gastrocnemius (GAS) muscle mass during recovery from hindlimb suspension (HS)-induced atrophy.
Methods
Female C57BL/6 (WT) and IL-6 knockout (IL-6 KO) mice at 10 wks of age were assigned to control, HS, or HS followed by normal cage ambulation groups.
Results
GAS muscle atrophy was induced by 10 days of HS. HS induced a 20% loss of GAS mass in both WT and IL-6 KOmice. HS+7 days of recovery restored WT GAS mass to cage control values. GAS mass from IL-6 KO mice did not return to cage control values until HS+14 days of recovery. Both IGF-1 mRNA expression and Akt/mTOR signaling were increased in WT muscle after 1 day of recovery. In IL-6 KO muscle, IGF-1 mRNA expression was decreased and Akt/mTOR signaling was not induced after one day of recovery. MyoD and myogenin mRNA expression were both induced in WT muscle after 1 day of recovery, but not in IL-6 KO muscle.
Conclusion
Muscle IL-6 expression appears important for the initial growth response during the recovery from disuse.
Keywords: inflammation, myogenesis, muscle regeneration, hypertrophy, IGF-1, mTOR, Stat3
Introduction
Injury, sickness, and bed rest can all result in weight bearing muscles undergoing disuse. Skeletal muscle mass regulation is dramatically impacted by these periods of disuse. As little as 7 to 10 days of hindlimb suspension-induced muscle disuse causes a 25% or greater mass loss of hindlimb weight bearing muscle mass in mice and rats (McClung et al., 2006, Mitchell and Pavlath, 2001). There is a rapid decrease in myofiber cross sectional area, and corresponding reduction in muscle protein synthesis (Fitts et al., 2000). Healthy muscle rapidly recovers mass and myofiber cross sectional area upon the resumption of regular weight-bearing activity (Itai et al., 2004, Mitchell and Pavlath, 2001, van der Velden et al., 2007, McClung et al., 2006). The resumption of muscle loading induces damage and the activation of local inflammatory signaling (Kasper, 1995, McClung et al., 2007). Myofiber sarcolemma disruption and increased circulating creatine kinase have been reported during muscle reloading after disuse (Kasper, 1995, McClung et al., 2007). Anabolic processes related to protein accretion during mass recovery involve the sequential activation of myogenic gene expression, growth factor gene expression, extracellular matrix (ECM) remodeling, and growth factor signaling, (Bondesen et al., 2006, van der Velden et al., 2006, Mitchell and Pavlath, 2001, Fluck et al., 2003). As previously investigated in hypertrophying muscle, inflammatory and anabolic signaling pathways are likely integrated during the recovery from muscle disuse. The disruption of the inflammatory response has been shown to be detrimental to muscle mass recovery after injury (Bondesen et al., 2006, Bondesen et al., 2004).
IL-6 is a multifaceted signaling molecule classified as a pro-inflammatory cytokine. IL-6 is produced by a variety of cell types such as monocytes, fibroblasts, vascular endothelial cells, and skeletal muscle fibers (Akira et al., 1993, Jonsdottir et al., 2000). Chronically elevated levels of circulating IL-6 are associated with several pathophysiological conditions such as cachexia and insulin resistance (Baltgalvis et al., 2008a, Kern et al., 2001, Baltgalvis et al., 2008b). Muscle contraction acutely increases circulating IL-6 (Febbraio and Pedersen, 2002) and functional overload increases muscle IL-6 gene expression (Carson et al., 2002). Muscle IL-6 expression is also increased during recovery from disuse atrophy (Childs et al., 2003). The homozygous IL-6 knockout mouse has been used to study various disease states as well as adaptations to various stimuli. IL-6 knockout mice have an impaired acute-phase immune response and have been shown to develop type II diabetes after 9 months of age (Kopf et al., 1994, Wallenius et al., 2002). This observation has been used to demonstrate the role of IL-6 in glucose homeostasis. The temporal regulation of IL-6 expression is of paramount importance to its actions in muscle. Chronic IL-6 administration directly to skeletal muscle induces atrophy (Haddad et al., 2004) and transgenic mice over-expressing IL-6 at high levels in all tissues and having high circulating levels also demonstrate muscle atrophy (Tsujinaka et al., 1995). IL-6 is also a muscle mitogen that can activate cell proliferation in skeletal muscle (Cantini et al., 1995), including satellite cells (Hawke and Garry, 2001). Although the effect of IL-6 loss on overload-induced myofiber growth is equivocal (Serrano et al., 2008, White et al., 2009b), there is strong evidence that IL-6 loss impairs satellite cell activation and extracellular matrix remodeling.
Muscle growth is associated with the induction of myogenic regulatory factors and insulin-like growth factor-1 (IGF-1) (Adams and Haddad, 1996, McClung et al., 2005). MyoD and myogenin are myogenic regulatory factors that transcriptionally regulate myoblast proliferation and differentiation. These myogenic factors homodimerize or heterodimerize with other basic helix-loop-helix (bHLH) proteins and bind to a consensus E-box sequence in the promoter region of muscle regulatory genes (Lluis et al., 2006). The induction of MyoD and myogenin expression are initial events during the recovery from disuse-induced atrophy (Mitchell and Pavlath, 2001). In IL-6 knockout mice, the overload-induced increase in MyoD expression was ablated (White et al., 2009b). Cyclin D1 is a regulator of the mitotic process in many cell types and is induced early during growth of skeletal muscle (Dapp et al., 2004). In regenerating skeletal muscle damaged by toxin injection, the induction of cyclin D1 is thought to be mainly in proliferating satellite cells (Yan et al., 2003). A critical regulator of muscle growth is the autocrine/paracrine expression and secretion of IGF-1 (Adams and Haddad, 1996, van der Velden et al., 2007). IGF-1 is an anabolic growth factor that is induced in overloaded and regenerating muscle (Adams and Haddad, 1996, van der Velden et al., 2007, White et al., 2009a), and over-expression in muscle is sufficient to stimulate hypertrophy (Semsarian et al., 1999). Furthermore, recovery from disuse increases IGF-1 expression and related signaling through Akt/mTOR (Childs et al., 2003, Sugiura et al., 2005, van der Velden et al., 2007).
The ECM plays an important role during skeletal muscle growth. The ECM is a dynamic tissue that can adapt to alter loading patterns and is the functional link between skeletal muscle and bone. The ECM acts as a scaffold for other proteins as well as a reservoir of growth factors and cytokines. The ECM is composed primarily of collagens and proteoglycans (Kjaer, 2004). Acute damaging-exercise increases collagen I and III gene expression and their biosynthesis (Han et al., 1999). Limb immobilization decreases collagen I and III gene expression in the rat gastrocnemius (Ahtikoski et al., 2001) and human skeletal muscle (Urso et al., 2006). Increased loading also regulates collagen expression. Increased mechanical load increases collagen synthesis (Laurent et al., 1985). In addition, reloading following hindlimb suspension upregulated tenascin-C and fibronectin (Fluck et al., 2003). The regulation of fibrosis is imperative for a normal growth response. Li et al. demonstrated that increased fibrotic proteins were associated with inhibition of myogenic proteins in C2C12 cells (Li et al., 2004). Although cytokines have been established as critical regulators of the ECM, IL-6’s effect on ECM remodeling during recovery from disuse-induced atrophy has not been established.
As with overload-induced hypertrophy, muscle IL-6 expression is potentially important for muscle mass recovery from disuse atrophy. The purpose of this study was to determine if IL-6 expression was necessary for successful muscle mass accretion during the recovery from disuse-induced atrophy. We hypothesized that mice lacking IL-6 would have attenuated recovery of gastrocnemius muscle mass that was related to the initial suppression of muscle IGF-1 expression and associated Akt/mTOR activation. Additionally, MyoD, myogenin and markers of extracellular matrix remodeling were examined during muscle recovery from atrophy, since these factors had previously been shown to be regulated by IL-6 during overload-induced muscle growth.
Methods
Animals
Female C57BL/6 (WT) and C57BL/6 × IL-6−/− (IL-6 KO) mice at approximately 10-weeks old were acquired from a breeding colony at the animal resources facility at the University of South Carolina. Animals were housed individually, kept on a 12:12-h light-dark cycle, and given ad libitum access to normal rodent chow and water for the duration of the study at the fully accredited animal care facilities at the University of South Carolina, Columbia. Mice were randomly assigned to hindlimb suspension for 10 days with 4 different periods of recovery (0 days, 1 day, 7 day, 14 days, n = 4–6 per group), or cage control mice. All procedures were approved by the University of South Carolina Animal Care and Use Committee.
Hindlimb Suspension & Recovery
Skeletal muscle disuse was induced by hindlimb suspension as previously described (Washington et al., 2004). Mice were subjected to 10 days of hindlimb suspension. Briefly, tails from unanesthetized animals were cleansed with alcohol, covered with a light coat of benzoin tincture and dried until tacky. Strips of elastoplast (Biersdorf, Norwalk, CT) adhesive bandage were applied to the proximal 2/3rds of all sides of the tail and looped through a swivel attachment mounted above the cage that was designed to allow 360° rotational movement with only the forelimbs able to come into contact with the cage floor. After 10 days of hindlimb suspension, mice were subjected to one of 4 recovery groups: 0 days of recovery, 1 day of recovery, 7 days of recovery, or 14 days of recovery. Recovery consisted of normal ambulation in their cage. There was also a cage control group that did not undergo hindlimb suspension. Body weights were recorded initially and at the day of the sacrifice.
Muscle extraction
Mice were anesthetized with an intramuscular injection of ketamine hydrochloride (90mg/kg body weight), xylazine (7mg/kg body weight), and acepromazine (1mg/kg body weight). The gastrocnemius muscles were excised at the specified times. The left gastrocnemius was embedded in OCT for morphological analysis and the right muscle snap frozen in liquid nitrogen and stored at −80°C for gene and protein expression analysis.
Circulating creatine kinase levels
Serum creatine kinase levels were determined as previously described (McClung et al., 2007). Serum was taken from the inferior vena cava at the time of sacrifice. Serum was assayed spectrophotometrically at a wavelength of 340 nm for creatine kinase activity using a commercially available kit (Diagnostic Chemicals Limited, Oxford CT) according to manufacturer’s instructions.
Total RNA isolation and cDNA synthesis
RNA was extracted with Trizol reagent (Life Technologies, Grand Island, NY) as previously described (Washington et al., 2004). Briefly, gastrocnemius muscles were homogenized in Trizol. Total RNA was isolated, DNase treated, and concentration and purity was determined by UV spectrophotometry. RNA with a 260/280 ratio of≥ 1.6 was used for cDNA synthesis. cDNA was reverse transcribed from 3μg of total RNA with 1μl of random hexamers and 50 units of Superscript III RT (Invitrogen) in a final volume of 20μl at 25°C for 10 min, followed by 42°C for 50 min, and 70°C for 10 min.
Real-time Polymerase Chain Reaction
Real-time PCR was performed, and results were analyzed by using the ABI 7300 thermocycler Real-Time detection system (Sequence Detection Systems, model 7300;Applied Biosystems, Foster City, CA, USA). cDNA was amplified in a 25μl reaction containing appropriate primer pairs and ABI SYBR Green or TaqMan Universal Mastermix (Applied Biosystems, FosterCity, CA, USA). Samples were incubated at 95°C for 4 min, followed by 40 cycles of denaturation, annealing, and extension at 95°C, 55°C, and 72°C, respectively. SYBR Green or TaqMan fluorescence was measured at the end of the extension step each cycle. Fluorescence labeled probes for MyoD (FAM dye), myogenin (FAM dye), cyclin D1 (FAM dye), IL-6 (FAM dye), procollagen I (FAM dye), procollagen III (FAM dye), fibronectin (FAM dye), and the ribosomal RNA 18s (VIC dye) were purchasedfrom Applied Biosystems and quantified with TaqMan Universal mastermix. Insulin like growth factor-1 (IGF-1) primersequence was synthesized by Integrated DNA Technologies (IDT)(Caralville, IA, USA) and quantified with SYBR Green mastermix. The primer sequencesfor IGF-1 were: forward, 5′-TGGATGCTCTTCAGTTCGTG-3′; reverse,5′-GTCTTGGGCATGTCAGTGTG-3′. Cycle threshold (Ct) was determined, and the ΔCt value calculated as the difference between the Ct value and the 18s Ct value. Final quantification of gene expression was calculated using the ΔΔCT method {Ct = [ΔCt(calibrator) – ΔCt(sample)]. Relative quantification was then calculated as 2−ΔΔCt. Melt curve analysis was performed at the end of the PCR run to verify no primer dimers were formed.
Western blotting
Western blot analysis was performed as previously described (White et al., 2009a). Briefly, frozen gastrocnemius muscle was homogenized in Mueller buffer and protein concentration determined by the Bradford method (Bradford, 1976). Crude muscle homogenate 30 μg was fractionated on 6%-10% SDS-polyacrylamide gels. Gels were transferred to polyvinylidene difluoride (PVDF) membranes overnight. Membranes were Ponceau stained to verify equal loading of each gel. Membranes were blocked overnight in 5% milk in Tris-buffered saline with 0.1% Tween-20 (TBS-T). Primary antibodies for p-Akt (ser473), Akt, p-mTOR, mTOR, p-S6K, S6K, p-Stat3, Stat3 (Cell signaling) and cyclinD1(Santa Cruz) were diluted 1:1000 to 1:500 in 5% Milk in TBS-T followed by 1 hour incubation with membranes at room temperature. Anti-rabbit or mouse IgG horseradish-peroxidase conjugated secondary antibodies (Cell Signaling) were incubated with the membranes at 1:2000 dilutions for 1 hour in 5% milk in TBS-T. Enhanced chemiluminescence (ECL) (GE Healthcare Life Sciences, Piscataway, NJ) was used to visualize the antibody-antigen interactions. Images were digitally scanned and blots were quantified by densitometry using scientific imaging software (Scion Image, Frederick, MD).
Morphological Analysis
Myofiber cross sectional area analysis and percentage non-contractile tissue were determined as previously described (McClung et al., 2006). Eight distinct digital images from hematoxylin and eosin stained muscle sections (10μm) from the mid-belly of the gastrocnemius muscle at a 40X magnification were taken and analyzed for fiber cross-sectional area using NIH imaging software (Image J). Each fiber was traced with a handheld mouse and the number of pixels traced was calibrated to a defined area in μm2. The researcher, blinded to the treatment groups, traced approximately 150 fibers per sample. All fibers in the cross-section images were quantified unless the sarcolemma was not intact.
Statistical Analysis
The experimental design of the present study had cage-control mice for each recovery day. Each mouse represented an independent observation. For muscle mass, a two-way ANOVA (genotype X treatment) was used to compare WT and IL-6−/−responses to hindlimb suspension. Then, a two-way ANOVA (recovery day X strain) was run using the group at the end of the 10 days of hindlimb suspension as the baseline group to compare the response of WT and IL-6−/− muscle during recovery from hindlimb-induced atrophy. Circulating creatine kinase, muscle fiber mean cross sectional area, MyoD, myogenin, and cyclinD1 gene expression data were analyzed with a two-way ANOVA (strain X treatment). Data are reported as means ± SE. Chi-square analysis was used to determine shifts in gastrocnemius fiber frequency distribution. Statistical significance level was set at p ≤ 0.05.
Results
Skeletal muscle wet weight
Hindlimb suspension decreased gastrocnemius wet weight approximately 25% in both wild-type and IL-6 KO mice (Table 1). Muscle mass was corrected for tibia length (mm) to account for differences in body size. Muscle weight/tibia length returned to control values by day 7 in wild-type mice, but remained depressed in the IL-6 KO mice. By day 14 of reloading the muscle/tibia length ratio in IL-6 KO mice returned to control values.
Table 1.
Gastrocnemius muscle wet weight, muscle weight relative to tibia length, in hindlimb suspended and recovering wild-type and IL-6 KO mice. Skeletal muscle disuse was accomplished by hindlimb suspension.
| Treatment | Muscle Wet wt (mg) | Tibia (mm) | Muscle/tibia length (mg/mm) |
|---|---|---|---|
| WT | |||
| Con | 96.8 ± 4.7 | 15.9 ± 0.2 | 5.7 ± 0.1 |
| Sus + 0d | 70.1 ± 4.1& | 15.2 ± 0.3 | 4.5 ± 0.2& |
| Sus + 1d | 90.8 ± 2.7a | 16.2 ± 0.1 | 5.7 ± 0.2a |
| Sus + 7d | 97.0 ± 4.3a | 16.1 ± 0.2 | 5.9 ± 0.2a |
| IL-6 KO | |||
| Con | 93.5 ± 2.6 | 16.2 ± 0.1 | 5.7 ± 0.2 |
| Sus + 0 d | 74.6 ± 2.4& | 16.5 ± 0.1 | 4.6 ± 0.2& |
| Sus + 1d | 66.1 ± 4.3b,c | 14.6 ± 0.5 | 4.4 ± 0.2 b,c |
| Sus + 7d | 81.5 ± 1.6d | 15.9 ± 0.1 | 5.1 ± 0.1a,d |
Values are means ± SE, n=4–8 per group.
main effect of suspension (p < 0.05).
significantly different from same genotype 10d+0 (p < 0.05).
significantly different from WT 10d+1 (p < 0.05).
significantly different from same genotype 10d+7 (p < 0.05).
significantly different from WT 10d+7 (p < 0.05). WT, wild-type.
Gastrocnemius fiber cross-sectional area
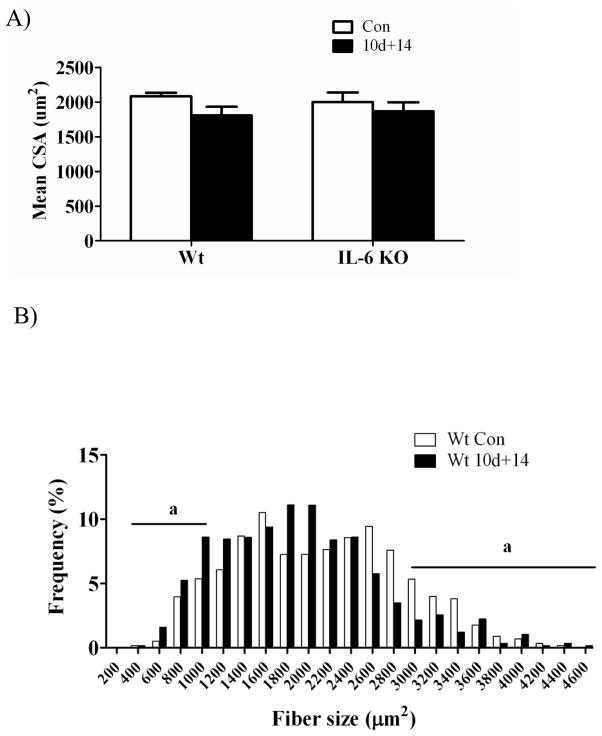
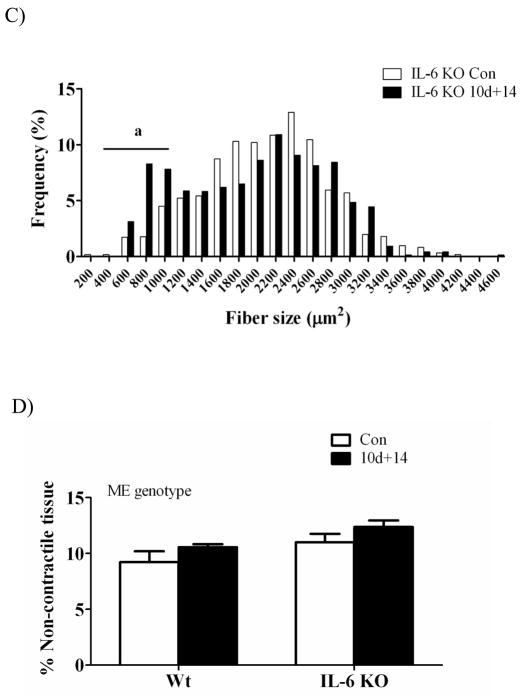
By 14 days of recovery from disuse, the mean cross-sectional area of gastrocnemius muscle fibers was not different in wild-type or IL-6 KO mice, when compared to their cage controls (Figure 1A). The distribution of myofiber cross-sectional area within a muscle can provide valuable information beyond the mean area alone. No baseline difference between wild-type and IL-6 KO mice were found in the incidence of small (< 1200 μm2) fibers, but wild-type mice had a greater incidence of large (> 3000 μm2) fibers. At 14 days of recovery, small fiber incidence increased 63% in wild-type muscle and 133% in IL-6 KO muscle (Figure 1B, 1C). At 14 days of recovery, wild-type muscle large fiber incidence decreased 38%, while IL-6 KO mice had no difference in the incidence of large fibers incidence. Differences in large fiber incidence after 14 days of recovery between wild-type and IL-6 KO mice may be related to the cage control wild-type mice having a higher percentage of large diameter fibers, when compared to IL-6 KO cage controls. Mice lacking IL-6 are able to recover muscle mass and fiber cross-sectional area after 14 days of recovery, despite an initial attenuation of growth.
Figure 1.
Myofiber cross sectional area, fiber distribution, and % non-contractile tissue in gastrocnemius muscle after 2 weeks of recovery from disuse in wild-type mice and IL-6 KO mice. A) Mean myofiber cross sectional area. B) The effect of 14 days of reloading following 10 days of hindlimb suspension on gastrocnemius myofiber size distribution in wild-type mice. C) The effect of 14 days of reloading following 10 days of hindlimb suspension on gastrocnemius myofiber size distribution in IL-6 KO mice. D) The effect of 14 days of reloading following 10 days of hindlimb suspension on % of non-contractile tissue. Values are means ± SE, n= 4–8 per group. a, significant difference in the % of small and/or large fibers. ME, main effect.
Noncontractile tissue
The volume percent of noncontractile tissue was determined from histological cross-sections of gastrocnemius muscle taken at the mid-belly after 14 days of reloading following 10 days of hindlimb suspension (Figure 1D). There was a main effect for IL-6 KO muscle to have a higher percentage of noncontractile tissue regardless of loading. There was a trend (p = 0.07) for 14 days of reloading to increase the percentage of noncontractile tissue in muscle across both wild-type and IL-6 KO mice.
Circulating creatine kinase
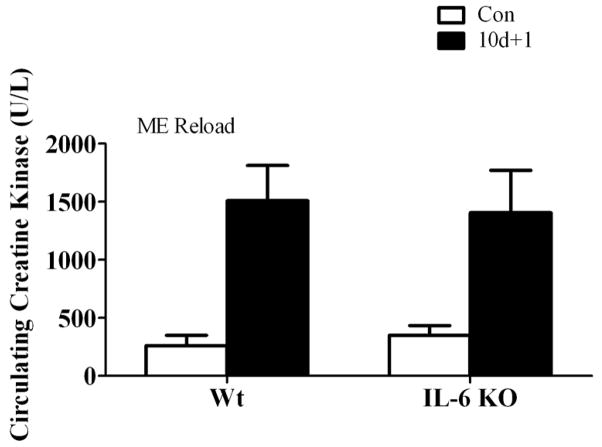
Disruption of the muscle fiber sarcolemma allows the release of creatine kinase from the cell’s cytoplasm to into the circulation. Circulating creatine kinase activity is an indicator of skeletal muscle damage. Reloading previously atrophied muscle has been demonstrated to induce damage to myofibers (McClung et al., 2007, Kasper, 1995). There was a main effect of muscle reloading to increase circulating creatine kinase levels. One day of recovery induced a 6-fold increase in creatine kinase activity in both wild-type and IL-6 KO mice (Figure 2). The induction of circulating creatine kinase activity demonstrates both wild-type and IL-6 KO mice had approximately similar levels of initial damage upon resumption of normal ambulation after disuse.
Figure 2.
The effect of recovery day following disuse-induced atrophy on skeletal muscle damage. The effect of 1 day of reloading following 10 days of disuse-induced atrophy on circulating creatine kinase activity. Circulating creatine kinase activity is expressed as Units per liter (U/L). Values are means ± SE, n = 3–8 per group. ME, main effect.
Gastrocnemius mRNA and protein expression during recovery from disuse
Interleukin-6 and STAT 3 activation
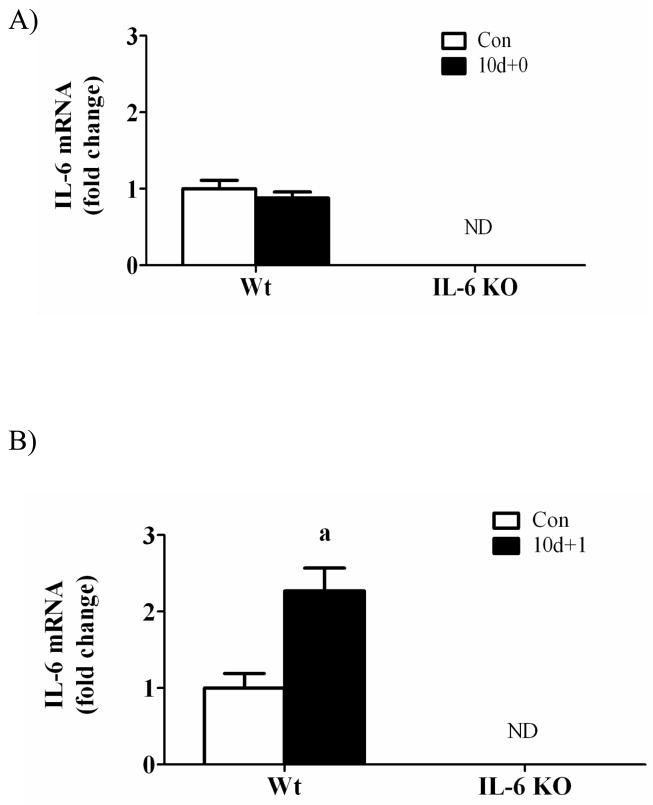
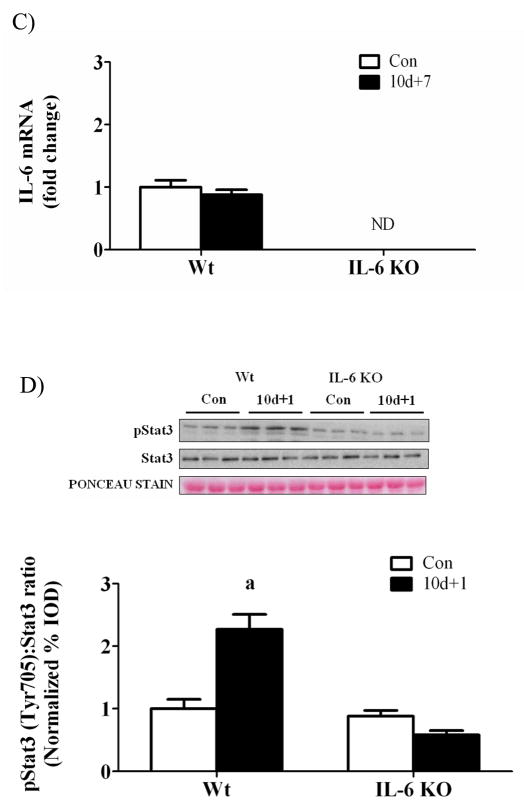
There was no detectable IL-6 mRNA expression in IL-6 KO mice (Figure 3). Hindlimb suspension did not alter muscle IL-6 gene expression in either wild-type or IL-6 KO mice (Figure 3A). One day of recovery from disuse induced wild-type muscle IL-6 mRNA expression approximately 2-fold (Figure 3B) and IL-6 gene expression returned to cage control levels following 7 days of recovery (Figure 3C). The induction in IL-6 mRNA after 1 day of recovery was associated with a greater than 2-fold increase in STAT3 phosphorylation in wild-type muscle, which was not present in IL-6 KO muscle after 1 day of recovery (Figure 3D).
Figure 3.
IL-6 signaling during 0, 1, and 7 days of reloading following 10 days of hindlimb suspension in wild-type and IL-6 KO mice. A) The effect of 10 days of hindlimb suspension on IL-6 mRNA abundance in the gastrocnemius muscle. B) The effect of 1 day of reloading following 10 days of hindlimb suspension on IL-6 mRNA abundance in the gastrocnemius muscle. C) The effect of 7 days of reloading following 10 days of hindlimb suspension on IL-6 mRNA abundance in the gastrocnemius muscle. D). Upper representative western blot of phospho and total forms of Stat3. Lower The ratio of phospho and total Stat3. Values are means ± SE, n = 4–6 per group. a, significantly different from same genotype control. ND, not detectable.
Insulin-like growth factor-1 and associated signaling
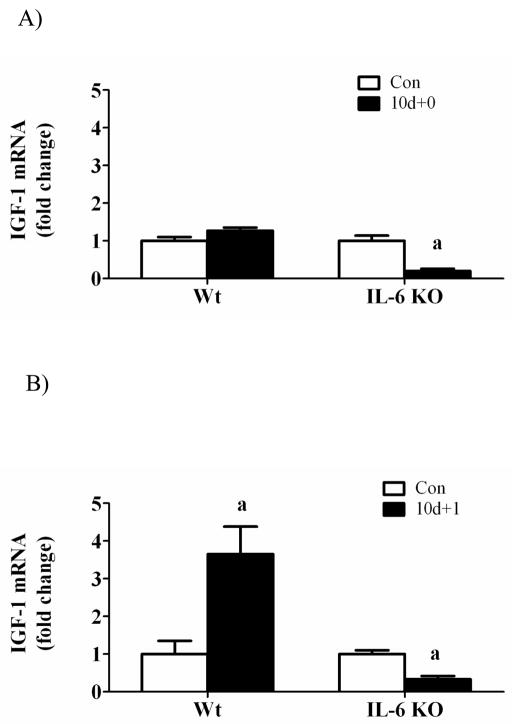
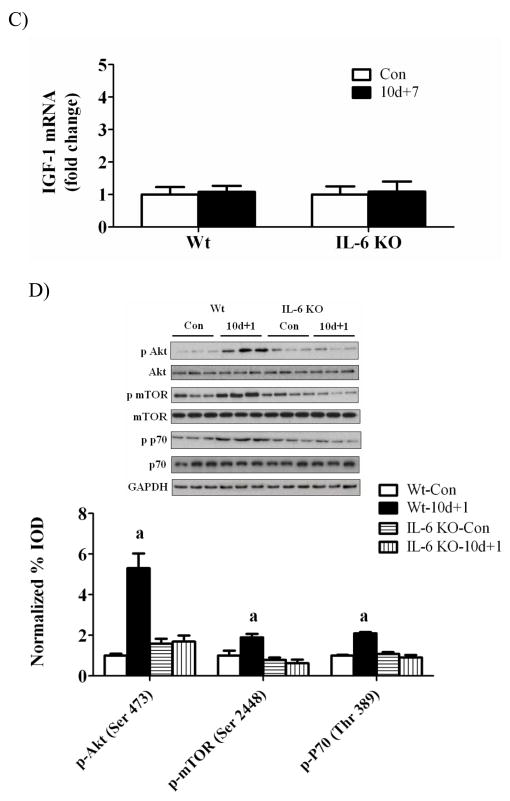
While hindlimb suspension did not alter muscle IGF-1 gene expression in wild-type mice, muscle IGF-1 mRNA was decreased 80% in IL-6 KO mice (Figure 4A). One day of recovery significantly induced wild-type muscle IGF-1 mRNA 4-fold (Figure 4B) which was associated with a 2-fold, 5-fold, and 2-fold increase in Akt, mTOR, and p70 phosphorylation, respectively (Figure 4D). The activation of IGF-1/Akt signaling after 1 day of recovery was not present in IL-6 KO muscle (Figure 4D). IGF-1 mRNA returned to control values by 7 days of reloading in both wild-type and IL-6 KO mice (Figure 4C). These data demonstrate that both muscle IGF-1 gene expression and associated Akt/mTOR activation are differentially regulated by IL-6 availability during the initial stages of recovery from disuse.
Figure 4.
IGF-1 signaling during 0, 1, and 7 days of reloading following 10 days of hindlimb suspension in WT and IL-6 KO mice. A) The effect of 10 days of hindlimb suspension on IGF-1 mRNA abundance in the gastrocnemius muscle. B) The effect of 1 day of reloading following 10 days of hindlimb suspension on IGF-1 mRNA abundance in the gastrocnemius muscle. C) The effect of 7 days of reloading following 10 days of hindlimb suspension on IGF-1 mRNA abundance in the gastrocnemius muscle. D). Upper representative western blot of phospho and total forms of Akt, mTOR, and p70. Lower The ratio of phospho and total Akt, mTOR and p70 after 1 day of reloading. Values are means ± SE, n = 4–6 per group. a, significantly different from same genotype control.
Myogenic regulatory factor gene expression
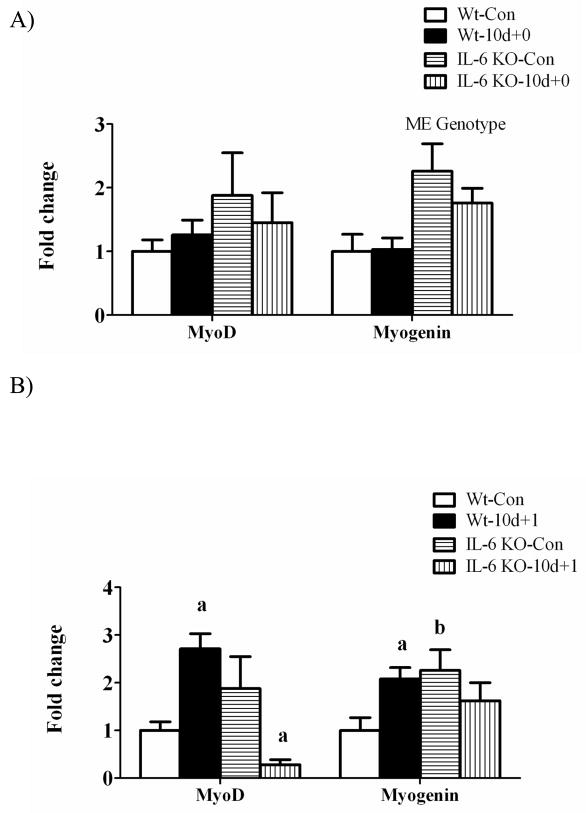
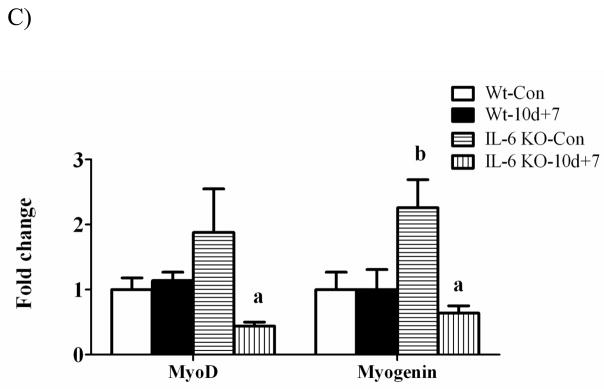
There was a main effect for muscle myogenin mRNA expression to be greater in IL-6 KO muscle than wild-type muscle, regardless of loading conditions (Figure 5A). Hindlimb suspension did not alter MyoD and myogenin mRNA expression in either wild-type or IL-6 KO muscle (Figure 5A). MyoD and myogenin mRNA increased 3-fold and 2-fold, respectively following 1 day of recovery (Figure 5B) and returned to cage control levels following 7 days of recovery (Figure 5C) in wild-type muscle. In IL-6 KO muscle, MyoD and myogenin mRNA expression was not induced following 1 day of recovery (Figure 5B). In fact, MyoD mRNA expression was reduced following 1 day of recovery and remained depressed following 7 days of recovery (Figure 5C). Myogenin mRNA expression was suppressed following 7 days of recovery in IL-6 KO muscle (Figure 5C).
Figure 5.
The effect of reloading on myogenic regulatory factors in the gastrocnemius muscle of wild-type and IL-6 KO. A) The effect of 10 days of hindlimb suspension on MyoD and myogenin mRNA abundance in the gastrocnemius muscle. B) The effect of 1 day of reloading following 10 days of hindlimb suspension on MyoD and myogenin mRNA abundance in the gastrocnemius muscle. C) The effect of 7 days of reloading following 10 days of hindlimb suspension on MyoD and myogenin mRNA abundance in the gastrocnemius muscle. Values are means ± SE, n = 4–6 per group. a, significantly different from same genotype control. b, significantly different from wild-type control group. ME, main effect.
Cyclin D1
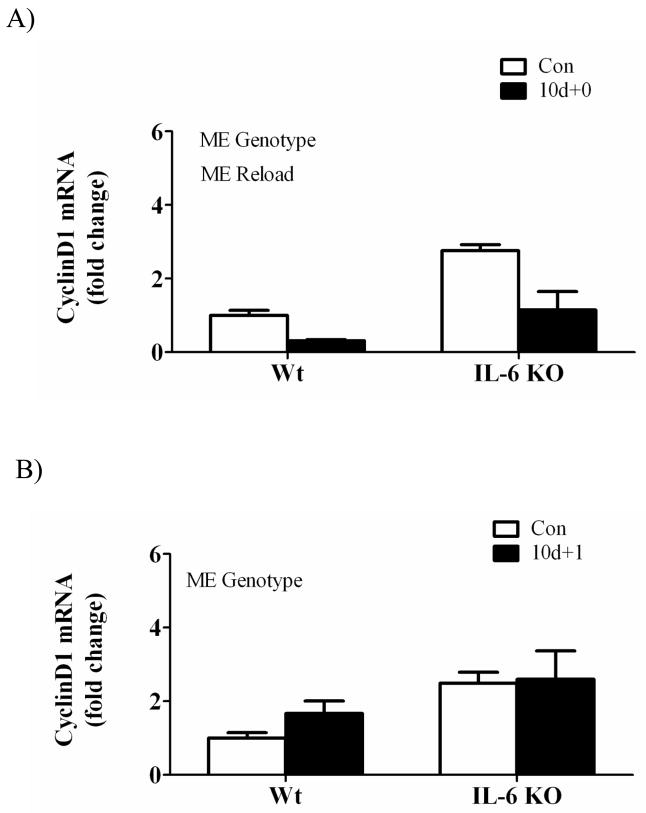
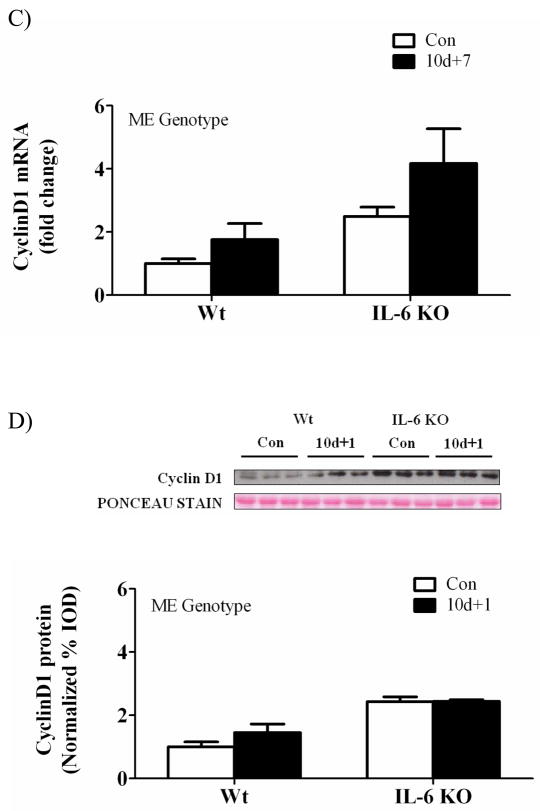
There was a main effect for hindlimb suspension to decrease muscle cyclin D1 mRNA expression across both wild-type and IL-6 KO mice (Figure 6A). Cyclin D1 mRNA was not significantly induced at any time point of recovery in either wild-type or IL-6 KO mice. There was a main effect for IL-6 KO muscle to have increased cyclin D1 mRNA expression when compared to wild-type muscle at both 1 and 7 days of recovery (Figure 6B&C). Cyclin D1 protein expression at 1 day of recovery demonstrated a main effect of IL-6 KO muscle to increase cyclin D1 expression, but did not result in a significant interaction (Figure 6D).
Figure 6.
The effect of reloading on cyclin D1 in the gastrocnemius muscle of wild-type and IL-6 KO. A) The effect of 10 days of hindlimb suspension on cyclin D1 mRNA abundance in the gastrocnemius muscle. B) The effect of 1 day of reloading following 10 days of hindlimb suspension on cyclin D1 mRNA abundance in the gastrocnemius muscle. C) The effect of 7 days of reloading following 10 days of hindlimb suspension on cyclin D1 mRNA abundance in the gastrocnemius muscle. D). Upper representative western blot of cyclinD1 protein. Lower Quantified cyclinD1 protein expression after 1 day of reloading. Values are means ± SE, n = 4–6 per group. ME, main effect.
Extracellular matrix gene expression
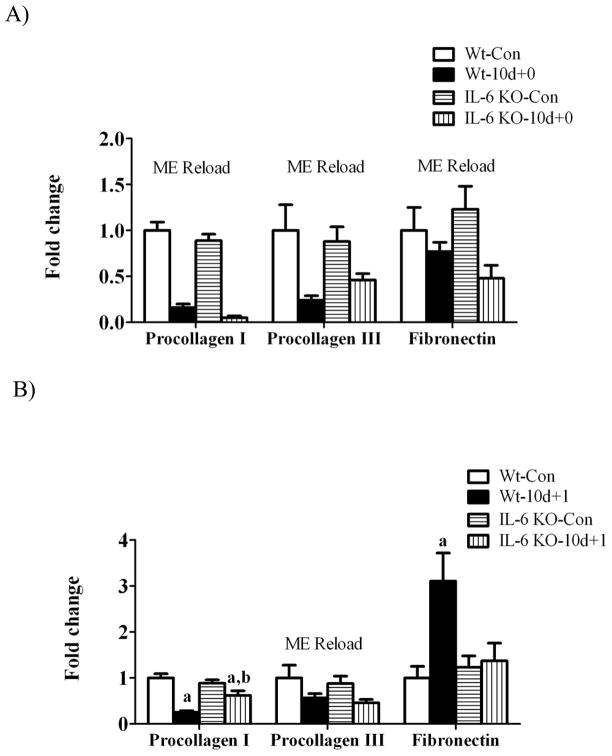
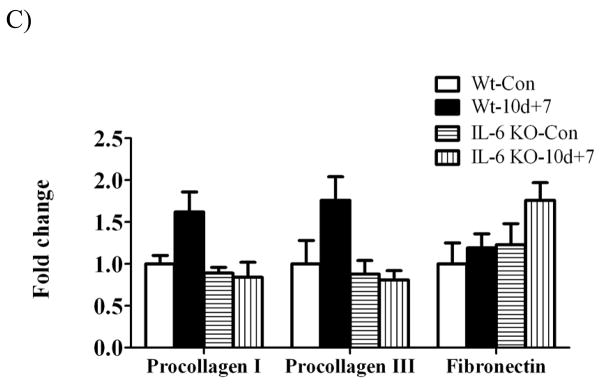
Muscle gene expression of procollagen I, procollagen III and fibronectin were examined as markers of extracellular matrix remodeling during the recovery from disuse. There was a main effect of hindlimb suspension to decrease procollagen I, III, and fibronectin gene expression regardless of IL-6 (Figure 7A). 1 day of recovery attenuated procollagen I and III mRNA expression (Figure 7B). While 1 day of recovery reduced procollagen I gene expression 75% in wild-type muscle, there was only a 30% reduction in IL-6 KO muscle (Figure 7B). At 7 days of recovery, procollagen I and procollagen III expression demonstrated considerable variability in wild-type muscle, which was not different than control levels in both wild-type and IL-6 KO muscle (Figure 7C). Fibronectin mRNA expression was induced 3-fold by 1 day of recovery in wild-type muscle (Figure 7B) and then returned to cage control levels at 7 days of recovery (Figure 7C). IL-6 KO muscle did not have an induction of fibronectin mRNA after 1 day of overload, as in the wild-type, and demonstrated considerable variability in expression after 7 days of recovery, not being significantly different from IL-6 KO control muscle.
Figure 7.
The effect of reloading on extracellular matrix gene expression in the gastrocnemius muscle of Wild-type and IL-6 KO. A) The effect of 10 days of hindlimb suspension on procollagen I, procollagen III, fibronectin mRNA abundance in the gastrocnemius muscle. B) The effect of 1 day of reloading following 10 days of hindlimb suspension on procollagen I, procollagen III, fibronectin mRNA abundance in the gastrocnemius muscle. C) The effect of 7 days of reloading following 10 days of hindlimb suspension on procollagen I, procollagen III, fibronectin mRNA abundance in the gastrocnemius muscle. Values are means ± SE, n = 4–6 per group. a, significantly different from same genotype control. b, significantly different from wild-type matched treatment group.ME, main effect.
Discussion
IL-6 has been shown to alter skeletal muscle’s response to overload-induced hypertrophy and is clearly involved in load-induced muscle remodeling. However, the role of IL-6 in the recovery from disuse atrophy has not been examined. The primary purpose of this study was to determine the effect of IL-6 loss on muscle mass recovery from disuse-induced atrophy. We demonstrate the lack of IL-6 alters the initial response of skeletal muscle to recovery and also delays the initial accretion of muscle mass. However, IL-6 deletion did not impair the ability of muscle to recover wet weight and myofiber diameter after 14 days of recovery. The current study reports the novel finding that the delay in muscle mass recovery from disuse in IL-6 KOmice is associated with the suppression of IGF-1 mRNA expression and signaling through Akt/mTOR. Additionally, there is a repression of myogenic gene expression at the onset of recovery. We did not find muscle lacking IL-6 to have excessive extracellular matrix accumulation after 14 days of recovery from disuse, which contrasts with our previous findings examining overload in mice lacking IL-6 (White et al., 2009b).
IL-6 has been implicated in the proliferation of various cell types such as fibroblasts, satellite cell, and prostate cancer cells (Cantini et al., 1995, Fredj et al., 2005, Ueda et al., 2002). IL-6 gene expression and associated signaling are induced during models of skeletal muscle growth including functional overload and recovery from disuse (Carson et al., 2002, McClung et al., 2007). We have previously shown mice lacking IL-6 have an altered response to overload-induced muscle hypertrophy, especially in regards to extracellular matrix remodeling (White et al., 2009b). Our current study also demonstrates that wild-type mouse gastrocnemius muscle IL-6 mRNA is induced following 1 day of recovery from disuse-induced atrophy. The IL-6 KO mice in the current study had no detectable levels of IL-6 in control muscles and there was no induction of IL-6 following 1 day of reloading as observed in the wild-type mice. It has been well established that 10 days of hindlimb suspension induces atrophy in skeletal muscle (McClung et al., 2007, McClung et al., 2006). We observed significant skeletal muscle atrophy following 10 days of hindlimb suspension in both wild-type and IL-6 KO mice. When animals are allowed to undergo normal ambulation following hindlimb suspension, skeletal muscle initiates a rapid growth response with skeletal muscle mass returning to control levels by 7 days of reloading. However, in mice lacking IL-6 there was delayed recovery of muscle mass. Our data suggests IL-6 may be an important component of the initial growth response, but not required for skeletal muscle mass growth after disuse atrophy.
IGF-1 is a potent mitogen that stimulates skeletal muscle growth in an autocrine/paracrine fashion (Adams, 2002, Adams, 1998). IGF-1 expression is induced during skeletal muscle hypertrophy and IGF-1 transgenic mice exhibit marked skeletal muscle hypertrophy (Adams and Haddad, 1996, van der Velden et al., 2007, Semsarian et al., 1999). IGF-1 signaling through Akt/mTOR is a well described regulator of muscle mass (Glass, 2010). IGF-1 activation of the Akt/mTOR signaling pathway has been shown to initiate protein synthesis early in the recovery from disuse-induced atrophy (Childs et al., 2003). One of the targets of Akt/mTOR signaling is p70S6K. Activation of p70S6K increases protein synthesis via increased translation initiation. We show that IGF-1 signaling is induced after 1 day of recovery in wild-type skeletal muscle, which is in agreement with previously published studies (Sugiura et al., 2005, van der Velden et al., 2007, Childs et al., 2003). However, in the absence of IL-6, IGF-1 signaling was not induced at 1 day of recovery from disuse. The repression of IGF-1 signaling in the current study could reduce protein synthesis and delay the rate of muscle mass recovery. It has been postulated that p70S6K phosphorylation is more important early in the recovery process of skeletal muscle and less important later in the recovery process (Childs et al., 2003). Our data provides support for the role of Akt/mTOR signaling during the early stages (1 day) of recovery from disuse however, further work will be needed to determine if Akt/mTOR activation increases later in the first week of recovery. Since skeletal muscle mass and mean cross sectional area are recovered by 14 days, we postulate IL-6 dependent and IL-6 independent signaling pathways are likely operating during the recovery process.
The bHLH transcription factors are collectively called myogenic regulatory factors and are involved in muscle development, regeneration, and growth processes. The MyoD-family is comprised of MyoD, myogenin, MRF4, and Myf5, which heterodimerize with E proteins and bind to DNA-response elements in the regulatory region of muscle-specific genes (Sabourin and Rudnicki, 2000). MyoD and myogenin induction occurs during overload-induced growth and also recovery from disuse (Adams et al., 1999, Mitchell and Pavlath, 2001, van der Velden et al., 2007). Altered MRF expression affects skeletal muscle to recovery from disuse (Schuierer et al., 2005). In the present study, we observed myogenin was increased in control muscle lacking IL-6. Interestingly, an increase in myogenin has also been reported in aged rat skeletal muscle that also demonstrates suppressed regeneration from toxin induced injury (Marsh et al., 1997). The failure to suppress the expression of myogenin in muscle lacking IL-6 could play a role in delaying the recovery process. After 10 days of suspension, we found MyoD and myogenin gene expression induced after day 1 of recovery in wild-type mice was not present in skeletal muscle from IL-6 KOmice. Serrano et al (Serrano et al., 2008) reported that mice lacking IL-6 and subjected to functional overload had repressed muscle satellite cell activation which was associated with the repression of myogenin. Further work is required to understand the implications of myogenic factor suppression on the rate of muscle recovery from disuse and if satellite cell activity is involved.
The dominant pathway of IL-6 signaling is through the signal transducer and activator of transcription 3 (Stat3) signaling pathway (Croker et al., 2003). Stat3 transcriptional targets are involved in multiple cellular functions including immune function, cell proliferation and growth, differentiation and possibly apoptosis (Levy and Darnell, 2002, Clarkson et al., 2006). In skeletal muscle, Stat3 activation has been associated with acute exercise (Trenerry et al., 2008) and overload-induced muscle hypertrophy (Serrano et al., 2008). It has been previously shown that cyclin D1, a marker of satellite cell proliferation (Olson et al., 1991) is a transcription target of Stat3. We show Stat3 activation after one day of reloading increases in wild-type mouse muscle, but not in IL-6 KO mice. However, cyclin D1 expression is increased in both control and reloaded muscle lacking IL-6. Cyclin D1 expression in wild-type muscle was not increased significantly due to the highly variable response within these mice. Therefore, the induction of cyclin D1 in the IL-6 KO mouse is not Stat3 dependent. In support of our data, cyclin D1 gene expression in IL-6 KO mice undergoing overload-induced hypertrophy increased despite the lack of Stat3 activation (Serrano et al., 2008). Taken together, there appears to be convincing evidence that muscle cyclin D1 expression can be induced by growth-inducing stimuli in a Stat3-independent manner.
The regulation of fibrosis is critical for a normal growth response (Sato et al., 2003, Li et al., 2004). We recently reported that functional overloading skeletal muscle lacking IL-6 results in an exaggerated induction of muscle IGF-1 gene expression and also a large induction in non-contractile tissue compared to wild-type muscle (White et al., 2009b). This contrasts with the present study which reports repressed IGF-1 signaling and no expansion of non-contractile tissue. These changes clearly illustrate the physiological differences between skeletal muscle growth due to functional overload and recovery of muscle mass after atrophy. One major difference between these two models is the extent of muscle damage. Skeletal muscle recovery from disuse is associated with extensive damage and inflammation whereas there is limited damage resulting from functional overload (Dipasquale et al., 2007). In addition, atrophy results in the induction of a unique cell-signaling pathway that must be terminated or attenuated before growth can occur. Besides expansion of non-contractile tissue, remodeling of extracellular matrix components is important regulator of skeletal muscle growth (Kjaer, 2004). We demonstrate the induction of fibronectin mRNA found after 1 day of recovery in wild-type is ablated in mice lacking IL-6 muscle. Fibronectin availability has been shown to regulate satellite cell activity (Le Moigne et al., 1990). While one day of reloading severely repressed collagen III and collagen I mRNA expression, in mice lacking IL-6 this suppression was attenuated. At 7 days of reloading, collagen I and III were increased ~70% in wild-type mice; however, these differences were not significant due to high variability. Further investigation is needed to determine if altered extracellular remodeling at the onset of recovery could serve to delay recovery from atrophy.
In summary, we present data demonstrating IL-6 is a regulator of the early adaptive response of skeletal muscle recovery from disuse in young growing mice. IL-6 KO animals had an initial delay in muscle mass recovery when compared to wild-type animals. We demonstrate that the delayed muscle mass recovery in mice lacking IL-6 is associated with the initial suppression of muscle IGF-1 signaling, and altered myogenic gene expression. Since IL-6 knockout mice maintained the capacity to fully recover skeletal muscle mass by day 14 of recovery, it appears that IL-6 regulated processes occurring early in the recovery process may affect the initial recovery rate, but not be required if sufficient recovery time is allowed.
Acknowledgments
The authors would like to thank Lynette Washington, Kristen Baltgalvis and Raymond Thompson for their assistance. The research described in this report was supported by NIH Grant P20 RR-017698 from the National Center for Research Resources. Its contents are solely the responsibility of the authors and do not necessarily represent the official views of the NIH. Tyrone Washington received funding through a University of South Carolina Graduate School Doctoral Student Fellowship.
Footnotes
Conflicts of Interest
There is no conflicts of interest.
References
- Adams GR. Role of insulin-like growth factor-I in the regulation of skeletal muscle adaptation to increased loading. Exerc Sport Sci Rev. 1998;26:31–60. [PubMed] [Google Scholar]
- Adams GR. Autocrine and/or paracrine insulin-like growth factor-I activity in skeletal muscle. Clin Orthop Relat Res. 2002:S188–96. doi: 10.1097/00003086-200210001-00022. [DOI] [PubMed] [Google Scholar]
- Adams GR, Haddad F. The relationships among IGF-1, DNA content, and protein accumulation during skeletal muscle hypertrophy. J Appl Physiol. 1996;81:2509–16. doi: 10.1152/jappl.1996.81.6.2509. [DOI] [PubMed] [Google Scholar]
- Adams GR, Haddad F, Baldwin KM. Time course of changes in markers of myogenesis in overloaded rat skeletal muscles. J Appl Physiol. 1999;87:1705–12. doi: 10.1152/jappl.1999.87.5.1705. [DOI] [PubMed] [Google Scholar]
- Ahtikoski AM, Koskinen SO, Virtanen P, Kovanen V, Takala TE. Regulation of synthesis of fibrillar collagens in rat skeletal muscle during immobilization in shortened and lengthened positions. Acta Physiol Scand. 2001;172:131–40. doi: 10.1046/j.1365-201X.2001.00848.x. [DOI] [PubMed] [Google Scholar]
- Akira S, Taga T, Kishimoto T. Interleukin-6 in biology and medicine. Adv Immunol. 1993;54:1–78. doi: 10.1016/s0065-2776(08)60532-5. [DOI] [PubMed] [Google Scholar]
- Alexakis C, Partridge T, Bou-Gharios G. Implication of the satellite cell in dystrophic muscle fibrosis: a self perpetuating mechanism of collagen overproduction. Am J Physiol Cell Physiol. 2007 doi: 10.1152/ajpcell.00061.2007. [DOI] [PubMed] [Google Scholar]
- Baltgalvis KA, Berger FG, Pena MM, Davis JM, Carson JA. Effect of exercise on biological pathways in ApcMin/+ mouse intestinal polyps. J Appl Physiol. 2008a;104:1137–43. doi: 10.1152/japplphysiol.00955.2007. [DOI] [PubMed] [Google Scholar]
- Baltgalvis KA, Berger FG, Pena MM, Davis JM, Muga SJ, Carson JA. Interleukin-6 and cachexia in ApcMin/+ mice. Am J Physiol Regul Integr Comp Physiol. 2008b;294:R393–401. doi: 10.1152/ajpregu.00716.2007. [DOI] [PubMed] [Google Scholar]
- Bondesen BA, Mills ST, Kegley KM, Pavlath GK. The COX-2 pathway is essential during early stages of skeletal muscle regeneration. Am J Physiol Cell Physiol. 2004;287:C475–83. doi: 10.1152/ajpcell.00088.2004. [DOI] [PubMed] [Google Scholar]
- Bondesen BA, Mills ST, Pavlath GK. The COX-2 pathway regulates growth of atrophied muscle via multiple mechanisms. Am J Physiol Cell Physiol. 2006;290:C1651–9. doi: 10.1152/ajpcell.00518.2005. [DOI] [PubMed] [Google Scholar]
- Bradford MM. A rapid and sensitive method for the quantitation of microgram quantities of protein utilizing the principle of protein-dye binding. Anal Biochem. 1976;72:248–54. doi: 10.1016/0003-2697(76)90527-3. [DOI] [PubMed] [Google Scholar]
- Cantini M, Massimino ML, Rapizzi E, Rossini K, Catani C, Dalla Libera L, Carraro U. Human satellite cell proliferation in vitro is regulated by autocrine secretion of IL-6 stimulated by a soluble factor(s) released by activated monocytes. Biochem Biophys Res Commun. 1995;216:49–53. doi: 10.1006/bbrc.1995.2590. [DOI] [PubMed] [Google Scholar]
- Carson JA, Nettleton D, Reecy JM. Differential gene expression in the rat soleus muscle during early work overload-induced hypertrophy. Faseb J. 2002;16:207–9. doi: 10.1096/fj.01-0544fje. [DOI] [PubMed] [Google Scholar]
- Childs TE, Spangenburg EE, Vyas DR, Booth FW. Temporal alterations in protein signaling cascades during recovery from muscle atrophy. Am J Physiol Cell Physiol. 2003;285:C391–8. doi: 10.1152/ajpcell.00478.2002. [DOI] [PubMed] [Google Scholar]
- Clarkson RW, Boland MP, Kritikou EA, Lee JM, Freeman TC, Tiffen PG, Watson CJ. The genes induced by signal transducer and activators of transcription (STAT)3 and STAT5 in mammary epithelial cells define the roles of these STATs in mammary development. Mol Endocrinol. 2006;20:675–85. doi: 10.1210/me.2005-0392. [DOI] [PubMed] [Google Scholar]
- Croker BA, Krebs DL, Zhang JG, Wormald S, Willson TA, Stanley EG, Robb L, Greenhalgh CJ, Forster I, Clausen BE, Nicola NA, Metcalf D, Hilton DJ, Roberts AW, Alexander WS. SOCS3 negatively regulates IL-6 signaling in vivo. Nat Immunol. 2003;4:540–5. doi: 10.1038/ni931. [DOI] [PubMed] [Google Scholar]
- Dapp C, Schmutz S, Hoppeler H, Fluck M. Transcriptional reprogramming and ultrastructure during atrophy and recovery of mouse soleus muscle. Physiol Genomics. 2004;20:97–107. doi: 10.1152/physiolgenomics.00100.2004. [DOI] [PubMed] [Google Scholar]
- Dipasquale DM, Cheng M, Billich W, Huang SA, van Rooijen N, Hornberger T, Koh TJ. The Urokinase-Type Plasminogen Activator and Macrophages Are Required for Skeletal Muscle Hypertrophy in Mice. Am J Physiol Cell Physiol. 2007 doi: 10.1152/ajpcell.00201.2007. [DOI] [PubMed] [Google Scholar]
- Febbraio MA, Pedersen BK. Muscle-derived interleukin-6: mechanisms for activation and possible biological roles. Faseb J. 2002;16:1335–47. doi: 10.1096/fj.01-0876rev. [DOI] [PubMed] [Google Scholar]
- Fitts RH, Riley DR, Widrick JJ. Physiology of a microgravity environment invited review: microgravity and skeletal muscle. J Appl Physiol. 2000;89:823–39. doi: 10.1152/jappl.2000.89.2.823. [DOI] [PubMed] [Google Scholar]
- Fluck M, Chiquet M, Schmutz S, Mayet-Sornay MH, Desplanches D. Reloading of atrophied rat soleus muscle induces tenascin-C expression around damaged muscle fibers. Am J Physiol Regul Integr Comp Physiol. 2003;284:R792–801. doi: 10.1152/ajpregu.00060.2002. [DOI] [PubMed] [Google Scholar]
- Fredj S, Bescond J, Louault C, Delwail A, Lecron JC, Potreau D. Role of interleukin-6 in cardiomyocyte/cardiac fibroblast interactions during myocyte hypertrophy and fibroblast proliferation. J Cell Physiol. 2005;204:428–36. doi: 10.1002/jcp.20307. [DOI] [PubMed] [Google Scholar]
- Glass DJ. PI3 kinase regulation of skeletal muscle hypertrophy and atrophy. Curr Top Microbiol Immunol. 2010;346:267–78. doi: 10.1007/82_2010_78. [DOI] [PubMed] [Google Scholar]
- Haddad F, Zaldivar FP, Cooper DM, Adams GR. IL-6 Induced Skeletal Muscle Atrophy. J Appl Physiol. 2004 doi: 10.1152/japplphysiol.01026.2004. [DOI] [PubMed] [Google Scholar]
- Han XY, Wang W, Komulainen J, Koskinen SO, Kovanen V, Vihko V, Trackman PC, Takala TE. Increased mRNAs for procollagens and key regulating enzymes in rat skeletal muscle following downhill running. Pflugers Arch. 1999;437:857–64. doi: 10.1007/s004240050855. [DOI] [PubMed] [Google Scholar]
- Hawke TJ, Garry DJ. Myogenic satellite cells: physiology to molecular biology. J Appl Physiol. 2001;91:534–51. doi: 10.1152/jappl.2001.91.2.534. [DOI] [PubMed] [Google Scholar]
- Itai Y, Kariya Y, Hoshino Y. Morphological changes in rat hindlimb muscle fibres during recovery from disuse atrophy. Acta Physiol Scand. 2004;181:217–24. doi: 10.1111/j.1365-201X.2004.01271.x. [DOI] [PubMed] [Google Scholar]
- Jonsdottir IH, Schjerling P, Ostrowski K, Asp S, Richter EA, Pedersen BK. Muscle contractions induce interleukin-6 mRNA production in rat skeletal muscles. J Physiol, 528 Pt. 2000;1:157–63. doi: 10.1111/j.1469-7793.2000.00157.x. [DOI] [PMC free article] [PubMed] [Google Scholar]
- Kasper CE. Sarcolemmal disruption in reloaded atrophic skeletal muscle. J Appl Physiol. 1995;79:607–14. doi: 10.1152/jappl.1995.79.2.607. [DOI] [PubMed] [Google Scholar]
- Kern PA, Ranganathan S, Li C, Wood L, Ranganathan G. Adipose tissue tumor necrosis factor and interleukin-6 expression in human obesity and insulin resistance. Am J Physiol Endocrinol Metab. 2001;280:E745–51. doi: 10.1152/ajpendo.2001.280.5.E745. [DOI] [PubMed] [Google Scholar]
- Kjaer M. Role of extracellular matrix in adaptation of tendon and skeletal muscle to mechanical loading. Physiol Rev. 2004;84:649–98. doi: 10.1152/physrev.00031.2003. [DOI] [PubMed] [Google Scholar]
- Kopf M, Baumann H, Freer G, Freudenberg M, Lamers M, Kishimoto T, Zinkernagel R, Bluethmann H, Kohler G. Impaired immune and acute-phase responses in interleukin-6-deficient mice. Nature. 1994;368:339–42. doi: 10.1038/368339a0. [DOI] [PubMed] [Google Scholar]
- Laurent GJ, McAnulty RJ, Gibson J. Changes in collagen synthesis and degradation during skeletal muscle growth. Am J Physiol. 1985;249:C352–5. doi: 10.1152/ajpcell.1985.249.3.C352. [DOI] [PubMed] [Google Scholar]
- Le Moigne A, Martelly I, Barlovatz-Meimon G, Franquinet R, Aamiri A, Frisdal E, Bassaglia Y, Moraczewski G, Gautron J. Characterization of myogenesis from adult satellite cells cultured in vitro. Int J Dev Biol. 1990;34:171–80. [PubMed] [Google Scholar]
- Levy DE, Darnell JE., Jr Stats: transcriptional control and biological impact. Nat Rev Mol Cell Biol. 2002;3:651–62. doi: 10.1038/nrm909. [DOI] [PubMed] [Google Scholar]
- Li Y, Foster W, Deasy BM, Chan Y, Prisk V, Tang Y, Cummins J, Huard J. Transforming growth factor-beta1 induces the differentiation of myogenic cells into fibrotic cells in injured skeletal muscle: a key event in muscle fibrogenesis. Am J Pathol. 2004;164:1007–19. doi: 10.1016/s0002-9440(10)63188-4. [DOI] [PMC free article] [PubMed] [Google Scholar]
- Lluis F, Perdiguero E, Nebreda AR, Munoz-Canoves P. Regulation of skeletal muscle gene expression by p38 MAP kinases. Trends Cell Biol. 2006;16:36–44. doi: 10.1016/j.tcb.2005.11.002. [DOI] [PubMed] [Google Scholar]
- Marsh DR, Criswell DS, Carson JA, Booth FW. Myogenic regulatory factors during regeneration of skeletal muscle in young, adult, and old rats. J Appl Physiol. 1997;83:1270–5. doi: 10.1152/jappl.1997.83.4.1270. [DOI] [PubMed] [Google Scholar]
- McClung JM, Davis JM, Carson JA. Ovarian hormone status and skeletal muscle inflammation during recovery from disuse in rats. Exp Physiol. 2007;92:219–32. doi: 10.1113/expphysiol.2006.035071. [DOI] [PubMed] [Google Scholar]
- McClung JM, Davis JM, Wilson MA, Goldsmith EC, Carson JA. Estrogen status and skeletal muscle recovery from disuse atrophy. J Appl Physiol. 2006;100:2012–23. doi: 10.1152/japplphysiol.01583.2005. [DOI] [PubMed] [Google Scholar]
- McClung JM, Mehl KA, Thompson RW, Lowe LL, Carson JA. Nandrolone decanoate modulates cell cycle regulation in functionally overloaded rat soleus muscle. Am J Physiol Regul Integr Comp Physiol. 2005;288:R1543–52. doi: 10.1152/ajpregu.00285.2004. [DOI] [PubMed] [Google Scholar]
- Mitchell PO, Pavlath GK. A muscle precursor cell-dependent pathway contributes to muscle growth after atrophy. Am J Physiol Cell Physiol. 2001;281:C1706–15. doi: 10.1152/ajpcell.2001.281.5.C1706. [DOI] [PubMed] [Google Scholar]
- Olson EN, Brennan TJ, Chakraborty T, Cheng TC, Cserjesi P, Edmondson D, James G, Li L. Molecular control of myogenesis: antagonism between growth and differentiation. Mol Cell Biochem. 1991;104:7–13. doi: 10.1007/BF00229797. [DOI] [PubMed] [Google Scholar]
- Sabourin LA, Rudnicki MA. The molecular regulation of myogenesis. Clin Genet. 2000;57:16–25. doi: 10.1034/j.1399-0004.2000.570103.x. [DOI] [PubMed] [Google Scholar]
- Sato K, Li Y, Foster W, Fukushima K, Badlani N, Adachi N, Usas A, Fu FH, Huard J. Improvement of muscle healing through enhancement of muscle regeneration and prevention of fibrosis. Muscle Nerve. 2003;28:365–72. doi: 10.1002/mus.10436. [DOI] [PubMed] [Google Scholar]
- Schuierer MM, Mann CJ, Bildsoe H, Huxley C, Hughes SM. Analyses of the differentiation potential of satellite cells from myoD−/−, mdx, and PMP22 C22 mice. BMC Musculoskelet Disord. 2005;6:15. doi: 10.1186/1471-2474-6-15. [DOI] [PMC free article] [PubMed] [Google Scholar]
- Semsarian C, Sutrave P, Richmond DR, Graham RM. Insulin-like growth factor (IGF-I) induces myotube hypertrophy associated with an increase in anaerobic glycolysis in a clonal skeletal-muscle cell model. Biochem J. 1999;339 ( Pt 2):443–51. [PMC free article] [PubMed] [Google Scholar]
- Serrano AL, Baeza-Raja B, Perdiguero E, Jardi M, Munoz-Canoves P. Interleukin-6 is an essential regulator of satellite cell-mediated skeletal muscle hypertrophy. Cell Metab. 2008;7:33–44. doi: 10.1016/j.cmet.2007.11.011. [DOI] [PubMed] [Google Scholar]
- Sugiura T, Abe N, Nagano M, Goto K, Sakuma K, Naito H, Yoshioka T, Powers SK. Changes in PKB/Akt and calcineurin signaling during recovery in atrophied soleus muscle induced by unloading. Am J Physiol Regul Integr Comp Physiol. 2005;288:R1273–8. doi: 10.1152/ajpregu.00688.2004. [DOI] [PubMed] [Google Scholar]
- Trenerry MK, Carey KA, Ward AC, Farnfield MM, Cameron-Smith D. Exercise-induced activation of STAT3 signaling is increased with age. Rejuvenation Res. 2008;11:717–24. doi: 10.1089/rej.2007.0643. [DOI] [PubMed] [Google Scholar]
- Tsujinaka T, Ebisui C, Fujita J, Kishibuchi M, Morimoto T, Ogawa A, Katsume A, Ohsugi Y, Kominami E, Monden M. Muscle undergoes atrophy in association with increase of lysosomal cathepsin activity in interleukin-6 transgenic mouse. Biochem Biophys Res Commun. 1995;207:168–74. doi: 10.1006/bbrc.1995.1168. [DOI] [PubMed] [Google Scholar]
- Ueda T, Bruchovsky N, Sadar MD. Activation of the androgen receptor N-terminal domain by interleukin-6 via MAPK and STAT3 signal transduction pathways. J Biol Chem. 2002;277:7076–85. doi: 10.1074/jbc.M108255200. [DOI] [PubMed] [Google Scholar]
- Urso ML, Scrimgeour AG, Chen YW, Thompson PD, Clarkson PM. Analysis of human skeletal muscle after 48 h immobilization reveals alterations in mRNA and protein for extracellular matrix components. J Appl Physiol. 2006;101:1136–48. doi: 10.1152/japplphysiol.00180.2006. [DOI] [PubMed] [Google Scholar]
- van der Velden JL, Langen RC, Kelders MC, Willems J, Wouters EF, Janssen-Heininger YM, Schols AM. Myogenic differentiation during regrowth of atrophied skeletal muscle is associated with inactivation of GSK-3beta. Am J Physiol Cell Physiol. 2007;292:C1636–44. doi: 10.1152/ajpcell.00504.2006. [DOI] [PubMed] [Google Scholar]
- van der Velden JL, Langen RC, Kelders MC, Wouters EF, Janssen-Heininger YM, Schols AM. Inhibition of glycogen synthase kinase-3beta activity is sufficient to stimulate myogenic differentiation. Am J Physiol Cell Physiol. 2006;290:C453–62. doi: 10.1152/ajpcell.00068.2005. [DOI] [PubMed] [Google Scholar]
- Wallenius V, Wallenius K, Ahren B, Rudling M, Carlsten H, Dickson SL, Ohlsson C, Jansson JO. Interleukin-6-deficient mice develop mature-onset obesity. Nat Med. 2002;8:75–9. doi: 10.1038/nm0102-75. [DOI] [PubMed] [Google Scholar]
- Washington TA, Reecy JM, Thompson RW, Lowe LL, McClung JM, Carson JA. Lactate dehydrogenase expression at the onset of altered loading in rat soleus muscle. J Appl Physiol. 2004;97:1424–30. doi: 10.1152/japplphysiol.00222.2004. [DOI] [PubMed] [Google Scholar]
- White JP, Baltgalvis KA, Sato S, Wilson LB, Carson JA. Effect of nandrolone decanoate administration on recovery from bupivacaine-induced muscle injury. J Appl Physiol. 2009a;107:1420–30. doi: 10.1152/japplphysiol.00668.2009. [DOI] [PMC free article] [PubMed] [Google Scholar]
- White JP, Reecy JM, Washington TA, Sato S, Le ME, Davis JM, Wilson LB, Carson JA. Overload-induced skeletal muscle extracellular matrix remodelling and myofibre growth in mice lacking IL-6. Acta Physiol (Oxf) 2009b;197:321–32. doi: 10.1111/j.1748-1716.2009.02029.x. [DOI] [PMC free article] [PubMed] [Google Scholar]
- Yan Z, Choi S, Liu X, Zhang M, Schageman JJ, Lee SY, Hart R, Lin L, Thurmond FA, Williams RS. Highly coordinated gene regulation in mouse skeletal muscle regeneration. J Biol Chem. 2003;278:8826–36. doi: 10.1074/jbc.M209879200. [DOI] [PubMed] [Google Scholar]


