Abstract
Gaining a complete and comprehensive understanding of lung cancer nodule histological compositions and how these tissues are represented in radiological data is important not only for expanding the current knowledge base of cancer growth and development but also has potential implications for classification standards, radiological diagnosis methods and for the evaluation of treatment response. In this study we generate large scale histological segmentations of the cancerous and non-cancerous tissues within resected lung nodules. We have implemented a processing pipeline which allows for the direct correlation between histological data and spatially corresponding computed tomography data. Utilizing these correlated datasets we evaluated the statistical separation between Hounsfield Unit (HU) histogram values for each tissue type. The findings of this study revealed that lung cancer nodules contain a complex intermixing of cellular tissue types and that trends exist in the relationship between these tissue types. It was found that the mean Hounsfield Unit values for isolated lung cancer nodules imaged with computed tomography, had statistically significantly different values for non-solid bronchoalveolar carcinoma, solid cancerous tumor, blood, and inactive fibrotic stromal tissue.
Key Terms: Nodule, pathology, quantification, heterogeneity, Hounsfield Unit, computer aided diagnosis
Introduction
Molecular studies in lung cancer have demonstrated great heterogeneity in lung cancer genetics, with some potential therapeutic targets being pursued. One factor reducing the impact of genetic results is that the physical and structural constructs of the lung cancer biomass have not been defined quantitatively, with there being little or no understanding of the imaging or histological complexity of the lung cancer biomass, especially in three dimensions. This lack of information significantly reduces the development of new diagnostic tests, as well as making subtle change analysis from new therapies impossible to evaluate.
We have previously developed a unique process model system to acquire multi-modal, volumetric, cross-registered data pertaining to resected human lung cancer nodules [1]. These multi modal datasets have include multi row detector computerized tomography (MDCT) scans, micro-CT scans, and three dimensional pathology using a purpose built precision tissue microtome with digital camera that is referred to as the Large Image Microscope Array (LIMA) [2], as well as standard histopathology. All of these samples from the same lung cancer are cross registered pixel for pixel, giving the opportunity to describe the complexity of the lung cancer biomass. We have also published from these datasets the precise quantification of the histopathological tissue composition of the lung cancer biomass [3]. In this current study we utilize the developed datasets to examine the content and relationships between tissue components of the lung cancer biomass and how these tissues are represented in corresponding MDCT Hounsfield Units (HU).
The cellular composition of lung nodules is routinely examined for diagnosis and is important for determining prognostic and treatment guidelines [4]. For this purpose, great attention has been paid to the cancerous portion of the lung nodule in determining a classification or one or more histological sub-type [5]. More recently, lung nodule histological composition is being described and evaluated qualitatively, extending beyond the cancerous component of the nodule to include vascular, fibrotic, and necrotic tissue [6, 7]. These studies have indicated there is a statistically significant correlation between the proportions of necrosis and fibrosis within a lung nodule and patient outcome. This may lead to future sub-type classifications of lung nodules extending beyond the cancerous portion to also include non-cancerous tissues of the nodule. However, large challenges are already faced in obtaining consistent classifications of histological sub-typing due to a large dependence on qualitative grading approaches and small sub-sampled, two dimensional fields for assessment of a complex three-dimensional biomass.
It is widely accepted that the radiological representation of lung nodules may be linked to the histological sub-type, such as ground-glass opacities correlated to bronchoalveloar carcinoma (BAC) [8–10]. What is poorly understood is if the correlation between computed tomography HU variance and underlying tissue structure extends beyond the solid and non-solid nodule components, to the level of cellular tissue types.
In this study we present a controlled, quantitative evaluation of the histological composition of resected lung cancer nodules, primarily adenocarcinoma. This evaluation incorporates the identification of the histological tissue types comprising the nodule biomass, their relative proportions as well as the shape and interaction between the tissue type regions. We have used segmented histopathological data to isolate HU histogram statistics for each tissue type from MDCT, and explore the statistical separability between these histograms.
Methods
Tissue
For study inclusion, a lung nodule (estimated diameter ≤ 30 mm) suspected or positively confirmed as primary lung cancer, requiring lobectomy resection procedure was required. Eleven lobectomy specimens were obtained from consented human patients, as per the protocol approved by our Institutional Review Board. Of these tissue samples, seven nodules were primarily lung adenocarcinoma, three nodules were squamous cell carcinomas and one nodule was a neuroendocrine carcinoma.
Data Acquisition
The processing model, described by Sieren et al. [11] was utilized to generate a comprehensive, volumetric datasets for each lung nodule case, consisting of cross-registered MDCT, micro-CT and histology data (Figure 1). In brief, lobectomy specimens were cannulated and inflation fixed at 15 cmH2O using a modification of the Heitzman fixation approach [12]. Following fixation, MDCT data for the fixed lung lobes were collected using a Siemens Somatom Sensation 64 MDCT scanner (Siemens Medical Solutions, Forchheim, Germany). MDCT data scanning was performed at 120kV, 140mAs, 0.6mm collimation and reconstructed with a B35 kernel and 300 micron isotropic voxels. The lung nodules were then dissected from the surrounding tissue and high resolution MDCT data and micro-CT (80 keV, 100 microA) data were obtained. A novel system, the Large Image Microscope Array (LIMA) [2] was utilized to sequentially section and image the lung nodules. Output from the LIMA were the nodule volume sectioned into sequential 500 micron thick tissue sections, and a color image dataset in which the spatial correspondence between each tissue section remained linked to the nodule volume. Each tissue section was processed using standard histopathology to produce hematoxylin and eosin (H&E) stained histology slides.
Figure 1.
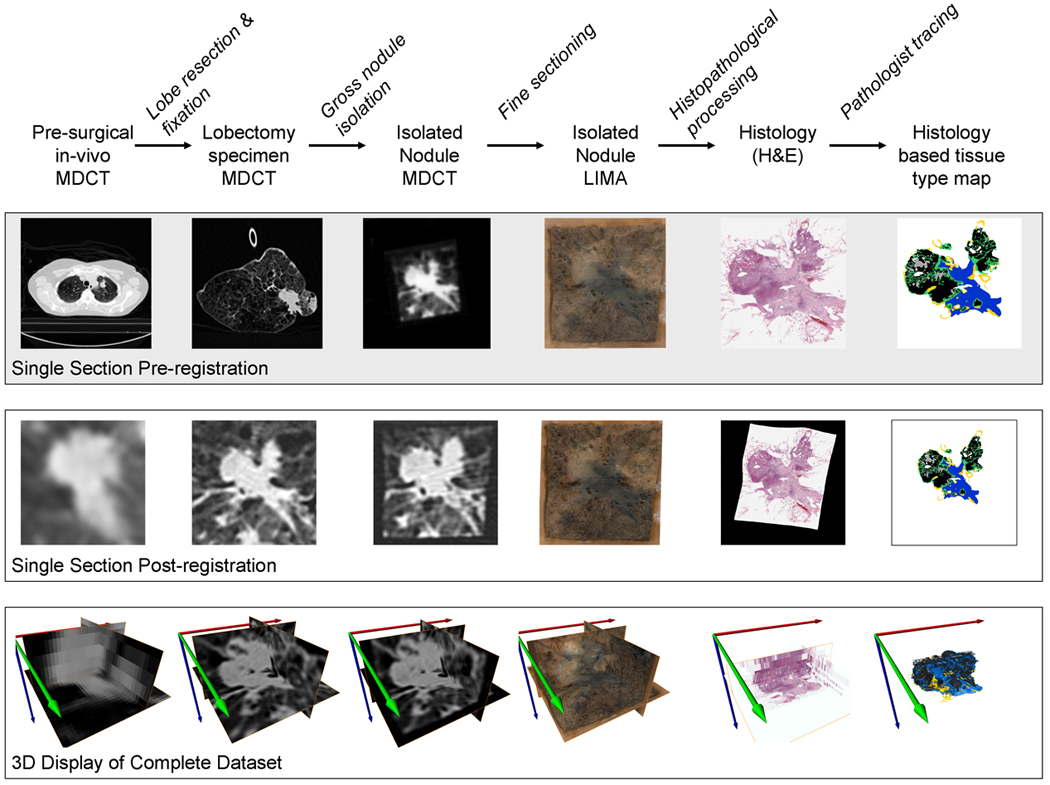
A flow diagram of the process model for generating three dimensional, cross-registered datasets of lung cancer nodules, relating segmented histopathology content to corresponding ex-vivo and in-vivo volumetric MDCT datasets. This process incorporated specific tissue preparation/imaging protocols, stabilization hardware and post processing using rigid and non-rigid registration. Featured is a sample slice from the dataset before and after registration as well a depiction of the volumetric result following registration. The creation of the histology based tissue type maps incorporated the manual segmentation of solid grouping of cancer cells (black), cancer cells following a non-solid bronchoalveolar carcinoma pattern (purple), necrotic cells (gray), active fibroblastic stroma (green), hyaline fibrosis (blue), normal airway wall cells (yellow) and groupings of erythrocytes (red).
The H&E histology slides were digitized using a ScanScope Slide digitizer (Aperio Technology, Vista, CA) and analyzed by a surgical pathologist with subspecialty expertise in pulmonary pathology. Analysis involved the manual segmentation of: solid grouping of cancer cells (black), cancer cells following a non-solid bronchoalveolar carcinoma pattern (purple), necrotic tumor (gray), active fibrosis (green), hyaline fibrosis (blue), normal airway wall tissue (yellow) and groupings of erythrocytes (red). The results of the segmentation were presented as a color coded tissue type map, as seen in Figure 1.
The LIMA image dataset served as the basis for non-rigid registration of the digitized histology data, compensating for the distortion and shrinkage that occurs with standard histopathology processing. Thus, the many histology sections for a nodule could be aligned to the original nodule volume, as it was represented not only in the LIMA dataset (on which the registration was based) but also the volumetric micro-CT and MDCT datasets [11].
Lung Nodule Composition from Histopathology
The segmentation of the histopathological data, generating tissue type maps for each dataset, allowed the quantitative evaluation of the composition of the nodule. The proportions of each tissue type were calculated by summing the number of pixels in a tissue type class and dividing this number by the sum of pixels in all tissue type classes. An average of eleven histopathological sections per nodule were analyzed. Figure 2 features these results, tabulated and presented in a percentage bar graph. A wide range of distributions of tissue type percentages occurred across the dataset.
Figure 2.
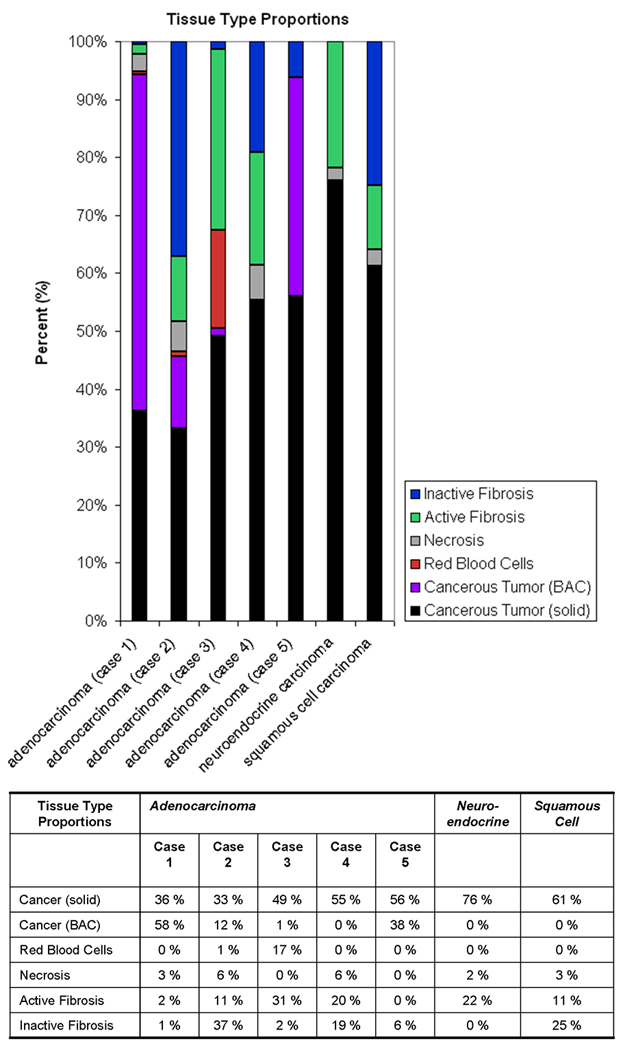
The proportions of each tissue type for the five adenocarcinoma cases and example neuroendocrine and squamous cell carcinomas were determined using the 3D histopathology datasets.
Regional Based Histopathology Assessment
The construction of tissue type maps based on histopathology can not only be used to gain comprehensive estimates of tissue type proportions, but may also be used for quantification of the regional properties of each tissue type.
The histological tissue type maps were split into a series of binary masks, one for each tissue type. Connected component analysis was conducted to label each region of each tissue type. For each region, a number of shape descriptors were calculated and these values were tabulated for analysis. Shape descriptors are widely used to simplify the description of complex objects. This is achieved by assigning a numerical value to represent a property of the object’s shape. Area and perimeter are examples of simple shape descriptors.
The Euler number is a shape descriptor which is indicative of the number of holes with in a region. It is calculated by subtracting the number of holes in a region from the number of connected components [13]. For understanding the architecture of lung nodules, trends in the Euler number can be insightful for determining which tissue types are generally encompassing and which are encompassed. A structure that is encompassing of other regions would have a high number of holes and hence a very negative Euler number. Structures that exist primarily as ‘islands’ in an encompassing ‘ocean’ would have an Euler number of zero or above.
Area to perimeter ratios have been commonly used to describe the boundary of an object. Compactness is a shape measure which represents the spread of a region and it is calculated as the area times 4π divided by the squared perimeter [14]. A circular object has the maximum compactness value of one. Shapes with more complex boundaries have a compactness value less than one. An infinitely long and narrow shape would have a compactness value of zero.
Volumetric Histopathology Renderings of Lung Nodule Composition
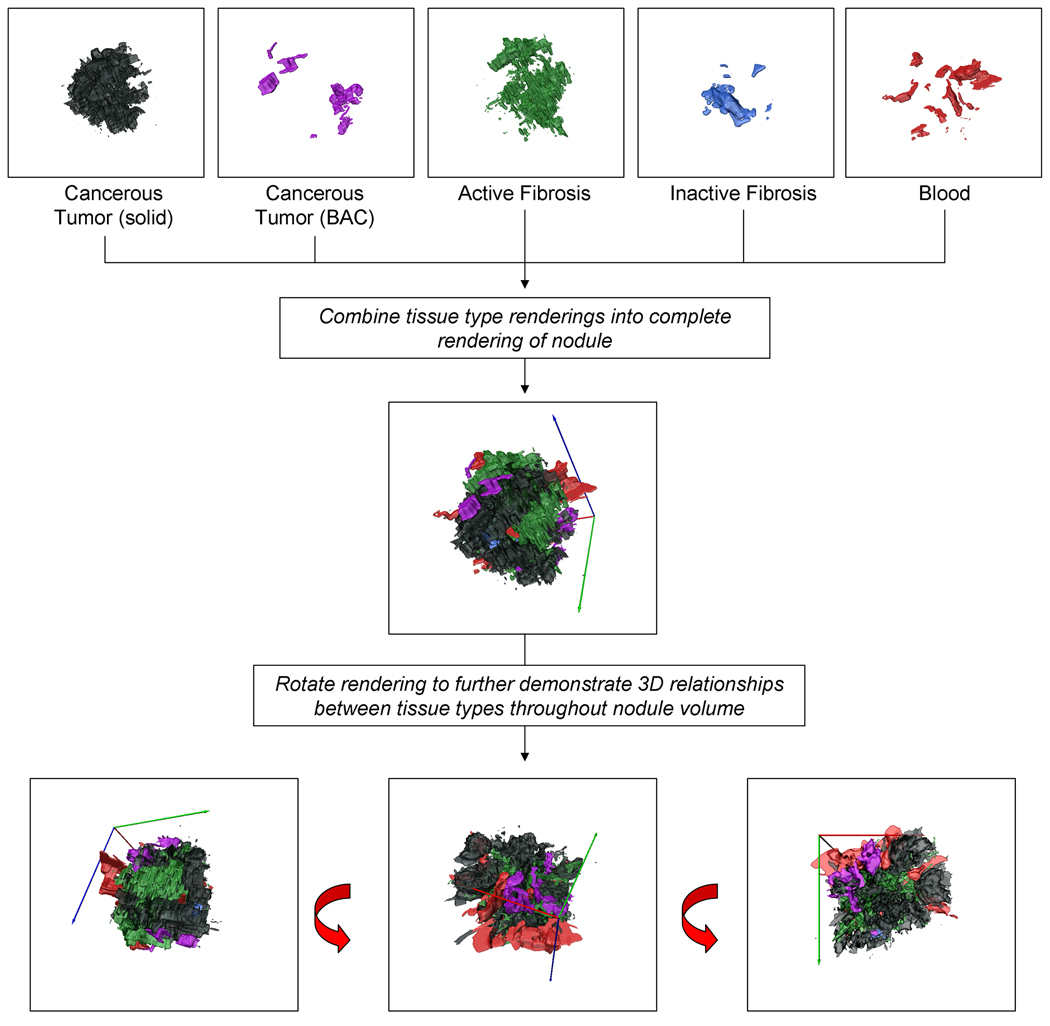
The histopathologically obtained tissue type maps were also used to generate 3D reconstructions of the tissue types within a nodule, Figure 3. Typically, the creation of 3D reconstructions from histopathology data is challenging due to the distortion of the tissue which occurs during the creation of a histology slide. Our unique data acquisition and processing steps, summarized above, allow for the correction of this distortion and the alignment of sequential histological sections in a global coordinate space. Hence volumetric histopathological datasets could be established. Within the histopathological data, anisotropy existed between the in-plane resolution (8.54 micron) and the separation between subsequent sections (approximately 500 microns). Lanczos resampling was used to decrease the in-plane resolution and cubic interpolation was used to bridge the information between subsequent sections. A 3D surface for each tissue type was then generated via smoothed triangular approximation. The 3D tissue type reconstructions are valuable in visualizing the distribution of the tissue types throughout the nodule volume. These reconstructions contribute towards gaining a comprehensive understanding of the nodules volumetric content and the relationships between tissue boundaries.
Figure 3.
This volumetric reconstruction of the segmented tissue types from an adenocarcinoma nodule allows for a more comprehensive, qualitative understanding of the relationships between the different tissue types and their distribution throughout the nodule volume. Shown are the renderings of each tissue type individually (solid cancerous tumor, cancerous tumor in a nonsolid bronchioalveolar carcinoma pattern, active fibroblastic stroma, hyaline (inactive) fibrosis and blood) as well as combined in a comprehensive volume rendering.
Correlated Histopathology and MDCT
Having described and evaluated the histopathological heterogeneity in tissue types within lung nodules, it was possible to relate this information to the MDCT representations. MDCT data also reveals heterogeneity within lung nodules, in the graylevel, or Hounsfield Unit (HU), however it is not known if a correlation exists between the two.
Following the registration of the histopathological tissue type maps and the radiological datasets to the common coordinate system, a direct correspondence was established between the voxels in the radiological data and the tissue type labels. This labeling was used to extract out the HU values corresponding to each tissue type and statistically evaluate if a significant difference could be found.
The tissue type map was split into a series of binary masks, one for each tissue type. Each binary mask was resampled, using Lanczos resampling, to match the resolution of the micro-CT, the isolated nodule MDCT dataset, and the fixed lobe MDCT dataset. As the in vivo MDCT datasets were acquired using different scanning protocols on different MDCT systems and reconstructed with low resolution using differing reconstruction kernels, this data could not be incorporated.
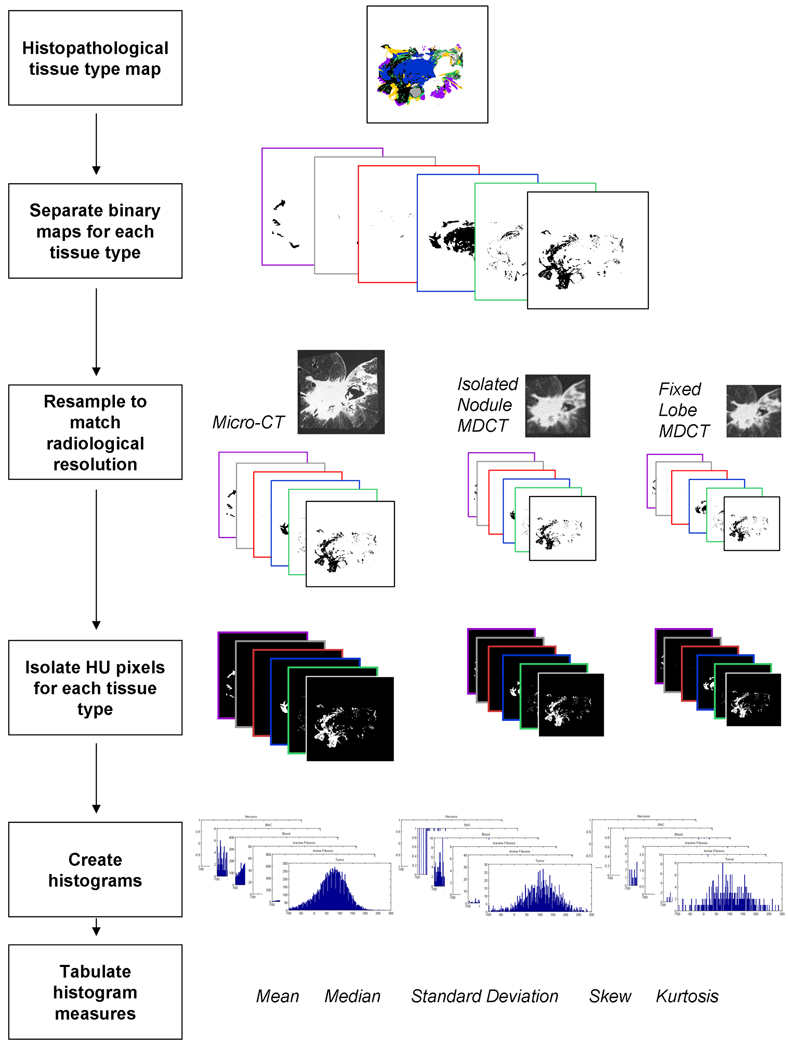
The binary masks were used to isolate pixels specific to a tissue type, from the radiological data. HU histograms were found for each tissue type and the histogram statistics were collected, including mean, median, standard deviation, skewness, and kurtosis. Ninety values were tabulated for each histological section (6 histopathological tissue types for 3 imaging modalities providing 5 histogram statistics), Figure 4.
Figure 4.
A summary diagram illustrating the method for acquiring the histogram statistical measures for each histological section. For each histological section there was a corresponding tissue type map generated in which each color represents a particular tissue type; solid grouping of cancer cells (black), cancer cells following a non-solid bronchoalveolar carcinoma pattern (purple), necrotic cells (gray), active fibroblastic stroma (green), hyaline fibrosis (blue), normal airway wall cells (yellow) and groupings of erythrocytes (red). Each tissue type map was split into a series of binary masks, one for each tissue type. Each binary mask was resampled, using Lanczos resampling, to match the resolution of the micro-CT, the isolated nodule MDCT dataset, and the fixed lobe MDCT dataset and was used to isolate pixels specific to a tissue type, from the radiological data. HU histograms were found for each tissue type and the histogram statistics were collected, including mean, median, standard deviation, skewness, and kurtosis.
Only the adenocarcinoma cases were evaluated for statistical separation in HU values based on histopathological tissue type. As only one complete dataset for squamous cell and one for neuroendocrine carcinoma were obtained, the datasets were not large enough to calculate the variance for these cancer types.
Linear mixed model analysis was used to compare the mean histogram parameters among the histological tissue types. This was followed by Tukey’s test for pairwise comparison of means between tissue types. This analysis was performed separately for each of the imaging methods (micro-CT, isolated nodule MDCT, and fixed lobe MDCT).
Results
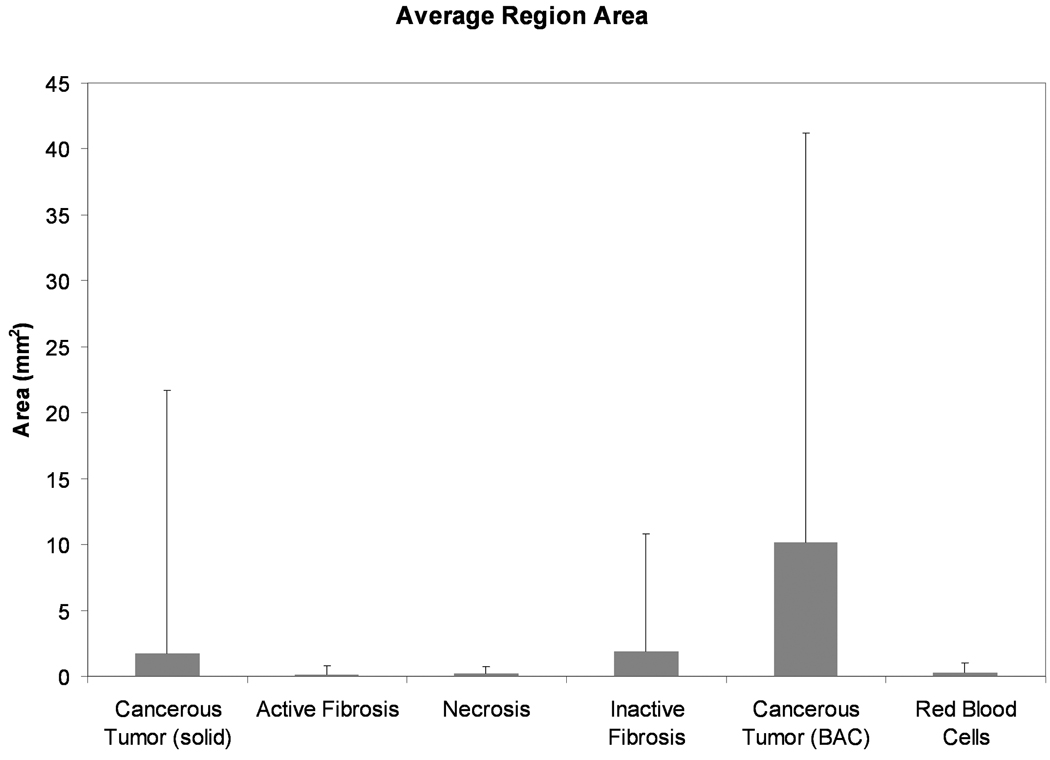
Across the adenocarcinoma cases, the solid cancerous tumor and active fibrosis tissue types had the highest number of regions, 2299 and 2260 respectively. The average size of these regions however, was quite different with the solid cancerous tumor having a mean region size of 1.7 mm2 while the active fibrosis had a mean region size of 0.17 mm2. The number of regions for necrosis, inactive fibrosis, cancerous tumor (non-solid BAC), and red blood cells were 509, 448, 216 and 193, respectively. Figure 5 shows the average areas of the tissue type regions.
Figure 5.
Graphical representation of the mean area (± SD) of the regions for each tissue type. Regions of red blood cells, necrosis and active fibroblastic stroma are the smallest while cancerous regions following a bronchioalveolar carcinoma structure (non-solid BAC) have the largest region areas.
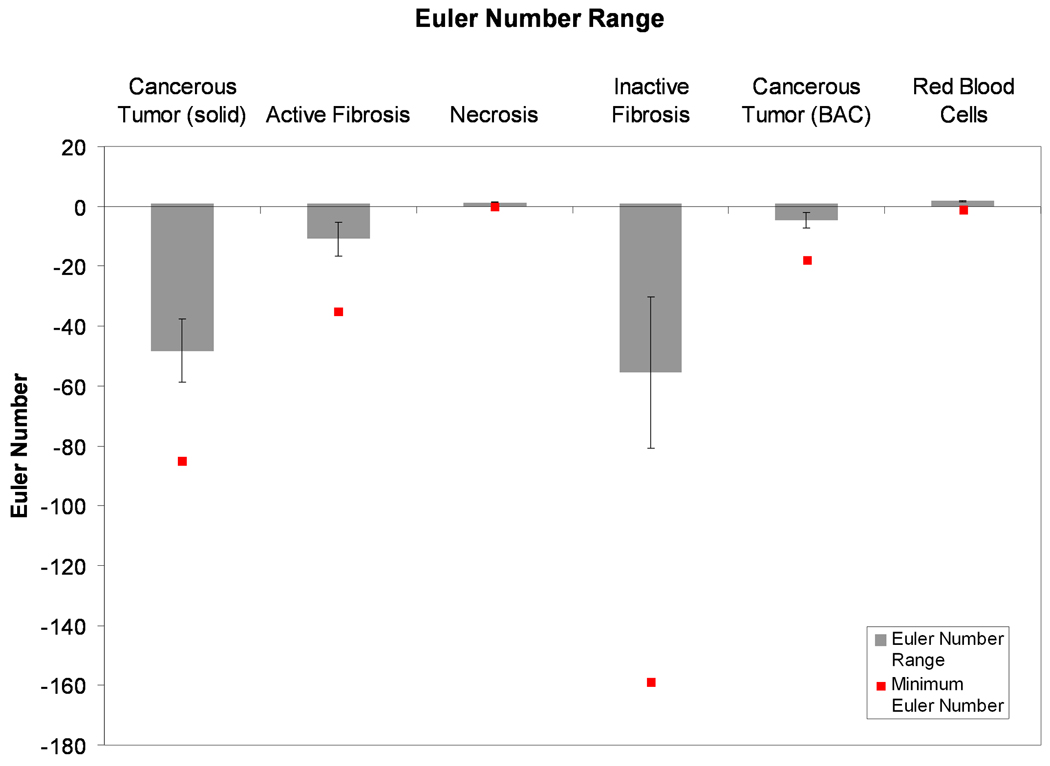
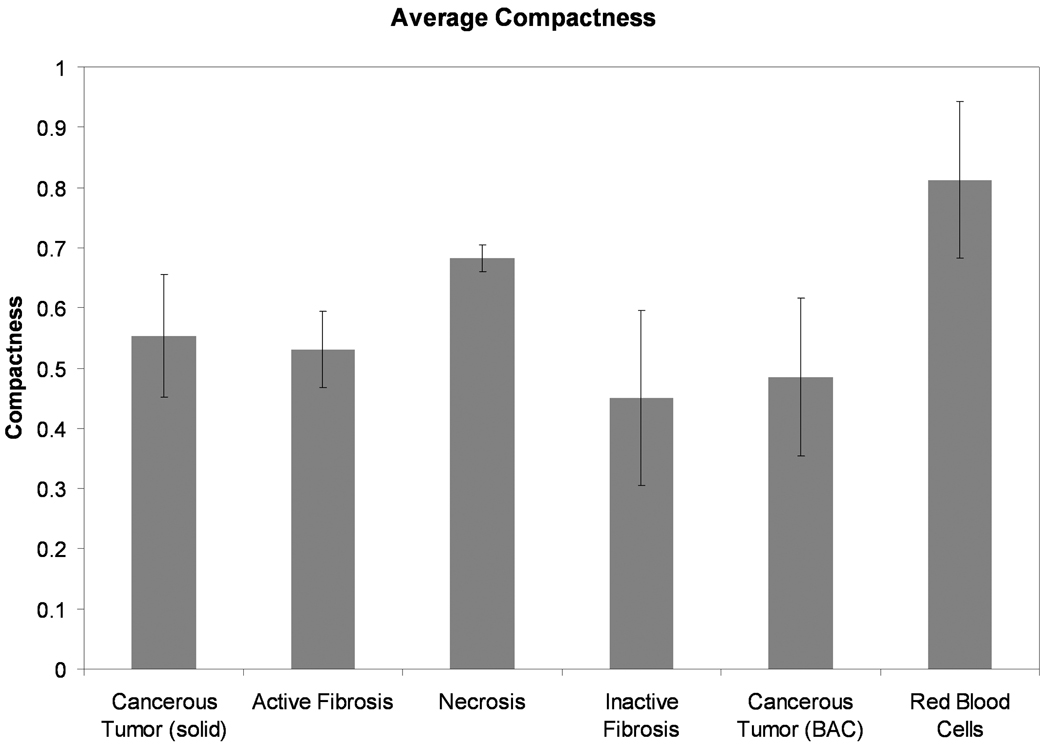
A plot of the average range of Euler numbers for each tissue type, across all datasets is shown in Figure 6. The plot clearly shows that the inactive fibrosis tissue type is the most encompassing and that necrotic and blood regions exist exclusively as islands (as seen by the global minimum Euler number). Solid cancerous tumor also presents as being more encompassing overall than active fibrosis and non-solid, BAC cancerous tumor. Figure 7 shows the average compactness for each tissue type across all the nodule datasets. From this data, necrotic regions and groupings of red blood cells have the simplest, most compact boundaries with average compactness values of 0.68 and 0.81, respectively. On average the inactive fibrosis regions have been found to contain the most complex boundaries, having the lowest overall compactness value at 0.45. Cancerous regions (both solid and non-solid BAC) and active fibrosis had comparable compactness values of 0.55, 0.49 and 0.53, respectively.
Figure 6.
The mean (± SEM) range of Euler numbers in each tissue type, across all nodule datasets. Also plotted is the overall global minimum Euler number. This plot reveals the trend that the inactive (hyaline) fibrosis and cancerous tumor tissue types tend to be encompassing while the other tissue types tend to be encompassed.
Figure 7.
The mean (± SD) compactness values for each tissue type, across all the nodule datasets. The red blood cells and necrosis regions have the most compact boundaries while the inactive (hyaline) fibrosis regions are the most complex.
MDCT to Pathology Correlation
From this analysis, it was found that the HU heterogeneity in the MDCT data of lung nodules is informative for at least some tissue types. The mean HU measure provided the greatest ability to separate the histopathological tissue classes in the MDCT data of the isolated nodule, Table I. Statistically significant separability (p < 0.0001 to p = 0.044) was found between the non-solid BAC cancerous tumor (−376.2 HU), red blood cells (−74.7 HU), solid cancerous tissue (−10.9 HU), and inactive fibrosis (25.9 HU) classes. Active fibrosis and necrotic tissue regions could not be distinguished from the solid cancerous tumor using the mean HU from the isolated nodule dataset which were −17.5 HU, −3.4 HU and −10.9 HU respectively. Complete tabulated results for the statistical analysis of the HU histogram median, standard deviation, skew and kurtosis for each tissue type, in the three datasets, is presented in the supplementary data.
Table I.
Statistical separability of the mean Hounsfield Unit (HU) across the histologically defined tissue types, for each of the three imaging datasets.
| Mean Hounsfield | ||||||||
|---|---|---|---|---|---|---|---|---|
| Micro-CT | MDCT (isolated nodule) | MDCT (fixed lobe) | ||||||
| Tissue | Mean (SE) | Tukey* | Tissue | Mean (SE) | Tukey* | Tissue | Mean (SE) | Tukey* |
| Cancer (BAC) | −353.3 (45.0) | a | Cancer (BAC) | −376.2 (32.9) | a | Cancer (BAC) | −343.6 (35.0) | a |
| Blood | −60.1 (39.3) | b | Blood | −74.7 (29.1) | b | Necrosis | −59.2 (35.0) | bc |
| Necrosis | 31.2 (36.8) | bc | Active Fibrosis | −17.5 (28.1) | c | Blood | −57.2 (28.4) | b |
| Active Fibrosis | −0.5 (35.1) | c | Cancer (solid) | −10.9 (27.8) | c | Active Fibrosis | −23.0 (27.7) | bd |
| Cancer (solid) | 8.1 (35.1 | cd | Necrosis | −3.4 (31.7) | cd | Cancer (solid) | −5.3 (26.3) | cd |
| Inactive Fibrosis | 34.7 (35.8) | d | Inactive Fibrosis | 25.9 (27.9) | d | Inactive Fibrosis | 27.8(27.3) | d |
| Significant differences have p-value from p<0.0001 (BAC vs. all other tissue types) to p=0.044 for Blood vs. Cancer (solid) | Significant differences have p-value from p<0.0001 (BAC vs. all other tissue types) to p=0.017 for Blood vs. Necrosis | Significant differences have p-value from p<0.0001 (BAC vs. all other tissue types; Blood vs. Inactive Fibrosis) to p=0.034 for Cancer (solid) vs. Inactive Fibrosis | ||||||
means with the same letter are not significantly different
The BAC cancerous tumor was easily identified as different from the other solid nodule tissue types, due to the non-solid alveolar structural arrangement of the cancer cells. A very high statistical difference in the mean (Table I), median, standard deviation, skew and kurtosis of the HU values, in the micro-CT, isolated nodule MDCT and fixed lobe MDCT of the BAC tumor was found when compared to the other tissue types (p < 0.0001).
Blood could be separated from solid cancerous tissue using the mean HU in all image sets, median HU in the isolated nodule MDCT, HU standard deviation in the isolated nodule MDCT and fixed lobe MDCT, the skew of the HU histogram in the isolated nodule dataset, and the kurtosis of the HU histogram in the fixed lobe MDCT.
Inactive fibrosis could be separated from solid cancerous tissue using the HU standard deviation in all image sets and the HU kurtosis of the micro-CT. Active fibrosis and necrosis were the least separable from solid cancerous tumor. Active fibrosis was only significantly different form solid cancerous tissue in the HU kurtosis of the fixed lobe MDCT. Necrosis was not significantly different from solid cancerous tissue in any of the datasets.
Discussion
As described, the lung cancer nodule represents a complex biomass. The static organization of histopathological tissue types within the biomass is informative for extending the current understanding of cancer biology.
Shape descriptor features were used to evaluate the regional structure of the nodules. Looking at the number and size of regions across the tissue types it was found that the active fibrosis regions were small but numerous. The inactive fibrosis regions were on average of a similar size to the solid cancerous regions, however, many more cancerous regions were present throughout the nodule volumes. Non-solid BAC cancerous tumor had the largest regional areas of all tissue types. The red blood cell category reflects only the larger vessels within the tumor and not small capillaries which were too difficult to segment, hence the proportion of blood in the nodules (Figure 2) is not indicative of the complete blood supply within the nodule.
Using the Euler number, inactive fibrosis was found to be the most encompassing tissue type. Solid cancerous tumor also had a large range of Euler numbers with the second lowest global minimum. One possible explanation for this is that the fibrosis is in response to cancer regions, with the fibrosis replacing cancer as the tumor biomass develops. The small range and zero global minimum of the Euler numbers of necrotic regions indicated this tissue type does not encompass other tissue type regions. This may be indicative of the mechanism causing necrosis to occur. Were necrosis regions formed by the cell death of only cancerous tissue, we would expect the Euler numbers for necrosis to vary in the same extent as for solid cancerous regions. However, the near zero, very small range of Euler numbers for necrosis indicate that necrotic regions likely occur from a lack of sufficient blood supply to an area of the nodule, resulting in the cell death of all tissue types in that vicinity.
As would be expected, groups of red blood cells were strongly presented as encompassed island regions. This is indicative of the blood being contained within vessel walls and separate from other tissue types. Regions of red blood cells were also found to have the most compact boundaries out of the tissue types. Again, this is intuitive given the containment in relatively cylindrical blood vessels.
The inactive fibrosis tissue type had the lowest average compactness value indicative of complex region boundaries, which is supported by the Euler number findings for this tissue type. The non-solid BAC cancerous tumor regions also had relatively low compactness values which are a reflection of the boundary of these regions following a complex alveolar structure. The solid cancerous regions had a compactness value close to the midpoint (0.5) which is likely to represent the random non-directed expansion of cancer cells, some being very complex and others being compact.
These datasets present the valuable opportunity to gain insight into the complex growth patterns of lung cancer through understanding the relationships between intermixed histological tissue types. This in-depth analysis of histological content allows for quantification of relative proportions of tissue types, which has future potential for examining the link between histological proportions and patient prognosis. This could provide insight into variations in growth rate, treatment response and time to survival.
To our knowledge, this is the first work which presents a direct, statistically significant correlation between MDCT HU heterogeneity and histological tissue type. These correlations were possible due to the development of a complex tissue acquisition and image processing model which permitted the accurate registration between histology and MDCT data.
The micro-CT dataset contained the greatest standard error in the HU due to a higher degree of noise within the dataset. This is due to the higher resolution of the micro-CT and also the absence of the same corrections that are built into the Siemens Somatom Sensation 64 MDCT system, on which the isolated nodule and fixed lobe MDCT data was acquired. The raw micro-CT data was converted to HU using an air and water phantom to determine the linear correction of grayscale values. This resulted in different HU calibrations between the micro-CT and the MDCT image sets.
The limitation of the current study was the restriction of the MDCT data to ex-vivo datasets. In this examination we have established the methodology for the creation of cross-registered multimodal datasets and we have also established a valuable baseline for tissue separability in MDCT. The greatest separability between the histological tissue types within a radiological dataset was obtained using the mean HU in the isolated nodule MDCT dataset. We believe this presents promising motivation, along with a tested method, to pursue further studies in which histological data is registered to high resolution, in-vivo MDCT and perfusion MDCT datasets, which is our future goal. In conclusion, we have performed an in-depth analysis of the cellular composition of lung cancer nodules. This analysis has included the detailed segmentation of solid and non-solid cancerous regions as well as non-cancerous tissues: necrotic, fibrotic and vascular tissue. Using these segmentations we have been able to quantitatively explore the proportions of each tissue types on a case by case basis. We have also evaluated the complete adenocarcinoma dataset to determine characteristics of the tissue specific regions and how they relate to each other. Using the segmented histological data registered to corresponding computed tomography data, we have determined that statistically significant separability using radiological HU statistics is achievable for at least some histological tissue types.
Supplementary Material
Acknowledgments
Much appreciation is given to Dr. Mark Iannettoni, Dr. Timothy Van Natta, Dr William Lynch, Dr. Kalpaj Parekh, Joan Rick-McGillin and Kelley McLauglin for assisting patient recruitment. Thank you to Dr. Jamie Weydert and Dr. Adam Bell for histopathological assessment, and to Jered Sieren, Jan Rodgers, Katherine Walters Melissa Hudson and John Morgan for technical assistance. Research for this project was supported by funding from the National Institutes of Health (R01 CA129022).
Footnotes
Publisher's Disclaimer: This is a PDF file of an unedited manuscript that has been accepted for publication. As a service to our customers we are providing this early version of the manuscript. The manuscript will undergo copyediting, typesetting, and review of the resulting proof before it is published in its final citable form. Please note that during the production process errors may be discovered which could affect the content, and all legal disclaimers that apply to the journal pertain.
The authors have no conflict of interest.
References
- 1.Sieren JC, Weydert J, Namati E, Thiesse J, Sieren JP, Reinhardt JM, Hoffman EA, McLennan G. A process model for direct correlation between computed tomography and histopathology application in lung cancer. Acad Radiol. 2010;17:169–180. doi: 10.1016/j.acra.2009.09.006. [DOI] [PMC free article] [PubMed] [Google Scholar]
- 2.Namati E, De Ryk J, Thiesse J, Towfic Z, Hoffman E, McLennan G. Large image microscope array for the compilation of multimodality whole organ image databases. Anat Rec (Hoboken) 2007;290:1377–1387. doi: 10.1002/ar.20600. [DOI] [PubMed] [Google Scholar]
- 3.Sieren JC, Weydert J, Bell A, De Young B, Smith AR, Thiesse J, Namati E, McLennan G. An automated segmentation approach for highlighting the histological complexity of human lung cancer. Ann Biomed Eng. 2010;38:3581–3591. doi: 10.1007/s10439-010-0103-6. [DOI] [PMC free article] [PubMed] [Google Scholar]
- 4.Franklin WA. Diagnosis of lung cancer: pathology of invasive and preinvasive neoplasia. Chest. 2000;117:80S–89S. doi: 10.1378/chest.117.4_suppl_1.80s. [DOI] [PubMed] [Google Scholar]
- 5.Olcott CR. Cell types and histologic patterns in carcinoma of the lung; observations on the significance of tumors containing more than one type of cell. Am J Pathol. 1955;31:975–995. [PMC free article] [PubMed] [Google Scholar]
- 6.Maeshima AM, Niki T, Maeshima A, Yamada T, Kondo H, Matsuno Y. Modified scar grade: a prognostic indicator in small peripheral lung adenocarcinoma. Cancer. 2002;95:2546–2554. doi: 10.1002/cncr.11006. [DOI] [PubMed] [Google Scholar]
- 7.Okudera K, Kamata Y, Takanashi S, Hasegawa Y, Tsushima T, Ogura Y, Nakanishi K, Sato H, Okumura K. Small adenocarcinoma of the lung: prognostic significance of central fibrosis chiefly because of its association with angiogenesis and lymphangiogenesis. Pathol Int. 2006;56:494–502. doi: 10.1111/j.1440-1827.2006.01997.x. [DOI] [PubMed] [Google Scholar]
- 8.Asamura H. Minimally invasive approach to early, peripheral adenocarcinoma with ground-glass opacity appearance. Ann Thorac Surg. 2008;85:S701–S704. doi: 10.1016/j.athoracsur.2007.10.104. [DOI] [PubMed] [Google Scholar]
- 9.Aoki T, Tomoda Y, Watanabe H, Nakata H, Kasai T, Hashimoto H, Kodate M, Osaki T, Yasumoto K. Peripheral lung adenocarcinoma: correlation of thin-section CT findings with histologic prognostic factors and survival. Radiology. 2001;220:803–809. doi: 10.1148/radiol.2203001701. [DOI] [PubMed] [Google Scholar]
- 10.Ikeda K, Awai K, Mori T, Kawanaka K, Yamashita Y, Nomori H. Differential diagnosis of ground-glass opacity nodules: CT number analysis by three-dimensional computerized quantification. Chest. 2007;132:984–990. doi: 10.1378/chest.07-0793. [DOI] [PubMed] [Google Scholar]
- 11.Sieren JC, Weydert J, Namati E, Thiesse J, Sieren JP, Reinhardt JM, Hoffman E, McLennan G. A process model for direct correlation between computed tomography and histopathology - application in lung cancer. Academic Radiology. 2009;17:169–180. doi: 10.1016/j.acra.2009.09.006. [DOI] [PMC free article] [PubMed] [Google Scholar]
- 12.Heitzman R. The Lung. St. Louis, Missouri: The C.V. Mosby Company; 1984. Radiologic-Pathologic Correlations. [Google Scholar]
- 13.Gonzalez R, Woods R. Digital Image Processing. Second ed. New Jersey: Prentice-Hall, Inc.; 2002. [Google Scholar]
- 14.Selkirk KE. Pattern and place an introduction to the mathematics of geography. Cambridge: Cambridge University Press; 1982. ed. [Google Scholar]
Associated Data
This section collects any data citations, data availability statements, or supplementary materials included in this article.


