

Abstract
Sulforaphane (SFN) is an isothiocyanate derived from cruciferous vegetables such as broccoli. The ability of SFN to inhibit histone deacetylase enzymes may be one mechanism by which it acts as a chemoprevention agent. The ability of a chemopreventive agent to specifically cause cytotoxicity in cancer, not normal cells is an important factor in determining its safety and clinical relevance. We characterized the effects of SFN in normal (PrEC), benign hyperplasia (BPH1) and cancerous (LnCap and PC3) prostate epithelial cells. We observed that 15 µM SFN selectively induced cell cycle arrest and apoptosis in BPH1, LnCap and PC3 cells but not PrEC cells. SFN treatment also selectively decreased HDAC activity, and Class I and II HDAC proteins, increased acetylated histone H3 at the promoter for P21, induced p21 expression and increased tubulin acetylation in prostate cancer cells. HDAC6 over-expression was able to reverse SFN-induced cyotoxicity. In PrEC cells, SFN caused only a transient reduction in HDAC activity with no change in any other endpoints tested. The differences in sensitivity to SFN in PrEC and PC3 are likely not due to differences in SFN metabolism or differences in phase 2 enzyme induction. From these data we conclude that SFN exerts differential effects on cell proliferation, HDAC activity and downstream targets in normal and cancer cells.
Keywords: apoptosis, chemoprevention, epigenetics, isothiocyanate, prostate cancer
1. Introduction
Epidemiologic studies suggest that cruciferous vegetable intake may lower the overall risk of prostate cancer [1, 2]. Sulforaphane (SFN) is an isothiocyanate derived from cruciferous vegetables such as broccoli and broccoli sprouts [3]. The majority of chemoprevention studies have focused on the ability of SFN to act “pre-initiation” as a potent phase 2 enzyme inducer via Keap1-Nrf2 signaling and antioxidant response element (ARE)-driven gene expression. Additional evidence also suggests that SFN suppresses tumor development during the “post-initiation” phase of cancer via induction of cell cycle arrest and apoptosis [4, 5]. Recently, a novel suppression mechanism involving the ability of SFN to inhibit histone deacetylase (HDAC) enzymes, alter histone acetylation and affect gene regulation has been reported [6–8].
Lysine acetylation and deacetylation is a dynamic process executed by histone acetyltransferases (HAT) and HDACs that can affect intermolecular interactions and/or the stability and activity of proteins. Currently there are 11 trichostatin A (TSA) sensitive HDACs which are divided into four classes (class I, IIa, IIb, and IV) according to structure, expression patterns, and subcellular localization. The class I HDACs consists of HDACs 1, 2, 3, and 8 and are expressed in all tissues. They are predominantly found in the nucleus and are mainly responsible for histone deacetylation. HDACs 4, 5, 7, and 9 belong to class IIa and have a more restricted expression pattern, being found predominantly in tissues such as muscle, brain, heart, endothelial cells, and thymocytes [9]. The class IIb HDACs consists of HDAC 6 and 10, with HDAC6 being primarily localized in the cytoplasm and targeting non-histone substrates, while little is currently known about HDAC10.
In general, addition of acetyl groups to histones by HATs promotes gene expression by creating an “open” chromatin conformation and acts as a docking site for bromo domain containing transcription machinery, thereby facilitating access to DNA and organization of transcription. Removal of acetyl groups by HDACs results in a “closed” conformation and expulsion of transcription activating components, ultimately repressing transcription. In addition to histone proteins, the acetylation of lysine residues on non-histone proteins by Class II HDACs plays a major role in many different cellular processes [10]. A well studied example is HDAC6 which has multiple non-histone substrates including α-tubulin and HSP90 [11]. The functional consequences of the acetylation and deacetylation of α-tubulin are alterations in microtubule dynamics and stability, cell migration, aggresome formation, and autophagy [12, 13]. All of these processes are critically important in regulating cell cycle arrest, misfolded protein toxicity, and cell death. Currently little is known regarding the effects of dietary HDAC inhibitors on non-histone protein acetylation, and changes in Class I and Class II HDACs.
Pharmacological HDAC inhibitors, including suberoylanilide hydroxamic acid (SAHA), valproic acid, depsipeptide, and phenyl butyrate have been shown to be effective agents against prostate cancer in cancer cell lines and in xenograft models [14, 15]. Similar to pharmacological HDAC inhibitors, SFN inhibits HDAC activity and suppresses prostate tumor growth both in vitro and in vivo [7, 8]. Furthermore, HDAC inhibitors such as SAHA, TSA, and other novel hydroxamic acids are selectively growth inhibitory and cytotoxic to cancer cells rather than normal cells [16–21]. For example, SAHA (Vorinostat) treatment in prostate cancer cells inhibited cell growth (LnCap, DU-145, and PC3) and induced cell death (LnCap and DU-145), whereas normal prostate cells (PrEC) were resistant to SAHA induced growth arrest and cell death [17]. Thus, the goal of this study was to examine the cytotoxicity of SFN in normal and cancerous prostate epithelial cell lines by characterizing the effect of SFN on cell cycle arrest, apoptosis, HDAC activity, Class I and II HDAC expression, and histone/non-histone protein acetylation.
2. Materials and methods
2.1 Cell Culture
Normal (PrEC) prostate epithelial cells were obtained from Lonza (Basel, Switzerland). Benign hyperplasia epithelial cells (BPH1) were a kind gift from Dr. Simon Hayward (Vanderbilt University Medical Center, Nashville, TN). Androgen dependent prostate cancer epithelial cells (LnCap) and androgen-independent prostate cancer epithelial cells (PC3) were obtained from American Type Tissue Collection (Manassas, VA). Cells were cultured at 5% CO2 and 37°C. PrEC cells were cultured in PrEC basal media (PrEBM) with PrEC growth media (PrEGM) SingleQuots (Lonza) and BPH1, LnCap and PC3 cells in Roswell Park Memorial Institute (RPMI) 1640 supplemented with glutamine plus 10% fetal bovine serum (FBS) (Cellgro, Manassas, VA). The cells were treated with dimethylsufoxide (DMSO) (vehicle control) or 15 µM SFN (LKT laboratories, St. Paul, MN) for the time indicated and harvested for subsequent assays. This concentration of SFN was based on previous reports showing HDAC inhibition in prostate and colon cancer cells [6, 7]. For HDAC6 over-expression 2.0 × 10⁴ cells per well were seeded in 96-well plates. For each well 20µL of Opti-MEM reduced serum media (Invitrogen) was mixed with 50ng of either empty vector (pcDNA 3.1, Invitrogen, Carlsbad, CA) or HDAC6 plasmid (cat # SC111132 Origene, Rockville, MD) and 0.1 µL of PLUS™ reagent, and incubated for 10 min at room temperature. Lipofectamine LTX™ (0.3µL) was added and the solution was incubated for 30 minutes at room temperature. The DNA mix (20µL) was added to each well and cultured for 18–24 hrs. Cells were treated with DMSO or SFN as outlined above for 24 and 48 hr. Transfection efficiency was ~50–65% using a GFP plasmid and measured by flow cytometry (Guava PCA). For protein over-expression the transfection procedure was scaled up to 12well format and western blots were performed as described below.
2.2 Western Blot Analysis
Proteins (10–20 µg) were separated by SDS-PAGE on a 4–12% bis-Tris gel (Novex, San Diego, CA) and transferred to nitrocellulose membrane (Invitrogen). Primary antibodies from Santa Cruz Biotechnologies, Santa Cruz, CA were as follows: HDAC2 (H-54) 1:200; HDAC3 1:200; HDAC4 1:200; HDAC6 1:200; HDAC8 1:200. Other primary antibodies were: HDAC1, 1µg/mL (Upstate, Billerica, MA); p21, 1:1000 (Cell Signaling, Danvers, MA); acetylated α-tubulin 1:5000 (Sigma, St. Louis, MO); poly (ADP-ribose) polymerase (PARP) (N-20) 1:2000 (BD); α-tubulin (Sigma); and β-actin, 1:5000 (Sigma). Detection was performed by using Supersignal West Femto Reagent (Thermo Scientific, Waltham MA) with image analysis on an AlphaInnotech photodocumentation system. Image quantification was determined by NIH ImageJ. Treatments were performed in triplicate.
2.3 Apoptosis/Cell Viability Assays
Cell viability was determined using the trypan blue exclusion assay. Multicaspase assay was used as a marker of apoptosis using a flow-cytometry based assay kit (Guava Technologies, Hayward, CA). Briefly, 5 × 10⁴ cells were stained in triplicate with a fluorochrome-conjugated caspase inhibitor, sulforhodamine-valyl-alanyl-aspartyl-fluoromethylketone (SR-VAD-FMK) and 7-amino-actinomycin D (7-AAD) according to the manufacturer’s instructions and analyzed on a Guava Personal Cell Analyzer (Guava PCA) (Guava Technologies).
2.4 Cell Cycle Analysis
A flow cytometric assay was performed to assess effects of SFN on cell cycle. One million cells were fixed in 70% ethanol. After fixation, cells were washed, pelleted, and resuspended in 0.04 mg/ml propidium iodide and 100 mg/ml RNase in PBS and analyzed on the Guava PCA. Multi-Cycle analysis software (Phoenix Flow Systems, San Diego, CA) was used to generate histograms and determine the number of cells in each phase of the cell cycle. Cells were treated in triplicate.
2.5 Quantitative Real-Time PCR
Total RNA was extracted using a RNeasy kit (Qiagen, Valencia, CA). Two micrograms of RNA were reverse-transcribed using the Invitrogen Super-Script® III reverse transcriptase (Invitrogen, Carlsbad, CA) according to the manufacture’s instruction. About 50ng cDNA was amplified using DyNAmo™ SYBR® Green qPCR Kit (New England Biolabs, Ipswich, MA) in a Chromo4 Real Time PCR detections system (MJ Research, Waltham, MA) using primers for p21waf1/cip1 (F:CAGACCAGCATGACAGATTTC, R:GCGGATTAGGGCTTCCTCTT, annealing temp=56°C), GSTP1 (F: GCCCTACACCGTGGTCTATT, R: TGCTGGTCCTTCCCATAGAG annealing temp = 5 8°C); H O 1 (F: CTTCTTCACCTTCCCCAAC, R: GCTCTGGTCCTTGGTGTCATA, annealing temp=58°C); NQO1 (F: AAAGGACCCTTCCGGAGTAA, R: AGGCTGCTTGGAGCAAAATA, annealing temp=58°C); β-actin F: CTTCCAGCCTTCCTTCCTGGGCATG, R: GCTCAGGAGGAGCAATGATCTTGATC, annealing temp=56°C) PCR conditions were as follows: 95°C/10 min; 40 cycles: 94°C/10 sec, annealing temperature/20 sec and 72°C/20 sec; melting curve 60–95°C read every 0.2 sec; 72°C/10 min. Cells were treated in triplicate.
2.6 LC-MS/MS
The methods for LC-MS/MS analysis were adapted from Al Janobi et al [22]. For cellular metabolite analysis, cells were treated in duplicate with SFN or vehicle for a time course up to 72 h and ~5×10⁵ cells were dedicated to MS analysis. Cell pellets were resuspended in 100 µL of 0.1% formic acid in water, vortexed and frozen at −80°C. After being thawed the samples were vortexed again and centrifuged at 11,600 × g for 5 minutes at 4°C. The supernatant was collected and acidified with 10 µL of trifluoracetic acid. The samples were centrifuged as before and the supernatants were collected and filtered through a 0.2 µm filter. For metabolite analyses in cell culture media, 500 µL of spent media was saved and immediately acidified with precooled (4°C) trifluoracetic acid (10%). The samples were centrifuged at 11,600 × g for 5 minutes at 4°C and subsequently filtered through a 0.2 µm filter.
Ten µL of sample were separated on a Shimadzu Prominence HPLC (Shimadzu, Kyoto, Japan) using a reversed-phase Phenomenex synergi 4 µm hydro RP 80Å 250 × 1.0 mm HPLC column. The flow rate was 0.1 mL/min using 0.1% formic acid in water (solution A) and 0.1% formic acid in acetonitrile (solution B). The gradient was as follows: 5% B increasing to 30% (7 min), held at 30% (6 min), washed out with 90% B (10 min) and re-equilibrated to 5% B (5 min). The LC eluent was sprayed into an API triple quad mass spectrometer 3200 (Applied Biosystems, Foster City, CA) by electrospray ionization in positive mode. Tandem mass spectrometry using multiple reaction monitoring was used to detect the analytes with the following precursor and product ions: SFN (178>114), SFN-GSH (485>114), SFN-CG (356>114), SFN-Cys (299>114), SFN-NAC (341>114). Spike and recovery experiments confirmed that >95% of all compounds were recovered following the processing protocols outlined.
2.7 HDAC activity assays
HDAC activity was assayed using the 386 well format Fluor-de-Lys HDAC activity kit (Upstate) as described in [6]. Five µg of total cell lysate were added to each well and assay was performed according to the manufacturer’s instructions. Fluorescence was measured and recorded as arbitrary fluorescence units (AFU) using a Spectra Max Gemini XS fluorescent plate reader (Molecular Devices, Sunnyvale, CA).
2.8 Chromatin Immunoprecipitation
ChIP assays were performed to examine the association of acetylated histone H3 with P21 promoter as described previously [7]. As a positive control PC3 cells were also treated with 0.3 µM Trichostatin A (Enzo Life Sciences International, Inc, Plymouth Meeting, PA) for 8 h and harvested for the ChIP assay. An acetylated histone H3 ChIP kit (Upstate) was used according to the manufacturer’s instructions. Quantification of ChIP DNA was performed by using DyNAmo™ SYBR® Green using primers for P21waf1/cip1 (F: GGTGTCTAGGTGCTCCAGGT, R: GCACTCTCCAGGAGGACACA). The immunoprecipitated DNA was normalized to input DNA and expressed as percentage of input DNA (2CT input − CT IP × 10) as described by Frank et al [23]. PCR conditions were as follows: 95°C/10 min; 40 cycles: 94°C/10 sec, 63°C/20 sec and 72C°/20 sec; melting curve 60–95°C read every 0.2 sec; 72°C/10 min. Treatments were performed in triplicate.
2.9 Statistical analysis
All experiments except LC-MS/MS experiments were done in triplicate. The acetyl-histone ChIP and the HDAC6 over-expression experiments were analyzed by Student’s t-test comparing the SFN treatment effect. The trypan blue exclusion time course was analyzed by two-way ANOVA. All other experiments were analyzed using one-way ANOVA with Dunnett’s post-test comparing the mean SFN treatment effect for PrEC against each of the other cell lines.
3. Results
3.1 SFN preferentially induced apoptosis and cell cycle arrest in BPH1, LnCap and PC3 cells
An induction of apoptosis was observed in BPH1 and PC3 cells following 48 h SFN treatment, as indicated by increases in multicaspase activity (Fig. 1A). LnCap cell showed a trend towards increased caspase activity at 48 h but it was not significantly different than the SFN effect observed in PrEC cells. No effect on cell viability in PrEC cells with a dose range of 0–15 µM for 24h was observed, as assessed by trypan blue exclusion assay (p=0.63 by one-way ANOVA). Two-way ANOVA analysis of 15 µM SFN treatment in a time course up to 72 h in PrEC cells showed no significant treatment or interaction effect, although the time effect was significant (p<0.0001) (Fig. 1B). A striking difference between PrEC cells and the other cell lines was seen in cell cycle kinetics at 24 and 48 h of SFN treatment. At 24 h SFN strongly induced a G2/M cell cycle arrest in BPH1 and PC3 cells but had no effect on cell cycle in PrEC cells (Fig. 2). Similar to previous published data [24], SFN caused significant changes in cell cycle distribution in LnCap cells at 48 h. Taken together these data provide evidence that SFN is preferentially cytotoxic to BPH1, LnCap and PC3 cells.
Figure 1.
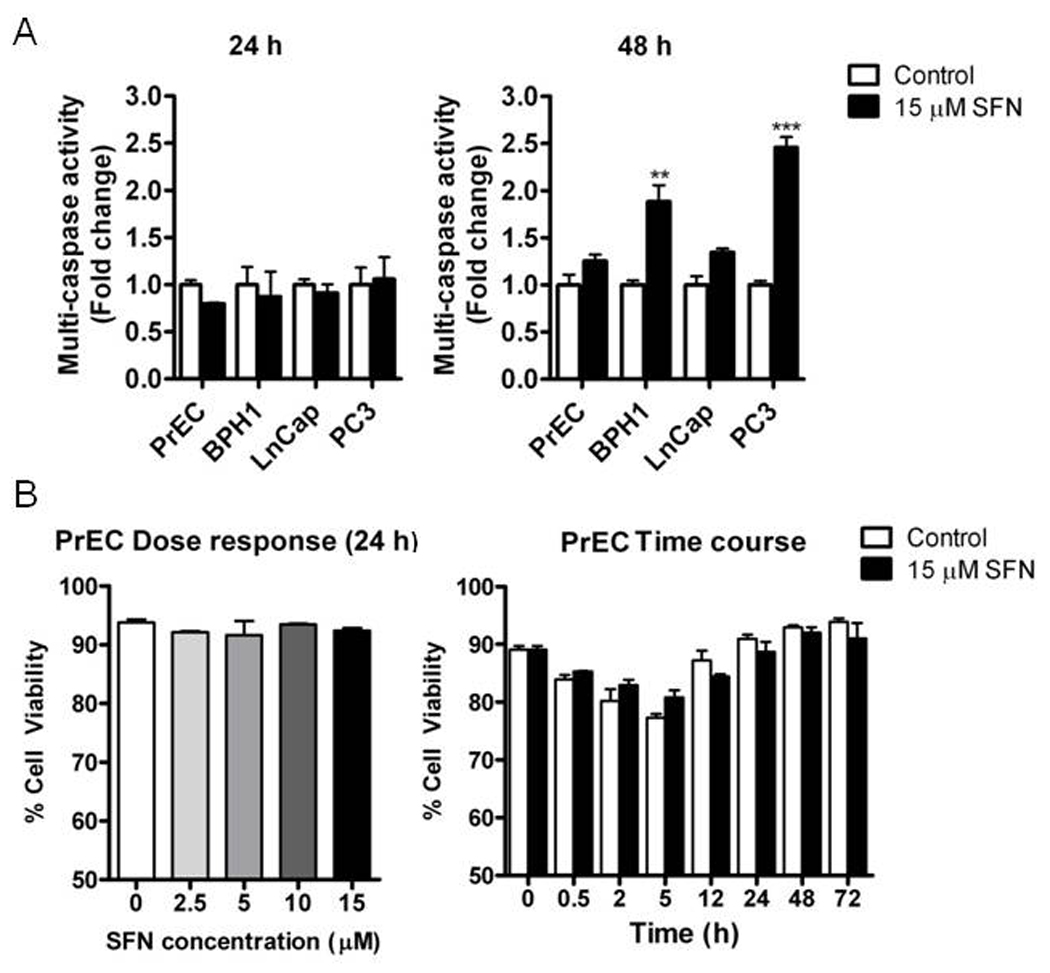
SFN preferentially induces apoptosis in BPH1 and PC3 cells. Cells were treated with DMSO (control) (white bars) or 15 µM SFN (black bars) for 24 and 48 h and harvested for apoptosis analysis. (A) Multi-caspase activity analyzed by one-way ANOVA. (B) Trypan blue exclusion assay in PrEC at increasing doses of SFN (left) and 15 µM SFN 72 h time course (right), analyzed by one-way ANOVA and two-way ANOVA, respectively. Data in graphs represent mean ± SEM (n=3). Statistical significance: **p<0.01, ***p<0.001 using Dunnett’s post-test.
Figure 2.
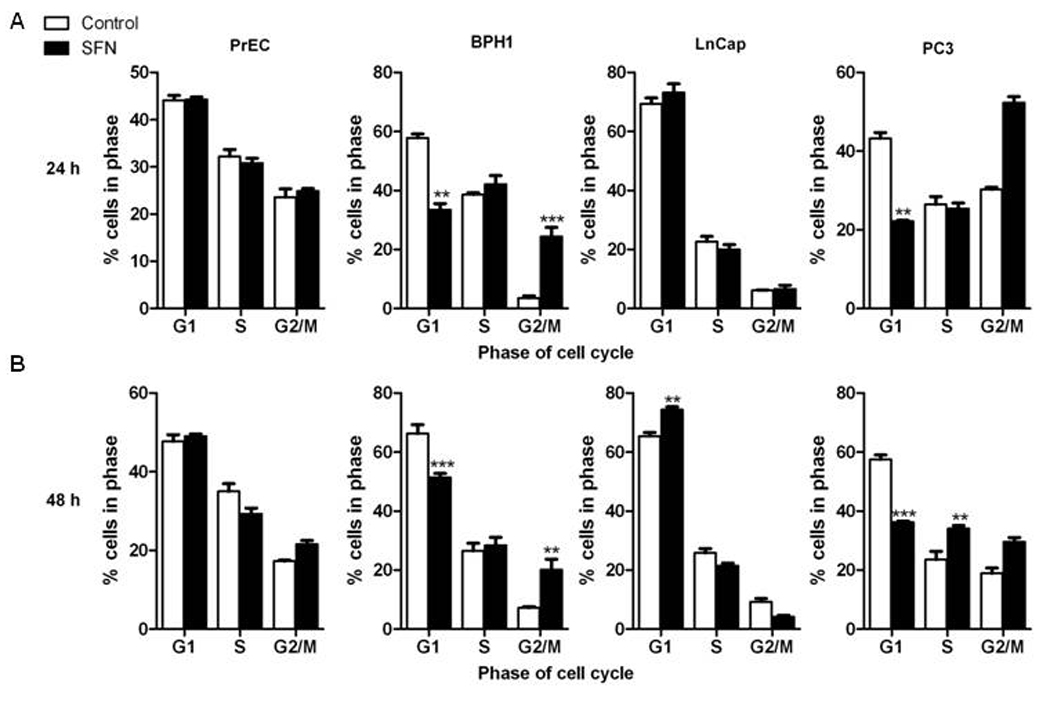
SFN preferentially induces cell cycle arrest in BPH1, LnCap and PC3 cells. Cells were treated with DMSO (control) (white bars) or 15 µM SFN (black bars) for 24 and 48 h and harvested for cell cycle analysis. Distribution of cells (in percentage) in the G1, S, and G2/M phases of the cell cycle. Data in bar graphs represent mean ± SEM (n=3). Statistical significance: **p<0.01, ***p<0.001 using Dunnett’s post-test.
3.2 Induction of phase 2 enzymes in all cell lines and relationship to SFN metabolism
The canonical chemoprevention pathway for SFN involves induction of phase 2 enzymes via activation of the Nrf2 transcription factor. We tested all four prostate cell lines for the induction of several phase 2 enzymes known to be induced by SFN: glutathione-S-transferase-π1 (GSTP1), Heme oxygenase (HO1) and NAD(P)H:quinone reductase (NQO1). No differences in the induction of HO1 and NQO1 were observed between the cell lines following 12 h SFN treatment. No induction of GSTP1 was observed at 12 h in any cell line (Fig. 3). These data indicate that SFN treatment similarly induces the phase 2 enzymes HO1 and NQO1 in normal, hyperplastic and cancerous cell lines.
Figure 3.
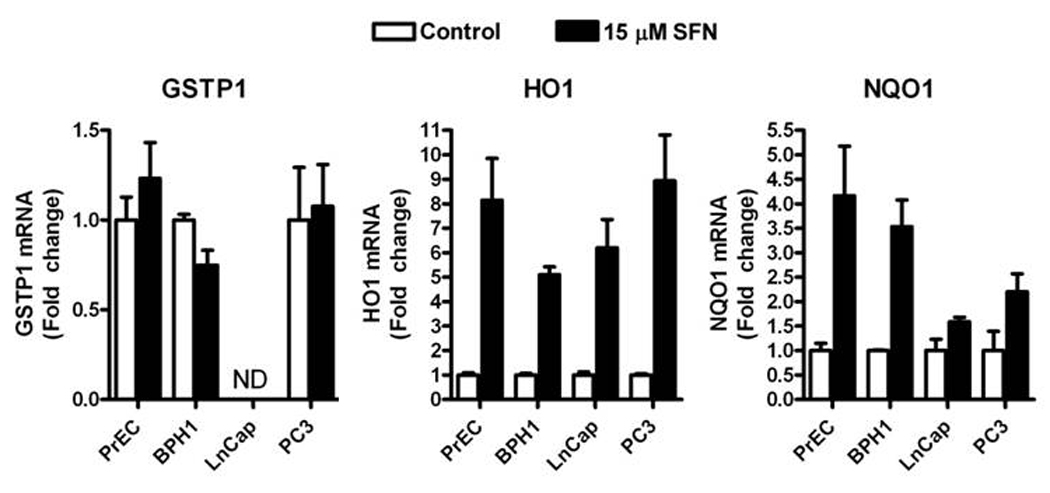
SFN increases the level of HO1 and NQO1 mRNA in PrEC, BPH1, LnCap and PC3 cells. Cells were treated with DMSO (control) (white bars) or 15 µM SFN (black bars) for 12 h and harvested for qRT-PCR. GSTP1 (left), HO1 (middle) and NQO1 (right). Data in bar graphs represent mean ± SEM (n=3). ND=none detected. Data were analyzed by 1-way ANOVA and Dunnett’s post-test.
To confirm equivalent dosing and assess any possible differences in metabolism that may have contributed to the differences observed in cell fate, SFN and its metabolites were measured in culture media and the cell lysates for all four cell lines at selected time points using LC-MS/MS. All cell lines were similar regarding the metabolism of SFN at 24 and 48h (data not shown) and therefore we chose to focus on normal PrEC and late-stage androgen independent PC3 and perform a rigorous SFN time course. The overall loss of SFN and its metabolites in both the media and in the lysate was similar in PrEC and PC3 cells, with a ~50% decrease detected after 24 h (Fig. 4A). In the cell culture media the sum of all SFN compounds was similar between the cell lines (Fig. 4A). For the individual SFN compounds a trend towards a 2–3 µM shift in metabolite ratio from free SFN to the glutathione conjugate (SFN-GSH) was observed in the PrEC media at 24, 48, and 72 h, and the cysteinyl conjugate (SFN-Cys) was detected at similar levels in the media from both cell lines (Fig. 4B). In the cell lysates, the sum of all SFN compounds was similar in both cell lines (2.8 and 2.7 nmol/mg in PrEC and PC3, respectively, at 0.5 hr) although a trend towards differences was observed at 2 and 5h (Fig. 4A). The cellular concentration of SFN-Cys, one of the putative HDAC inhibitor forms of SFN, was similar in both cell lines (Fig. 4C). The other known metabolites of SFN, cysteinyl-glycine and N-acetlycysteine (SFN-NAC) conjugates, were not detected in either the cell lysate or the culture media. Overall these metabolite data show that the metabolite profiles and exposure times/concentrations are similar between PrEC and PC3 cell lines.
Figure 4.
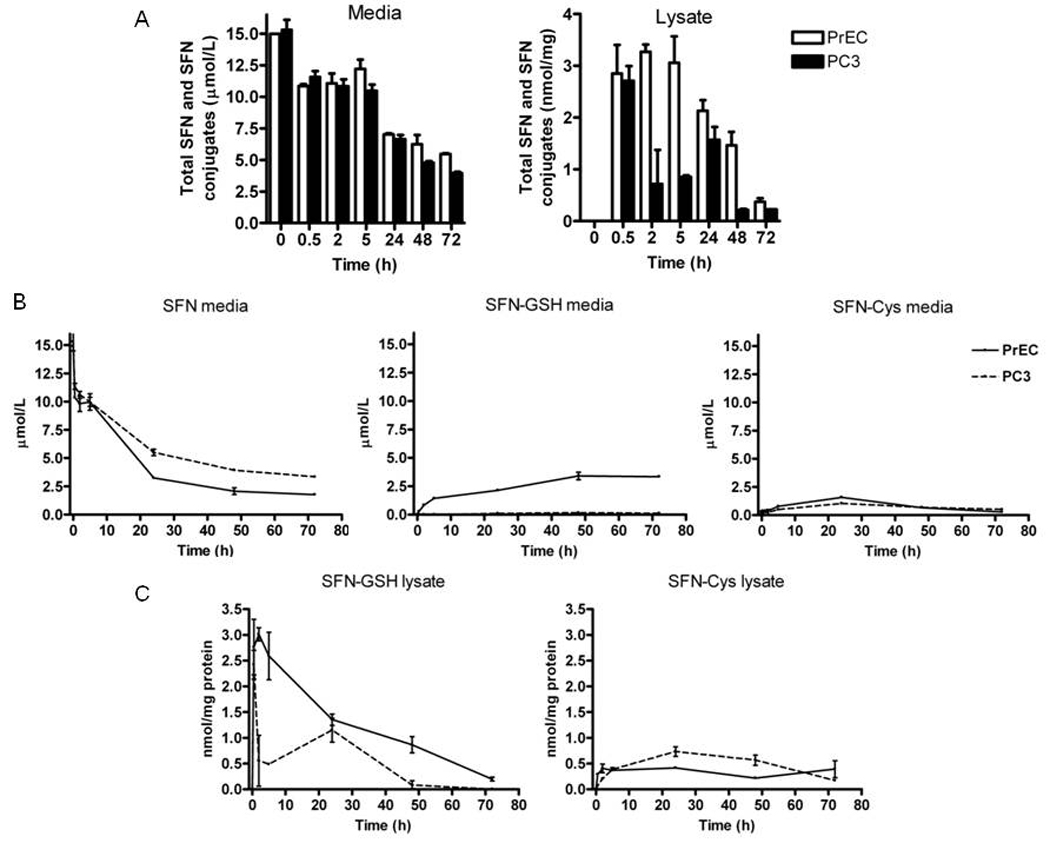
SFN is metabolized similarly in PrEC and PC3 cells. Cells were treated and harvested as described in the methods. (A) The sum of all SFN compounds in culture media (left) and lysate (right) from PrEC (white bars) and PC3 (black bars). (B) Concentrations of free SFN (left), SFN-GSH (middle) and SFN-Cys (right) in the cell culture media from PrEC (dashed lines) and PC3 (solid lines). (C) Concentrations of SFN-GSH (left) and SFN-Cys (right) in the cell lysates. Data in bar graphs represent mean ± SEM (n=2).
3.3 SFN inhibits HDAC activity in prostate cells
At 24 h HDAC inhibition was observed in all cell lines and LnCap was the only line to have significantly greater HDAC inhibition compared to PrEC cells (Fig. 5). By 48 h SFN induced HDAC inhibition was sustained in BPH1, LnCap and PC3 cells but not in PrEC, suggesting a transient inhibition of HDAC activity in normal prostate cells.
Figure 5.
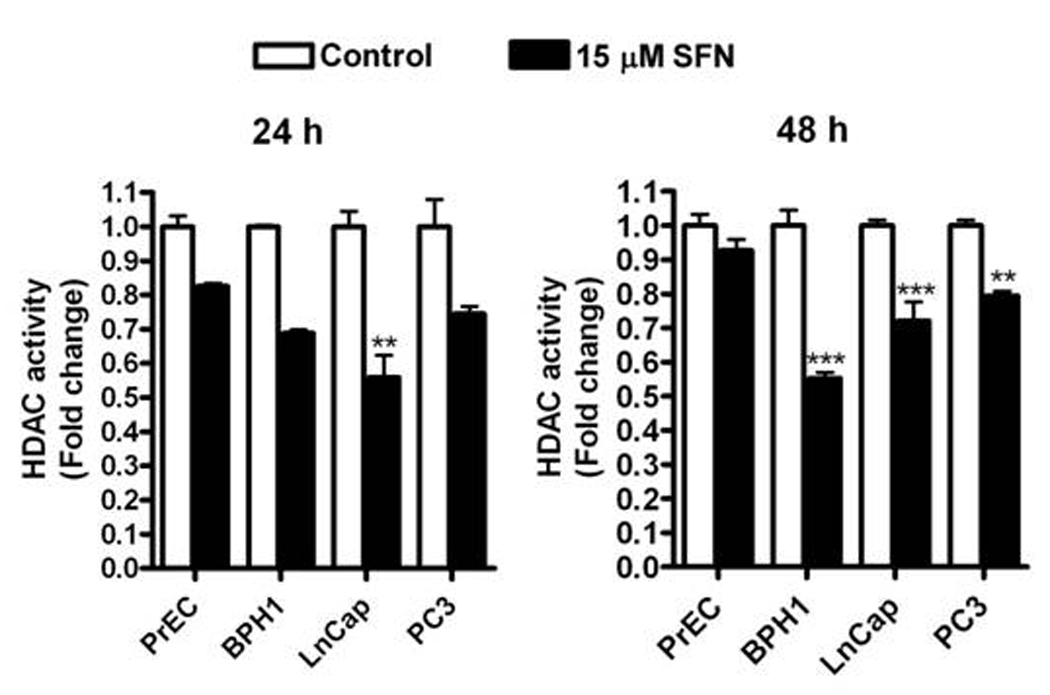
SFN selectively reduces HDAC activity in BPH1, LnCap and PC3 but not normal PrEC prostate cells. Cells were treated with DMSO (control) (white bars) or 15 µM SFN (black bars) for 24 and 48 h and harvested for HDAC activity. Data in bar graphs represent mean ± SEM (n=3). Statistical significance: **p<0.01, ***p<0.001 using Dunnett’s post-test.
3.4 SFN selectively decreases HDAC protein expression in BPH1, LnCap and PC3 cells
Class I HDACs (1,2,3,8) and Class II HDACs (4,6) were evaluated by immunoblotting (Fig. 6). No change in Class I HDAC protein expression was apparent with SFN treatment in PrEC cells. In BPH1 cells the protein levels of HDAC2 and HDAC3 were decreased at 48 h after SFN treatment. In LnCap cells the only class I HDAC to decrease was HDAC3 at 48 h after SFN treatment. In PC3 cells the protein levels of HDAC3 was decreased at 48 h after SFN treatment (Fig. 6A). Among the Class II HDACs, HDAC4 protein expression decreased in all cell lines at one or both time points depending on the cell line. The other class II HDAC tested, HDAC6, showed the most robust and consistent decrease in protein level in BPH1, LnCap and PC3 cells at both 24 and 48 h after SFN treatment. This decrease in HDAC6 was not observed in PrEC cells (Fig. 6B). To assess the possibility that changes in HDAC6 protein expression contribute to the SFN mediated cell death, HDAC6 was over-expressed in PC3 cells followed by SFN treatment. Over-expression of HDAC6 protected PC3 cells from the SFN-induced decrease in cell viability (Fig. 7).
Figure 6.
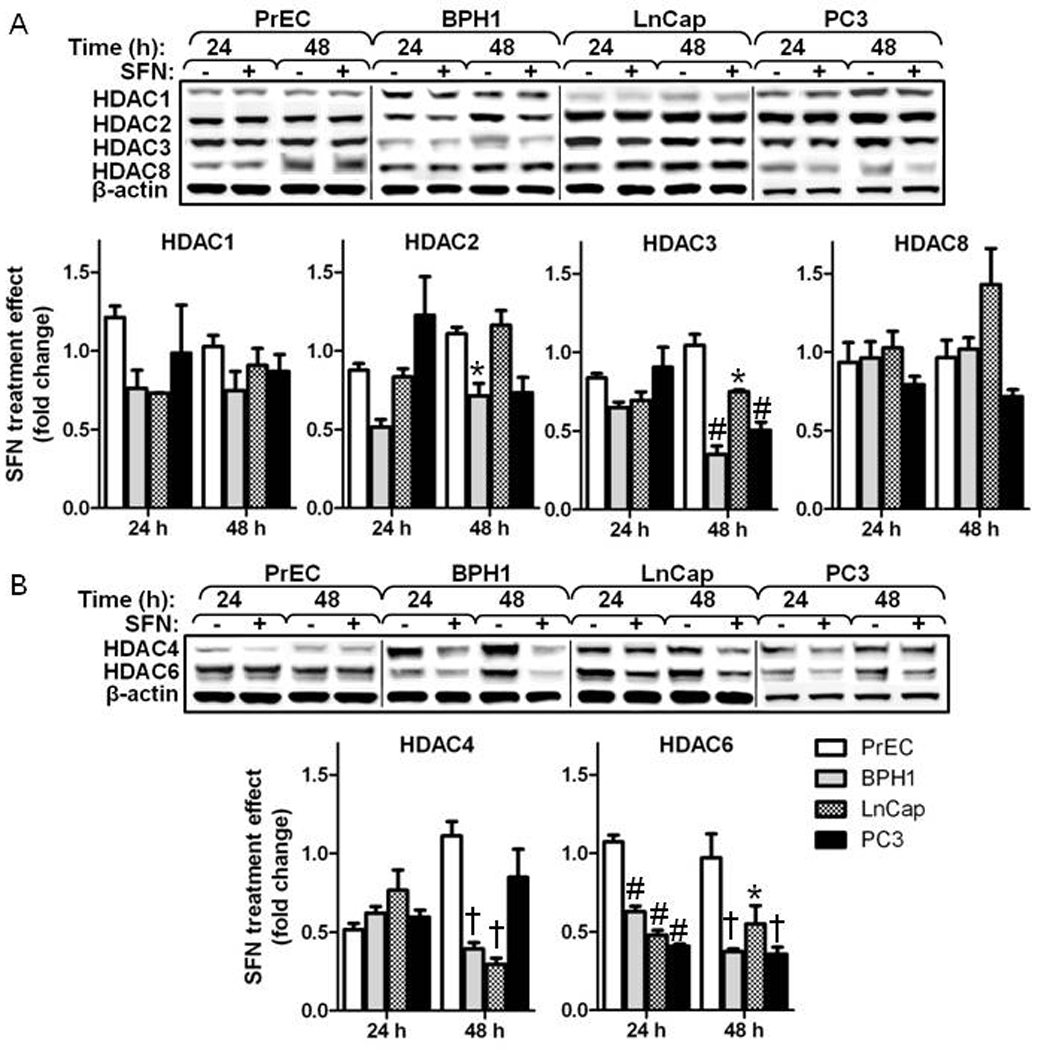
SFN selectively reduces several class I and class II HDAC proteins in BPH1, LnCap and PC3 but not normal PrEC prostate cells. Western blot and densitometry of class I (A) and class II (B) HDACs at 24 and 48 h. Data in bar graphs represent mean ± SEM (n=3). Statistical significance: *p<0.01, #p<0.01 †p<0.001 using Dunnett’s post-test comparing PrEC to the other cell lines within each time point.
Figure 7.
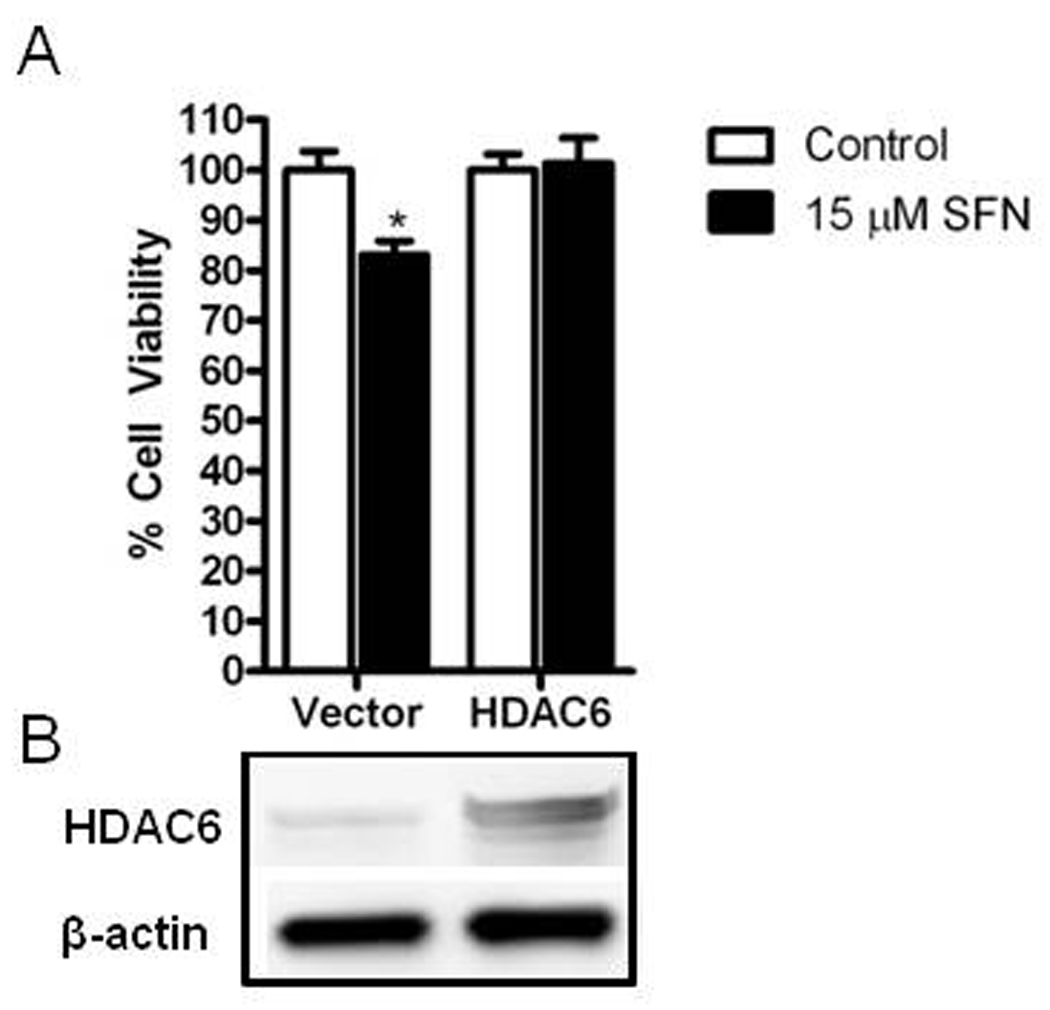
HDAC6 over-expression blocks SFN induced growth inhibition in PC3 cells. A) Cells were transfected with empty vector or HDAC6 and treated with DMSO (control) (white bars) or 15 µM SFN (black bars) for 48 hr and assayed for cell proliferation. Data in bar graphs represent mean ± SEM (n=3). Statistical significance: *p<0.05 comparing SFN effect in vector versus SFN effect in HDAC6 treated groups using Student’s t-test. B) Western blots depicting relative expression levels of HDAC6 in empty vector and HDAC6 transfected cells.
3.5 SFN increases acetylated histone association on the P21 promoter and increases acetylation of cytosolic protein targets in BPH1, LnCap and PC3 cells
P21 is commonly upregulated by HDAC inhibitors via increased acetylated histones associating with its promoter [25–27]. We observed an increase in acetylated histone H3 at the P21 promoter in PC3 cells (Fig. 8A) at a level comparable to the positive control treatment (TSA) (data not shown). No increase in acetylation at the P21 promoter was observed in PrEC cells after SFN treatment. An increase in histone acetylation at the P21 promoter after SFN treatment in BPH1 cells has previously been reported [7]. Concomitant with the increased association of acetylated histones to the P21 promoter, SFN treatment preferentially increased P21 mRNA (data not shown) and protein levels in BPH1, LnCap and PC3 but not PrEC cells (Fig. 8B). The induction of p21 protein was so strong in LnCap cells that induction in BPH1 and PC3 did not reach significance in Dunnett’s post-test but clearly demonstrated a trend for increased p21 in those cell lines.
Figure 8.
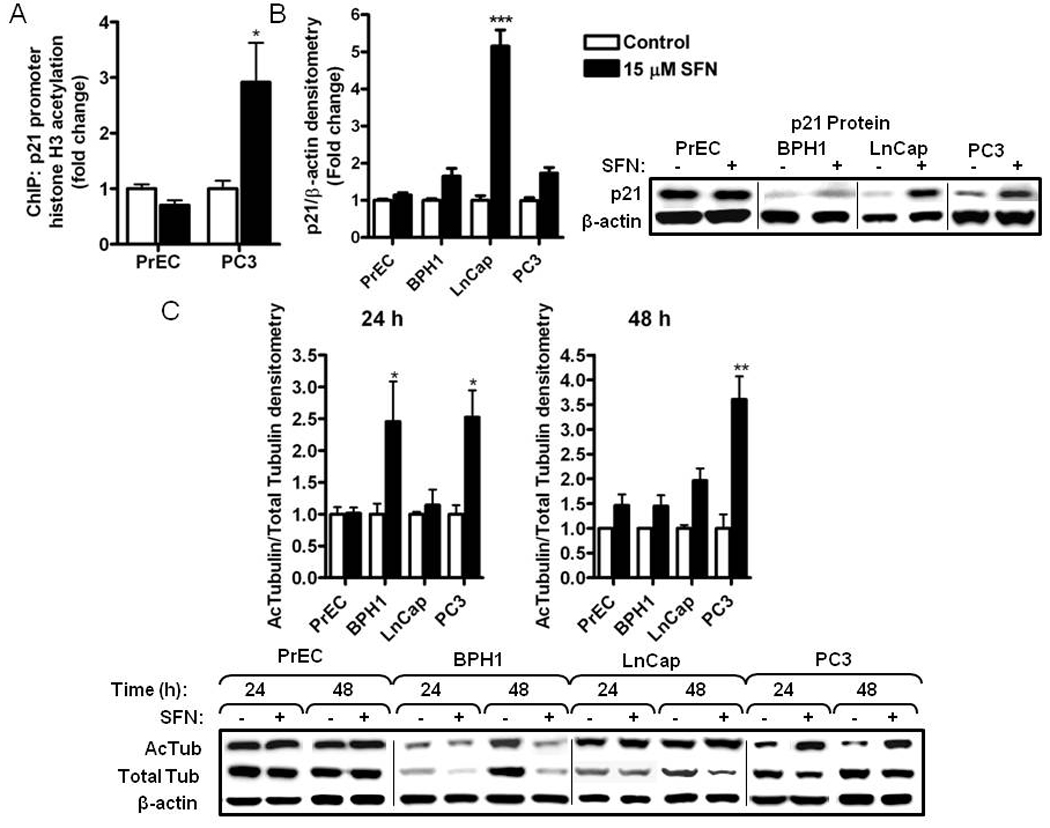
SFN treatment selectively induces histone H3 acetylation at the P21 promoter, p21 protein and tubulin acetylation in BPH1, LnCap and PC3 but not normal PrEC prostate cells. Cells were treated with DMSO (control) (white bars) or 15 µM SFN (black bars) for the time indicated and harvested for ChIP or western blots. (A) ChIP for acetylated histone H3 at the P21 promoter at 48 h. For normalization between samples the immunoprecipitated DNA was expressed as percentage of input DNA (2CT input − CT IP × 10) and shown as fold change compared to control treatments. TSA was included as a positive control for histone acetylation (data not shown). Data were analyzed by Student’s t-test; *p<0.05. (B) Densitometry and western blots for p21 protein at 24 h. (C) Western blot and densitometry of acetylated tubulin and total tubulin at 24 and 48 h. Data in bar graphs represent mean ± SEM (n=3). Data for B and C were analyzed by one-way ANOVA; *p<0.05, **p<0.01, ***p<0.001 using Dunnett’s post-test.
Recent attention has focused on the non-histone deacetylation targets of HDACs. One example is α-tubulin acetylation which is regulated by HDAC6 and is linked to downstream apoptotic mechanisms [28, 29]. An increase in acetylated α-tubulin was detected with SFN treatment in BPH1, LnCap and PC3 cells but not in PrEC cells (Fig. 8C). These results indicate that SFN can increase both histone H3 acetylation and α-tubulin acetylation in BPH1, LnCap and PC3 cells while having no effect in normal PrEC prostate cells.
4. Discussion
It is well documented that SFN can target cancer cells through multiple chemopreventive mechanisms but here we show for the first time that SFN selectively targets benign hyperplasia cells and cancerous prostate cells while leaving the normal prostate cells unaffected. Importantly, SFN selectively induced cell cycle arrest and apoptosis, specifically in hyperplastic and cancer cells. These findings regarding the relative safety of SFN to normal tissues has significant clinical relevance as the use of SFN moves towards use in human clinical trials. In addition, a reduction in HDAC activity and down-regulation of select class I and class II HDAC proteins followed by an increase in acetylation of histone H3 at the P21 promoter and increased acetylation of α-tubulin occurred specifically in the hyperplastic and cancer cells, not normal cells. Together these results highlight the use of dietary SFN as a safe and relatively non-toxic chemopreventive agent that could be readily achieved by simple and affordable incorporation of SFN rich foods in the diet.
The level of HDAC activity within a cell can be altered via direct inhibition of the HDAC enzyme and changes in HDAC protein levels. Previous reports indicate that SFN and its metabolites SFN-Cys and SFN-NAC can directly inhibit HDACs [6, 7, 30], and in this report we show that SFN can also decrease protein levels of several different HDACs. We also observed that the HDAC inhibition in PrEC cells is more transient than in the other prostate cancer cell lines. The overall metabolite profiles for PrEC and PC3 cells were similar, particularly in the levels of SFN-Cys, the putative active HDAC inhibitor. Although small changes were observed between metabolite ratios in culture media and final metabolite concentrations in cell lysates, it is unlikely that a 2–3 µM difference would exert a significant biological effect that would account for the marked increase in apoptosis and cell cycle arrest in PC3 cells. In contrast, a significant reduction in HDAC protein level was observed in BPH1, LnCap and PC3 cells which produced a greater and more persistent reduction in HDAC activity. It is possible that the differential responses in HDAC activity, HDAC protein levels and ultimately downstream acetylation of histone and non-histone targets may contribute to the differential cell fate responses observed after SFN treatment.
Over-expression of Class I HDACs has been reported in prostate cancer tumors [31, 32]. Moreover, the effects of the inhibition of Class I HDACs on cycle arrest and apoptosis has been shown previously [32, 33]. Colon cancer cells treated with 3,3′-Diindolylmethane (DIM), an indole found in cruciferous vegetables, induced proteasome mediated degradation of HDACs 3 and 8, acetylation of histone H3 at the P21 promoter and ultimately induced a G2/M cell cycle arrest and apoptosis [33]. Another report showed that siRNA knockdown of HDAC3 in SW480 colon cancer cells increased acetylated H4-K12 at the P21 promoter, induced p21 expression and potentiated butyrate induced cell cycle arrest and growth inhibition [34]. These reports are consistent with what we observed in our experiments, namely SFN treatment caused a decrease in several class I HDAC proteins, induction of histone acetylation at the P21 promoter and ultimately induction of G2/M cell cycle arrest and apoptosis. This provides compelling evidence that the changes in class I HDAC proteins and histone acetylation may be responsible the changes in cell fate.
Herein we also provide evidence that HDAC6 is potentially responsible for the selective effects of SFN in cancer cells. Tubulin is a well known deacetylation target for HDAC6 and this process has an impact on microtubule dynamics [11, 13]. Importantly, tubulin deacetylation increases the turnover rate of microtubules, and over-expression of HDAC6 augments this process [12]. Decreases in HDAC6 activity [30] and increases in tubulin acetylation [42] after SFN treatment has previously been reported by others [35]. In Gibbs et. al., researchers found that HDAC6 over-expression in LnCap cells abrogated the effects of SFN on HSP90 acetylation and inhibited its association with the androgen receptor (AR) providing further evidence that inhibition of HDAC6 was a specific target for sulforaphane [30]. Here we confirm the decrease in HDAC6 protein levels in LnCap after SFN treatment reported by Gibbs et. al. and report that HDAC6 protein levels decrease in BPH1 and PC3 cells after SFN treatment. Interestingly, Gibbs et. al. reported that changes in HDAC6 activity ultimately affected the activity of the AR but here we show that HDAC6 is also decreased in PC3 cells which are AR negative indicating that the effect of SFN on AR may not be the only target for HDAC6. Importantly, over-expression of HDAC6 rescues PC3 cells from SFN-induced decreases in cell viability suggesting that HDAC6 plays a critical role in mediating its cytotoxicity. Thus, the inhibition of HDAC6 could play a key role in the stabilization of microtubule networks, disruption of tubulin polymerization and ultimately contribute to the mitotic cell cycle arrest observed with SFN treatment [35, 36]. The link between tubulin acetylation and selectively toxicity towards cancer cells has been reported after treatment with the HDAC6 specific inhibitor tubacin. Treatment with tubacin induced a dose and time dependent increase in α-tubulin acetylation and ultimately cytoxicity in several multiple myeloma cell lines and bone marrow plasma cells but had no effect in normal peripheral blood mononuclear cells [37]. Autophagy is another cellular response that is partially mediated by HDAC6 because it functions to deliver polyubiquitinated proteins to aggresomes for degradation by binding both the polyubiquitinated proteins and the microtubule motor dynein [28]. SFN treatment in PC3 and LNCaP prostate cells results in an induction of autophagy and partial inhibition of cytochrome C release and apoptosis [38]. The decrease in HDAC6 protein we observed in BPH1, LnCap and PC3 cells may divert the cell fate away from survival (autophagy) towards cell death (apoptosis) by decreasing the formation of autophagic aggresomes. Further investigation into the potential roles of α-tubulin acetylation and the reduction in HDAC6 levels in the selectivity of SFN will provide insights into the mechanisms for SFN mediated cancer cell death.
The use of HDAC inhibitors in cancer prevention and treatment has become an intense area of research. These data provide further support for the relevance of SFN as a dietary HDAC inhibitor and chemopreventive agent by showing that SFN can selectively target BPH1, LnCap and PC3 prostate cells while leaving normal PrEC prostate cells virtually unaffected. This selectivity opens the door to a wide range of new scientific questions that will help in understanding the many mechanisms of action for SFN. The data presented here, taken with the previous reports of SFN action, show that SFN can target multiple steps in the carcinogenesis pathway and make it a promising cancer prevention agent.
Acknowledgements
This work was supported by NIH grants CA090890, CA122906, Oregon AES (OR00735), instrument grant 1S10RR022589, and the Environmental Health Science Center at Oregon State University (NIEHS P30 ES00210). We acknowledge support from Dr. Jan Fred Stevens, Dr. Heather Kuipers and Jeffrey Morré with LC-MS/MS analyses, and technical assistance from Dr. Carmen Wong, Karin Hardin, and Dr. Yang Song.
Abbreviations
- AFU
arbitrary fluorescence units
- GST
Glutathione-S-transferase
- HAT
histone acetyltransferase
- HDAC
histone deacetylase
- HO1
heme oxygenase
- NQO1
NAD(P)H:quinone reductase
- ROS
reactive oxygen species
- SAHA
suberoylanilide hydroxamic acid
- SFN
sulforaphane
- SFN-GSH
sulforaphane-glutathione
- SFN-Cys
sulforaphane-cysteine
- SFN-NAC
sulforaphane-N-acetylcysteine
- TSA
trichostatin A
Footnotes
Conflict of Interest
The authors have declared no conflict of interest
References
- 1.Kristal AR, Lampe JW. Brassica vegetables and prostate cancer risk: a review of the epidemiological evidence. Nutr Cancer. 2002;42:1–9. doi: 10.1207/S15327914NC421_1. [DOI] [PubMed] [Google Scholar]
- 2.Higdon JV, Delage B, Williams DE, Dashwood RH. Cruciferous vegetables and human cancer risk: epidemiologic evidence and mechanistic basis. Pharmacol Res. 2007;55:224–236. doi: 10.1016/j.phrs.2007.01.009. [DOI] [PMC free article] [PubMed] [Google Scholar]
- 3.Fahey JW, Zhang Y, Talalay P. Broccoli sprouts: an exceptionally rich source of inducers of enzymes that protect against chemical carcinogens. Proc Natl Acad Sci USA. 1997;94:10367–10372. doi: 10.1073/pnas.94.19.10367. [DOI] [PMC free article] [PubMed] [Google Scholar]
- 4.Singh SV, Herman-Antosiewicz A, Singh AV, Lew KL, et al. Sulforaphane-induced G2/M Phase Cell Cycle Arrest Involves Checkpoint Kinase 2-mediated Phosphorylation of Cell Division Cycle 25C. J. Biol. Chem. 2004;279:25813–25822. doi: 10.1074/jbc.M313538200. [DOI] [PubMed] [Google Scholar]
- 5.Wang L, Liu D, Ahmed T, Chung FL, et al. Targeting cell cycle machinery as a molecular mechanism of sulforaphane in prostate cancer prevention. Int J Oncol. 2004;24:187–192. [PubMed] [Google Scholar]
- 6.Myzak MC, Karplus PA, Chung FL, Dashwood RH. A novel mechanism of chemoprotection by sulforaphane: inhibition of histone deacetylase. Cancer Res. 2004;64:5767–5774. doi: 10.1158/0008-5472.CAN-04-1326. [DOI] [PubMed] [Google Scholar]
- 7.Myzak MC, Hardin K, Wang R, Dashwood RH, Ho E. Sulforaphane inhibits histone deacetylase activity in BPH-1, LnCaP and PC-3 prostate epithelial cells. Carcinogenesis. 2006;27:811–819. doi: 10.1093/carcin/bgi265. [DOI] [PMC free article] [PubMed] [Google Scholar]
- 8.Myzak MC, Tong P, Dashwood WM, Dashwood RH, Ho E. Sulforaphane retards the growth of human PC-3 xenografts and inhibits HDAC activity in human subjects. Exp Biol Med (Maywood) 2007;232:227–234. [PMC free article] [PubMed] [Google Scholar]
- 9.Haberland M, Montgomery RL, Olson EN. The many roles of histone deacetylases in development and physiology: implications for disease and therapy. Nat Rev Genet. 2009;10:32–42. doi: 10.1038/nrg2485. [DOI] [PMC free article] [PubMed] [Google Scholar]
- 10.Yang XJ, Seto E. HATs and HDACs: from structure, function and regulation to novel strategies for therapy and prevention. Oncogene. 2007;26:5310–5318. doi: 10.1038/sj.onc.1210599. [DOI] [PubMed] [Google Scholar]
- 11.Hubbert C, Guardiola A, Shao R, Kawaguchi Y, et al. HDAC6 is a microtubule-associated deacetylase. Nature. 2002;417:455–458. doi: 10.1038/417455a. [DOI] [PubMed] [Google Scholar]
- 12.Matsuyama A, Shimazu T, Sumida Y, Saito A, et al. In vivo destabilization of dynamic microtubules by HDAC6-mediated deacetylation. Embo J. 2002;21:6820–6831. doi: 10.1093/emboj/cdf682. [DOI] [PMC free article] [PubMed] [Google Scholar]
- 13.Boyault C, Sadoul K, Pabion M, Khochbin S. HDAC6, at the crossroads between cytoskeleton and cell signaling by acetylation and ubiquitination. Oncogene. 2007;26:5468–5476. doi: 10.1038/sj.onc.1210614. [DOI] [PubMed] [Google Scholar]
- 14.Korkmaz CG, Fronsdal K, Zhang Y, Lorenzo PI, Saatcioglu F. Potentiation of androgen receptor transcriptional activity by inhibition of histone deacetylation--rescue of transcriptionally compromised mutants. J Endocrinol. 2004;182:377–389. doi: 10.1677/joe.0.1820377. [DOI] [PubMed] [Google Scholar]
- 15.Butler LM, Agus DB, Scher HI, Higgins B, et al. Suberoylanilide hydroxamic acid, an inhibitor of histone deacetylase, suppresses the growth of prostate cancer cells in vitro and in vivo. Cancer Res. 2000;60:5165–5170. [PubMed] [Google Scholar]
- 16.Xu WS, Parmigiani RB, Marks PA. Histone deacetylase inhibitors: molecular mechanisms of action. Oncogene. 2007;26:5541–5552. doi: 10.1038/sj.onc.1210620. [DOI] [PubMed] [Google Scholar]
- 17.Dokmanovic M, Perez G, Xu W, Ngo L, et al. Histone deacetylase inhibitors selectively suppress expression of HDAC7. Mol Cancer Ther. 2007;6:2525–2534. doi: 10.1158/1535-7163.MCT-07-0251. [DOI] [PubMed] [Google Scholar]
- 18.Ungerstedt JS, Sowa Y, Xu WS, Shao Y, et al. Role of thioredoxin in the response of normal and transformed cells to histone deacetylase inhibitors. Proc Natl Acad Sci USA. 2005;102:673–678. doi: 10.1073/pnas.0408732102. [DOI] [PMC free article] [PubMed] [Google Scholar]
- 19.Atadja P, Gao L, Kwon P, Trogani N, et al. Selective growth inhibition of tumor cells by a novel histone deacetylase inhibitor, NVP-LAQ824. Cancer Res. 2004;64:689–695. doi: 10.1158/0008-5472.can-03-2043. [DOI] [PubMed] [Google Scholar]
- 20.Piekarz R, Bates S. A review of depsipeptide and other histone deacetylase inhibitors in clinical trials. Curr Pharm Des. 2004;10:2289–2298. doi: 10.2174/1381612043383980. [DOI] [PubMed] [Google Scholar]
- 21.Kelly WK, Richon VM, O'Connor O, Curley T, et al. Phase I clinical trial of histone deacetylase inhibitor: suberoylanilide hydroxamic acid administered intravenously. Clin Cancer Res. 2003;9:3578–3588. [PubMed] [Google Scholar]
- 22.Al Janobi AA, Mithen RF, Gasper AV, Shaw PN, et al. Quantitative measurement of sulforaphane, iberin and their mercapturic acid pathway metabolites in human plasma and urine using liquid chromatography-tandem electrospray ionisation mass spectrometry. J Chromatogr B Analyt Technol Biomed Life Sci. 2006;844:223–234. doi: 10.1016/j.jchromb.2006.07.007. [DOI] [PubMed] [Google Scholar]
- 23.Frank SR, Schroeder M, Fernandez P, Taubert S, Amati B. Binding of c-Myc to chromatin mediates mitogen-induced acetylation of histone H4 and gene activation. Genes Dev. 2001;15:2069–2082. doi: 10.1101/gad.906601. [DOI] [PMC free article] [PubMed] [Google Scholar]
- 24.Herman-Antosiewicz A, Xiao H, Lew KL, Singh SV. Induction of p21 protein protects against sulforaphane-induced mitotic arrest in LNCaP human prostate cancer cell line. Mol Cancer Ther. 2007;6:1673–1681. doi: 10.1158/1535-7163.MCT-06-0807. [DOI] [PubMed] [Google Scholar]
- 25.Richon VM, Sandhoff TW, Rifkind RA, Marks PA. Histone deacetylase inhibitor selectively induces p21WAF1 expression and gene-associated histone acetylation. Proc Natl Acad Sci USA. 2000;97:10014–10019. doi: 10.1073/pnas.180316197. [DOI] [PMC free article] [PubMed] [Google Scholar]
- 26.Ocker M, Schneider-Stock R. Histone deacetylase inhibitors: Signalling towards p21cip1/waf1. The International Journal of Biochemistry & Cell Biology. 2007;39:1367–1374. doi: 10.1016/j.biocel.2007.03.001. [DOI] [PubMed] [Google Scholar]
- 27.Bruserud O, Stapnes C, Ersvaer E, Gjertsen BT, Ryningen A. Histone deacetylase inhibitors in cancer treatment: a review of the clinical toxicity and the modulation of gene expression in cancer cell. Curr Pharm Biotechnol. 2007;8:388–400. doi: 10.2174/138920107783018417. [DOI] [PubMed] [Google Scholar]
- 28.Rodriguez-Gonzalez A, Lin T, Ikeda AK, Simms-Waldrip T, et al. Role of the aggresome pathway in cancer: targeting histone deacetylase 6-dependent protein degradation. Cancer Res. 2008;68:2557–2560. doi: 10.1158/0008-5472.CAN-07-5989. [DOI] [PubMed] [Google Scholar]
- 29.Simms-Waldrip T, Rodriguez-Gonzalez A, Lin T, Ikeda AK, et al. The aggresome pathway as a target for therapy in hematologic malignancies. Mol. Genet. Metab. 2008;94:283–286. doi: 10.1016/j.ymgme.2008.03.012. [DOI] [PMC free article] [PubMed] [Google Scholar]
- 30.Gibbs A, Schwartzman J, Deng V, Alumkal J. Sulforaphane destabilizes the androgen receptor in prostate cancer cells by inactivating histone deacetylase 6. Proc Natl Acad Sci USA. 2009:16663–16668. doi: 10.1073/pnas.0908908106. [DOI] [PMC free article] [PubMed] [Google Scholar]
- 31.Nakagawa M, Oda Y, Eguchi T, Aishima S, et al. Expression profile of class I histone deacetylases in human cancer tissues. Oncol Rep. 2007;18:769–774. [PubMed] [Google Scholar]
- 32.Weichert W, Roske A, Gekeler V, Beckers T, et al. Histone deacetylases 1, 2 and 3 are highly expressed in prostate cancer and HDAC2 expression is associated with shorter PSA relapse time after radical prostatectomy. Br J Cancer. 2008;98:604–610. doi: 10.1038/sj.bjc.6604199. [DOI] [PMC free article] [PubMed] [Google Scholar]
- 33.Li Y, Li X, Guo B. Chemopreventive agent 3,3'-diindolylmethane selectively induces proteasomal degradation of class I histone deacetylases. Cancer Res. 70:646–654. doi: 10.1158/0008-5472.CAN-09-1924. [DOI] [PMC free article] [PubMed] [Google Scholar]
- 34.Spurling CC, Godman CA, Noonan EJ, Rasmussen TP, et al. HDAC3 overexpression and colon cancer cell proliferation and differentiation. Mol Carcinog. 2008;47:137–147. doi: 10.1002/mc.20373. [DOI] [PubMed] [Google Scholar]
- 35.Azarenko O, Okouneva T, Singletary KW, Jordan MA, Wilson L. Suppression of microtubule dynamic instability and turnover in MCF7 breast cancer cells by sulforaphane. Carcinogenesis. 2008;29:2360–2368. doi: 10.1093/carcin/bgn241. [DOI] [PMC free article] [PubMed] [Google Scholar]
- 36.Jackson SJ, Singletary KW. Sulforaphane: a naturally occurring mammary carcinoma mitotic inhibitor, which disrupts tubulin polymerization. Carcinogenesis. 2004;25:219–227. doi: 10.1093/carcin/bgg192. [DOI] [PubMed] [Google Scholar]
- 37.Hideshima T, Bradner JE, Wong J, Chauhan D, et al. Small-molecule inhibition of proteasome and aggresome function induces synergistic antitumor activity in multiple myeloma. Proc Natl Acad Sci USA. 2005;102:8567–8572. doi: 10.1073/pnas.0503221102. [DOI] [PMC free article] [PubMed] [Google Scholar]
- 38.Herman-Antosiewicz A, Johnson DE, Singh SV. Sulforaphane Causes Autophagy to Inhibit Release of Cytochrome c and Apoptosis in Human Prostate Cancer Cells. Cancer Res. 2006;66:5828–5835. doi: 10.1158/0008-5472.CAN-06-0139. [DOI] [PubMed] [Google Scholar]