Abstract
Background & Aims
Cholestasis contributes to hepatocellular injury and promotes liver carcinogenesis. We created a mouse model of chronic cholestasis to study its effects on progression of cholangiocarcinoma and the oncogenes involved.
Methods
To induce chronic cholestasis, Balb/c mice were given 2 weekly intraperitoneal injections of diethylnitrosamine (DEN); 2 weeks later, some mice also received left and median bile duct ligation (LMBDL), and then 1 week later, were fed DEN, in corn oil, weekly by oral gavage (DLD). Liver samples were analyzed by immunohistochemical and biochemical assays; expression of Mnt and c-Myc were reduced by injection of small inhibitor RNAs.
Results
Chronic cholestasis was induced by DLD and accelerated progression of cholangiocarcinoma, compared with mice given only DEN. Cystic hyperplasias, cystic atypical hyperplasias, cholangiomas, and cholangiocarcinoma developed in the DLD group at weeks 8, 12, 16 and 28, respectively. LMBDL repressed expression of microRNA (miR)-34a and Let-7a, upregulating Lin-28B, HIF-1α, HIF-2α, and miR-210. Upregulation of Lin-28B might inhibit let-7a, which is associated with development of cystic hyperplasias, cystic atypical hyperplasias, cholangiomas, and cholangiocarcinoma. Knockdown of c-Myc reduced progression of cholangiocarcinoma whereas knockdown of Mnt accelerated its progression. Downregulation of miR-34a expression might upregulate c-Myc. The upregulation of miR-210 via HIF-2α was involved in downregulation of Mnt. Activation of the miR-34a–c-Myc and HIF-2α–miR-210–Mnt pathways caused c-Myc to bind the E-box element of cyclin D1, instead of Mnt, resulting in cyclin D1 upregulation.
Conclusion
DLD induction of chronic cholestasis accelerated progression of cholangiocarcinoma, which is mediated by downregulation of miR-34a, upregulation miR-210, and replacement of Mnt by c-Myc in binding to cyclin D1.
Keywords: Liver disease, transcriptional regulation, cell cycle, carcinogenesis, DNA binding
Cholangiocarcinoma (CCA) is a devastating cancer originating from the neoplastic transformation of the biliary epithelium. CCA can be classified as either intra- or extrahepatic based on its site of origin along the biliary tree.1 Intrahepatic CCA includes mass-forming type, periductal-infiltrating type and intraductal growth type. Mass-forming type is found in the liver parenchyma, the periductal-infiltrating type grows mainly longitudinally along the bile duct, and the intraductal growth type grows toward the lumen of the bile duct. The risk factors of CCA include primary sclerosing cholangitis, hepatobiliary flukes, caroli disease, choledochal cysts, bile duct adenoma, biliary papillomatosis, hepatolithiasis, chronic viral hepatitis, chronic heavy alcohol intake, obesity, chronic non-alcoholic liver disease, and old age.2–3 Cholestasis is the retention of normal bile constituents, including toxic bile acids, within the liver. Chronic cholestasis and inflammation are common features of CCA progression2 and several liver diseases, such as primary biliary cirrhosis, primary sclerosing cholangitis, viral hepatitis, alcoholic liver disease, biliary atresia and sepsis. Genetically engineered mouse models and chemically induced rat and hamster models have been used to study CCA.4 Each of these models have value for investigating the mechanisms regulating CCA progression. Common bile duct ligation (CBDL) and partial hepatic bile duct ligation are common cholestatic liver injury models. The rapid progression to death by CBDL limits its application in any long term liver carcinogenesis studies. Left or right bile duct ligation are used as an acute cholestasis model in mice. It is not ideal for studying chronic cholestatic liver injury. In this study, we established a mouse model of intrahepatic CCA that closely mimics human disease progression.
c-Myc is a basic helix-loop-helix-leucine zipper transcription factor that binds to E-box sequences as part of a heterodimeric complex with another basic helix-loop-helix-leucine zipper protein, Max, to activate transcription. Max can also heterodimerize with the c-Myc antagonist Mnt to bind to the E-box elements but represses transcription. Thus, the relative levels of Myc-Max and Mnt-Max heterocomplexes dictate whether target genes are activated or repressed.5 c-Myc target gene cyclin D1 is a CCA molecular biomarker and aberrant expression of cyclin D1 contributes to dedifferentiation and cell proliferation in CCA.6
There are several factors that can influence c-Myc and Mnt expression in liver cancer. miR-34a and let-7 are c-Myc negative regulators that are commonly downregulated in liver cancer.7, 8 Liver cancer induces hypoxia and the tumor cells adapt by increasing the synthesis of hypoxia-inducible factor (HIF). Elevated levels of HIF-1α and HIF-2α are commonly found in hepatocellular carcinoma (HCC).9 miR-210 expression is also upregulated in HCC 10 via by HIF-1α or HIF-2α.11 The Mnt 3’UTR contains multiple miR- 210 binding sites and is a known target for miR-210.11 Our previous data showed that there is a switch from Mnt-Max to c-Myc-Max binding to the E-box element of cyclin D1 during liver injury induced by either common bile duct ligation (CBDL) or by left hepatic bile duct ligation (LHBDL) in mice.5 In this study, we used a LMBDL mouse model with DEN to investigate more deeply about cholestasis-accelerated CCA progression.
MATERIALS AND METHODS
Materials
α-32P-dCTP and γ-32P ATP was purchased from PerkinElmer (Boston, MA). All other reagents were of analytical grade and obtained from commercial sources.
Animal surgery and experimental conditions
The mouse procedure protocols, use, and the care of the animals were reviewed and approved by the Institutional Animal Care and Use Committee at the University of Southern California. A midline abdominal skin and muscle incision from seven week old male Balb/c mice was made to expose the xiphoid process for the LMBDL procedure (Fig. 1A). A moistened cotton gauze was used to lift the median and left lobe. The left lobe was gently pulled onto the skin of the left abdomen and the median lobe onto the skin of the right abdomen. The hepatic bile duct after the mergence of the left and median hepatic bile duct and before the mergence of the right and caudate hepatic bile duct was gently isolated with microdissecting forceps and ligated with a 6-0 silk suture. The ligation of the bile duct to the gall bladder was performed. The gallbladder was removed to avoid cholecystitis. The peritoneum was closed with a silk suture. The postoperative management of these mice is described in the Supplementary Methods.
Figure 1. The effect of LMBDL on the hepatobiliary system and survival rate.
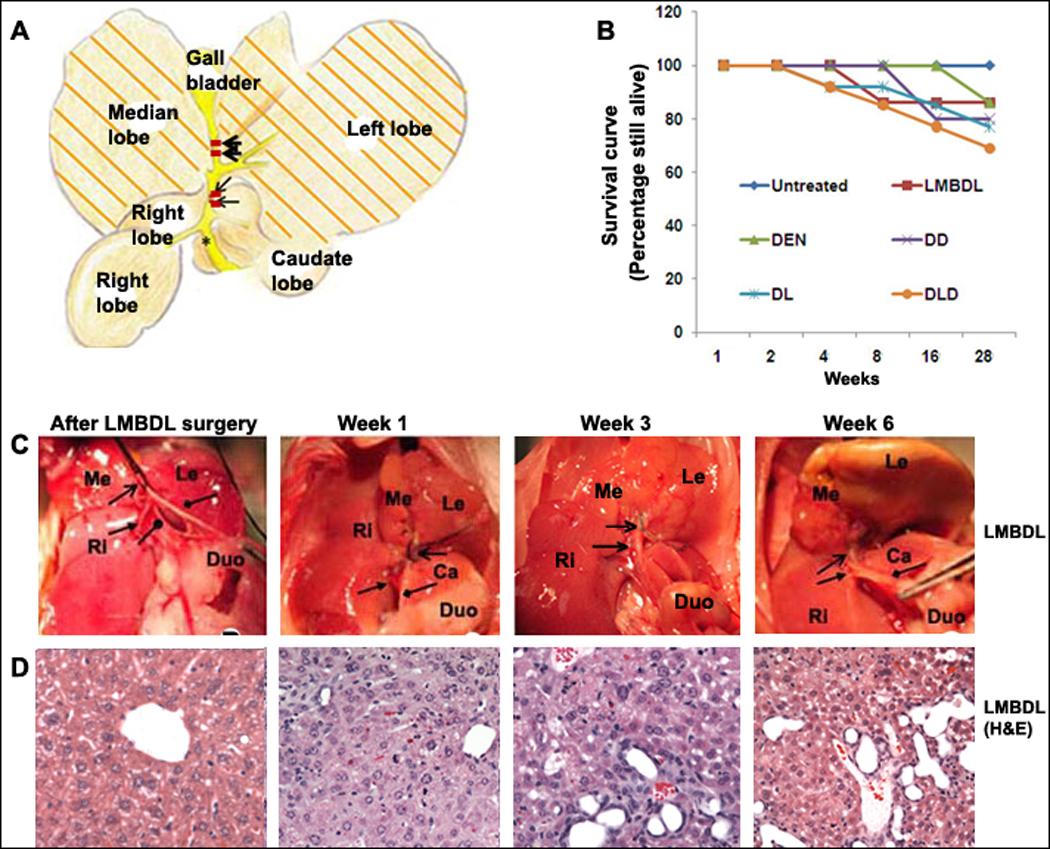
A) A diagram of the ligation position for LMBDL. B) Survival curve of mice with different treatments. Mice treated with LMBDL (6 of 7), DEN (6 of 7), DD (8 of 10), DL (10 of 13) and DLD (10 of 14) exhibited a high survival rate at 28 weeks. C) The hepatobiliary system after 1, 3 and 6 weeks. Arrow end type (↑) =position of left and median bile duct ligation, triangle arrow end type= right hepatic bile duct, rhombus arrow end type= common bile duct, circle arrow end type=caudate hepatic bile duct. D) H&E staining of the livers from the LMBDL mice after the indicated time points (100X).
The mice were divided into 6 groups and given the following treatments: group 1, sham operated, group 2, DEN only (2 separate weekly IP injections at 100mg/kg body weight), group 3, LMBDL only, group 4, DEN in corn oil at 25mg/kg/week (once a week) by oral gavage, 2 weeks after the second DEN IP injection (DD), group 5, LMBDL after 2 weeks of the second DEN IP injection (DL), and group 6, LMBDL 2 weeks after the second DEN IP injection and DEN in corn oil at 25mg/kg/week (once a week) by oral gavage 1 week after LMBDL (DLD). Mice from each group were examined at 1, 2, 4, 8, 12, 16 and 28 weeks after the start of the treatments. The mortality rate of the treated animals at different time-points is shown in the Supplementary Table 1.
Morphological and immunohistochemical analysis
Liver tissues from the left and median lobes were embedded in paraffin, sectioned, and stained with either haematoxylin & eosin (H&E), Sirius Red, or TUNEL as previously described.5 Proliferating cell nuclear antigen (PCNA) staining was performed according to the manufacturer’s suggested protocol (Invitrogen, CA). Liver lesions were diagnosed as either cystic hyperplasias, cystic atypical hyperplasias, cholangiomas or CCA as previously described.12 Slides were immunostained with antibodies to either HIF-1α, HIF-2α, c-Myc (Cell signaling, MA), CD3, myeloperoxidase (Neomarkers, CA), or F4/80 (Cellscience, MA). All sections were counterstained with haematoxylin. Immunohistochemical quantification was shown in Supplementary Methods.
Hydroxyproline, alanine aminotransferase and bilirubin assays
Hydroxyproline content of the liver tissues from the ligated lobes was measured as previously described.13 Serum and liver homogenate bilirubin was determined by a total bilirubin kit (Thermo Electron Corp., MA). Serum ALT level was determined by the ALT reagent (Cliniqa Corp., CA).
c-Myc and Mnt siRNA knockdown assay
The Mnt shRNA, c-Myc shRNA, scrambled lentiviral shRNA and packaging system were purchased from Open Biosystems (Rockford, IL). Viral harvesting was done following the manufacturer's protocol. A total of 1×10⁵ HuH-7 cells were infected at a multiplicity of 20 plaque-forming units/cells for 24 hours. 2×10⁹ transducing units (final volume 0.1mL) were injected into the tail vein of the mouse using the hydrodynamic tail vein injection method.14 In order to maintain a high level of c-Myc or Mnt knockdown for 16 weeks, repeated tail vein injections were done at week 1, 2, 4, 6, 8, 10, 12 and 14.
Electrophoretic mobility shift assay (EMSA) and supershift assays
The cyclin D1 DNA probe (−425 to −446 of the mouse E-box region) was 32P-end-labeled. EMSA and supershift assays were done as previously described.5
Chromatin immunoprecipitation (ChiP) assays
The primers for the mouse cyclin D1 promoter region from −477 to −266 upstream from the major transcriptional start site are shown in Supplementary methods. ChIP assays on mouse livers (n = 4) was done using a ChiP Kit (Millipore, CA) following a modified protocol.15
Northern blot assays
Total RNA was isolated from the ligated lobes of all the different treatment groups by TRIzol (Invitrogen). Northern blot analysis for c-Myc, cyclin D1, Mnt, Max and β-actin were done as previously described.5 Optimized wash temperatures were used to prevent cross-hybridization by using Ultrahyb-Oligo (Ambion, Austin, TX). Oligonucleotide probes for miR-210, let-7a and miR-34a for the miRNA Northern were from Exiqon, Inc (Woburn, MA).
Western blot assays
Nuclear protein was isolated from the ligated lobes as previously described.5 Western blot analysis was done using antibodies to c-Myc, Mnt, cyclin D1, Max, HIF-1α, HIF-2α and Histone H3 (Cell signaling, MA) as we described.5
Statistical Analysis
Data are given as mean ± standard error. Statistical analysis was performed using analysis of variance followed by Fisher's test for multiple comparisons. Significance was defined as p<0.05. Densitometric measurements using Quantity One Software (Bio-Rad) were done to assess for changes in expression. Densitometric values were derived from at least three mice for each time point.
RESULTS
1. LMBDL had a low mortality rate and accelerated liver injury
The current BDL models either had massive liver damage but high mortality or a high survival rate but greatly reduced liver damage.5, 16 Mice with LMBDL surgery displayed reduced activity during the first week but regained normal activity after 2 weeks. Jaundice was seen after 3 days in all animals subjected to LMBDL. The LMBDL was considered a failure if the mice did not exhibit any symptoms of jaundice. We performed a successful LMBDL surgery in 175 of 188 Balb/c mice (93%) and of those 175 mice, 162 mice were able to recover completely (Fig. 1B, Supplementary Table 1). Morbidity of LMBDL, DL and DLD at week 28 was 14% (1/7), 23% (3/13) and 29% (4/13), respectively. The cause of death in DL and DLD at week 28 was associated with ascites.
We examined the changes to the hepatobiliary system after 1, 3 and 6 weeks post surgery (Fig. 1C–D). Our results showed that LMBDL alone caused cholangiofibrosis and bile duct proliferation in the ligated lobes (Supplementary Fig. 1A–B). Animals treated with LMBDL, DL and DLD showed a sharp increase in bilirubin levels at week 1, remained at high levels for up to week 8 and then decreased steadily thereafter. On week 28, the serum bilirubin level in LMBDL, DL and DLD groups was 2.8, 7.8 and 10.3 fold higher compared to day 0, respectively (Fig. 2A). DEN by itself was ineffective in the induction of bilirubin. The bilirubin level in the ligated lobes was 2 fold higher compared to the unligated lobes on week 28 in LMBDL, DL and DLD (Supplementary Fig. 2). For the LMBDL, DL and DLD mice, there was an acute increase in ALT levels after week 1 but steadily decreased thereafter (Fig. 2B). At week 28, the ALT levels in the LMBDL, DL and DLD groups were 6.2, 10.7 and 13.4 fold higher compared to the control group, respectively. Thus, LMBDL alone can lead to an increase of serum bilirubin and ALT levels. These levels are further elevated by the addition of DEN.
Fig. 2. Assessment of liver damage and histopathological features in the ligated lobes of the treated mice.
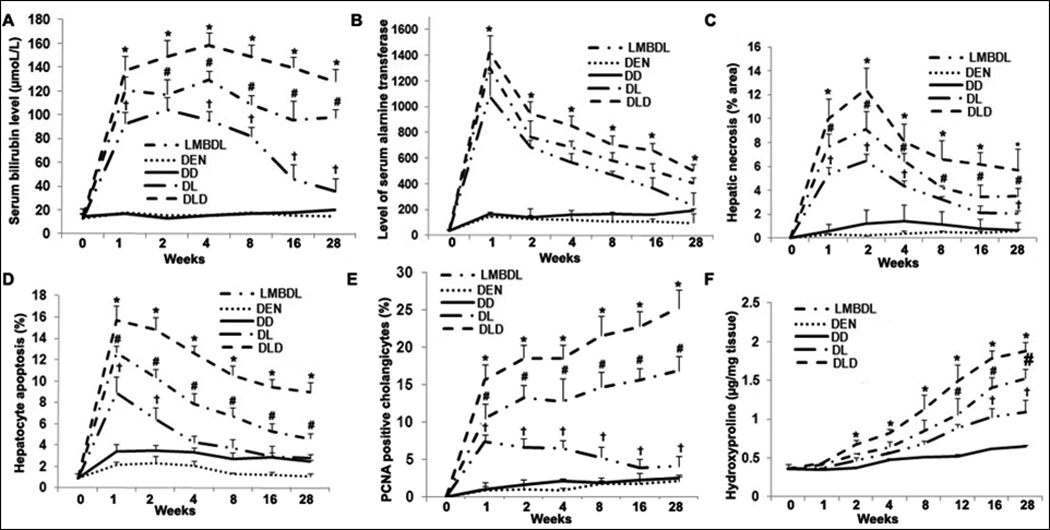
Total serum was extracted from the treated groups to assess A) total bilirubin and B) ALT levels. C) Hepatic necrosis was determined by H&E staining. D) Hepatocyte apoptosis was identified by TUNEL staining. E) Cholangiocyte proliferation was evaluated by PCNA staining. F) Hydroxyproline content was done to look at fibrosis. Five liver tissue samples for each group were used for the above assays. *p<0.05 DLD vs all other groups, #p<0.05 DL vs LMBDL, †p<0.01 LMBDL vs DEN and DD groups.
We next assessed the effect of the treatments on hepatic fibrogenesis, cell death, and proliferation. Hepatic necrosis and hepatocyte apoptosis occurred at the early time-points (Fig. 2C–D), while proliferation (Supplementary Fig. 3) increased steadily at the later time-points in the LMBDL, DL and DLD groups. Liver hydroxyproline content (Fig. 2F) increased from week 2 on in the LMBDL, DL and DLD groups.
K19, a cholangiocyte marker, and PCNA staining was used to measure cholangiocyte proliferation. We found PCNA-positive cholangiocytes peaked at week 1 and declined steadily from week 2 on in the LMBDL group, whereas it kept rising for the DL and DLD groups. The number of PCNA positive cholangiocytes in the LMBDL, DL and DLD groups was 1.6, 6.8 and 10.1 fold higher compared to that of the DD group at week 28, respectively (Fig. 2E). Therefore, LMBDL alone can increase cholangiocyte proliferation, and this can be enhanced by the addition of DEN
2. LMBDL with DEN accelerated CCA formation
Fibrosis is a common symptom in CCA. Since LMBDL can promote cholangiofibrosis formation from week 12 on (Supplementary Fig. 1A–B), we speculate that LMBDL would accelerate DEN-initiated liver cancer formation. The DL and DLD groups had 1.6 and 2.9 fold higher levels of choolangiofibrosis compared to the LMBDL in the ligated lobes at week 28. The ligated lobes from the DLD mice showed the presence of cholangiofibrosis, cirrhosis, cholangiomas and CCA at weeks 8, 12, 16 and 28, respectively (Fig. 3A, Supplementary Table 2). Cystic hyperplasias was observed in the DD, LMBDL, DL and DLD-treated groups by week 28. DLD mice at week 8 had multifocal biliary cystic hyperplasias with cysts lined by flattened epithelium (Fig 3B). Cyctic atypical hyperplasias had dilated proliferating bile ducts lined with homogenous eosinophilic cells containing elongated nuclei (Fig 3C). Although cyctic atypical hyperplasias were observed in mice treated with DD, the incidence of these lesions in the DL and DLD mice were significantly higher. Cholangiomas which consisted of densely packed proliferating tubular ducts was observed in the DL and DLD groups (Fig. 3D). CCA was only found in the DLD group (Fig. 3E). The neoplastic cells were arranged in small cords and the stroma extends around the reactive ductules with atypical columnar cells containing prominent proliferating nucleoli (Supplementary Fig. 4A). There was papillary proliferation of the atypical biliary epithelium showing a multilayering of nuclei, loss of cell polarity, and nuclear hyperchromasia within the bile ducts (Supplementary Fig. 4B). The tumorous lesion had cirrhotic nodules, which were surrounded by a rim of ductular cell proliferation (Supplementary Fig. 4C). Since sinusoidal and portal vein invasion are the most frequent mode of intrahepatic CCA spread, we also found that the tumor cells invaded into the portal vein of the ligated lobes (Supplementary Fig. 4D). All of these pathological features that the DLD mice exhibit are found during human CCA progression.
Fig. 3. Time course of progressive liver injury and morphological analysis of CCA in the ligated lobes of the DLD group.
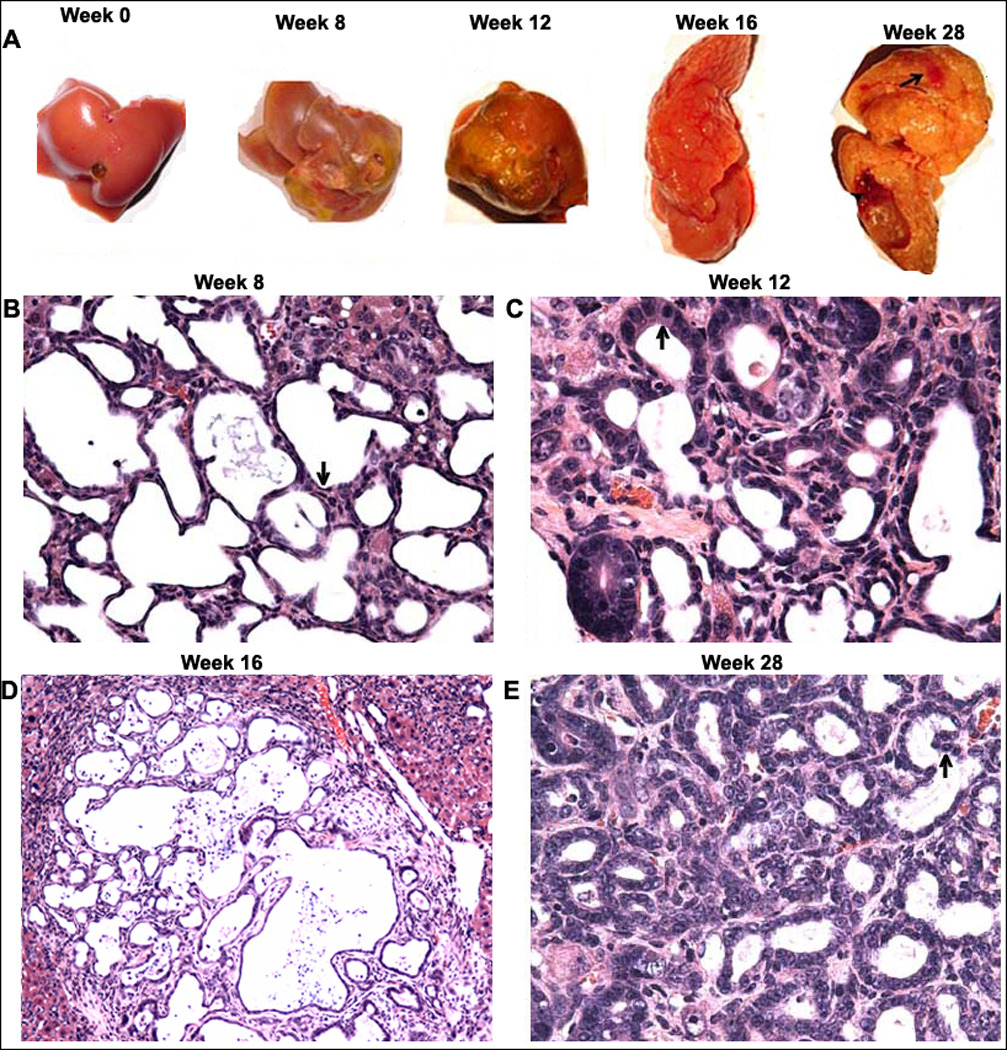
A) Representative livers showing fibrosis (week 8), cirrhosis (week 12), cholangiomas (week 16) and CCA (week 28- denoted by arrow). H&E staining was done to assess liver morphology at the various time points. B) A week 8 liver showing multifocal cystic hyperplasia of the intrahepatic bile ducts and multifocal cysts lined by flattened epithelium (arrow) (200×); C) A week 12 liver showing cystic atypical hyperplasia of the intrahepatic bile ducts and multifocal cysts lined by homogenous epithelium with elongated nuclei (arrow) (200×); D) A week 16 liver showing cholangioma formation and ductular adenoma formation (100×); and E) A week 28 liver showing CCA formation (200×).
3. LMBDL upregulated c-Myc and Lin-28B expression and downregulated miR-34a and let-7a expression in the ligated lobes
Previously, we showed that c-Myc expression was upregulated during acute liver injury induced by LHBDL and CBDL.5 In this study, we examined c-Myc expression during LMBDL-accelerated CCA progression. Western blot showed that LMBDL increased c-Myc expression from week 1 to week 8, but returned to baseline thereafter. In contrast, c-Myc expression increased late from week 12 to 28 for the DD group. The DL and DLD groups showed a similar pattern of c-Myc expression as the LMBDL group at the early time-points, however, c-Myc expression remained high after 8 weeks and persisted to 28 weeks (Fig. 4A). Next we examined what cell type c-Myc is induced following LMBDL. c-Myc expression was found in the hepatocytes, cholangiocytes and inflammatory cells (Supplementary Fig. 4C). The percentage of c-Myc-positive hepatocytes in the LMBDL group was elevated over baseline at week 1, but declined steadily from week 4 to 28. The amount of c-Myc positive hepatocytes in the DL and DLD group was increased over baseline for the entire duration of the treatment (Fig. 4B). The percentage of c-Myc positive cholangiocytes in the LMBDL, DL and DLD groups showed a similar trend as the c-Myc positive hepatocytes (Fig. 4C, Supplementary Fig. 5). Histological and immunohistochemical examination of the ligated lobes after LMBDL revealed a large number of inflammatory cells that infiltrated the portal tracts with an elevation of c-Myc positive cells (Supplementary Table 3). Overall, c-Myc is upregulated during CCA progression. There are several factors that influence c-Myc expression that are deregulated in cancer.
Fig. 4. Time-course of c-Myc expression in mice treated with DEN, DD, LMBDL, DL and DLD.
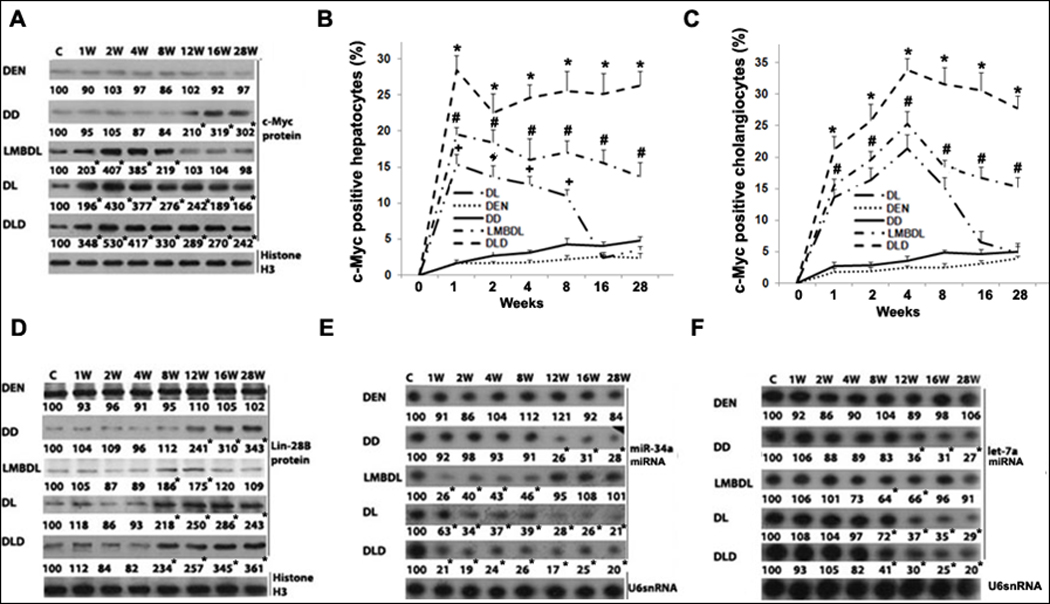
A) Western blot assays of c-Myc protein expression. c-Myc immunohistochemistry assays showing the percentage of c-Myc-positive staining in B) hepatocytes and C) cholangiocytes. D) Western blot assays for Lin-28B. Northern blot assays for E) miR-34a and F) let-7a. *p<0.01 DLD vs all other groups, #p<0.01 DL vs LMBDL, †p<0.01 LMBDL vs DEN and DD groups, and *p<0.01 vs control.
miR-34a and let-7, known to inhibit c-Myc expression are downregulated in hepatobiliary cancer.8, 19 However, the expression pattern of miR-34a and let-7a in cholestasis-accelerated CCA progression is unknown. Expression of miR-34a decreased from week 1 to 8 in the LMBDL group, from week 12 to 28 in the DD group, and from week 1 to 28 in the DL and DLD groups (Fig. 4E). Let-7a expression decreased from week 8 to 12 in the LMBDL group, from week 12 to 28 in the DD group, and from week 8 to 28 in the DL and DLD groups (Fig. 4F). Lin-28B, highly expressed in HCC, can inhibit c-Myc via let-7a inhibition and is also regulated by c-Myc.8 We found that the expression of Lin-28B increased from week 8 to 12 in the LMBDL group, from week 12 to 28 in the DD group, and from week 8 to 28 in the DL and DLD groups (Fig. 4D).
4. DLD upregulated HIF-1α, HIF-2α and miR-210 expression and downregulated Mnt expression in the ligated lobes
We previously showed that Mnt expression was downregulated during acute liver injury induced by LHBDL and CBDL. We examined Mnt expression in LMBDL-accelerated CCA progression. Mnt protein expression decreased from week 4 to week 8 in the LMBDL group, at week 12 in the DD group and from week 4 to week 28 for the DL and DLD groups (Fig. 5A). We further examine the mechanisms of Mnt downregulation in CCA progression. Liver fibrosis can result in an increased resistance to blood flow and oxygen delivery, leading to hypoxia. Hypoxia can upregulate miR-210 via HIF-1α and HIF-2α, both of which are upregulated in HCC and CCA.9, 17 We found that LMBDL transiently increased HIF-1α protein expression from week 1 to 8 and HIF-2α expression from week 4 to 12. DD increased HIF-1α protein expression from week 12 to 28 and HIF-2α expression from week 16 to 28. DL and DLD increased HIF-1α expression from week 1 to 28 and HIF-2α expression from week 4 to 28 (Fig. 5B–C).
Fig. 5. Time- course of HIF-1α, HIF-2α, Mnt and miR-210 expression.
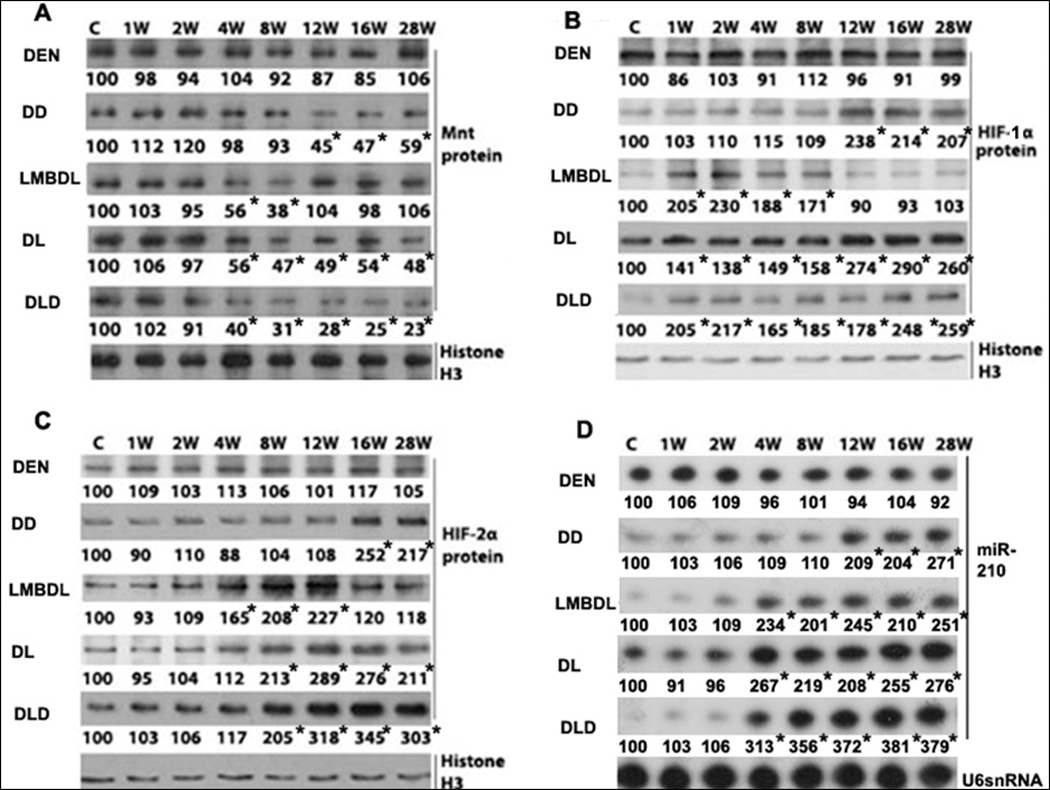
Western blot analysis of the treated groups from day 0 to 28 weeks looking at A) Mnt, B) HIF-1α and C) HIF-2α. D) Northern blot analysis of miR-210 in the treated groups from day 0 to 28 weeks. *p<0.01 vs control.
miR-210 is upregulated in HCC,10 but is expression during CCA progression is unknown. LMBDL increased miR-210 early from week 4 to week 8, but declined from week 12 to 28. DD increased miR-210 expression late from week 12 to 28. DL and DLD highly increased miR-210 expression from week 4 to 28 (Fig. 5D). Thus, the high expression of miR-210 correlates better with HIF-2α expression than with HIF-1α in CCA progression.
5. DLD upregulated cyclin D1 via a switch from Mnt to c-Myc binding activity in the ligated lobes
We previously observed a switch from Mnt to c-Myc during cholestatic liver injury. To see if a similar trend occurs during cholangiocarcinogenesis, we looked at cyclin D1 expression and c-Myc/Mnt binding activity at the E-box element of the cyclin D1 promoter. LMBDL increased cyclin D1 protein expression from week 1 to week 8. For the DD group, cyclin D1 expression started increasing at week 12. DL and DLD increased cyclin D1 expression from week 1 to 28 (Fig. 6A).
Fig. 6. Expression and binding activities of c-Myc and Mnt on the E-box in the cyclin D1 promoter.
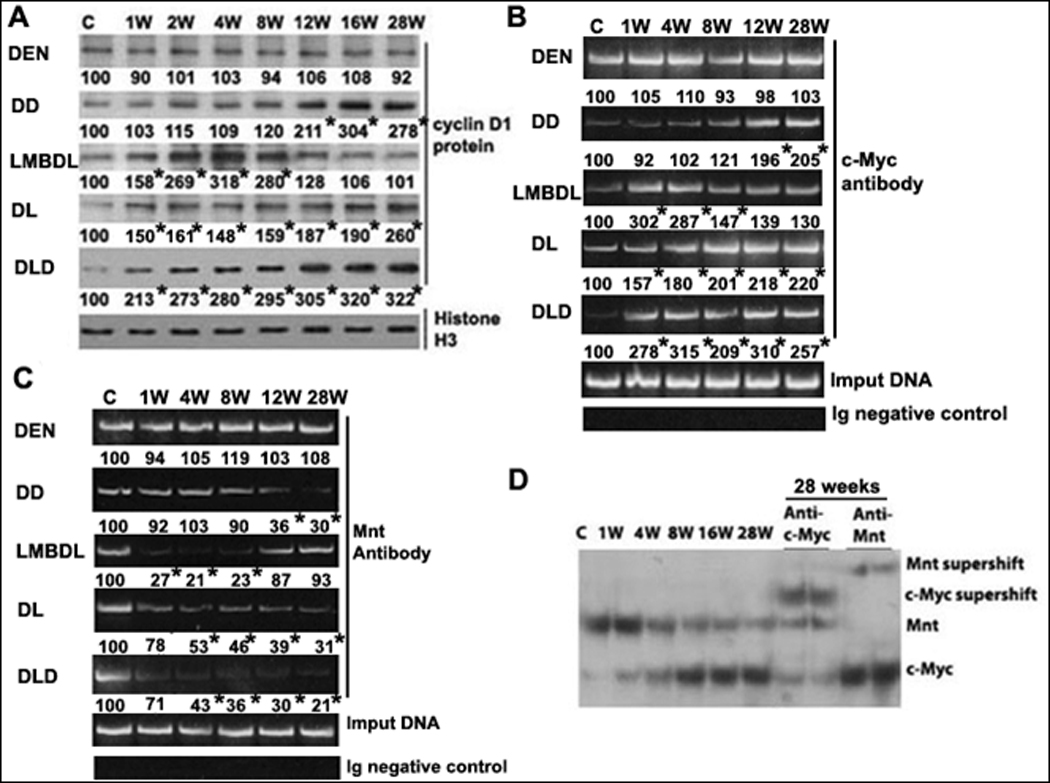
A) Western blot analysis of cyclin D1 in mice treated with DEN, DD, LMBDL, DL and DLD from day 0 to 28 weeks. *p<0.01 vs control. ChiP assays of the E-box element in cyclin D1 promoter was done using antibodies to either B) c-Myc or C) Mnt. D) EMSA of cyclin D1 promoter (−425 to −446 of the mouse E-box region) and supershift analysis with c-Myc or Mnt antiboby. *p<0.01 vs control.
The E-box is an important functional element for cyclin D1 regulation in cholestatic liver injury.5 We performed ChiP assays to study whether DLD treatment led to a switch from Mnt to c-Myc to the E-box element. LMBDL increased c-Myc binding to the cyclin D1 E-box element at weeks 1 and 8, but dropped afterwards. DD increased c-Myc binding late at weeks 12 and 28. DL and DLD increased c-Myc binding from week 1 to 28. LMBDL decreased Mnt binding to the cyclin D1 E-box element at weeks 4 and 8, but returned to baseline at weeks 12 and 28. DD decreased Mnt binding at weeks 12 and 28. DL and DLD decreased Mnt binding from week 4 to 28 (Fig. 6B–C). EMSA was performed to test the effect of DLD on the binding dynamics of c-Myc and Mnt to the cyclin D1 E-box element. Liver nuclear protein extracts from the ligated lobes of DLD mice from week 1 to 28 shifted two major bands. The c-Myc antibody supershifted the lower band, whereas Mnt antibody supershifted the top band. The Mnt band intensity decreases from week 4 to 28 while the c-Myc band intensity increases going from 1 to 28 weeks (Fig. 6D). Therefore, a switch from Mnt to c-Myc binding activity leads to cyclin D1 upregulation in the DLD model.
6. Mnt siRNA enhanced and c-Myc siRNA reduced cholestasis-accelerated cholangiocarcinogenesis progression
To see if the transition from Mnt to c-Myc contributes to chronic cholestasis-accelerated cholangiocarcinogenesis, we used a lentiviral gene delivery method to either prevent the increase in c-Myc or further lower Mnt expression in the DLD group. Mnt siRNA knockdown in DLD mice increased cholangiofibrosis, CA and proliferation of the ductular cells compared to DLD+scrambled siRNA (Fig. 7A). In contrast, DLD+c-Myc siRNA reduced cholangiofibrosis, CA and ductular cell growth (Fig. 7A, Supplementary Fig. 6, and Supplementary Table 4).
Fig. 7. Effect of c-Myc or Mnt siRNA on liver morphology, gene expression and binding activity to the E-box element of cyclin D1 promoter in DLD mice.
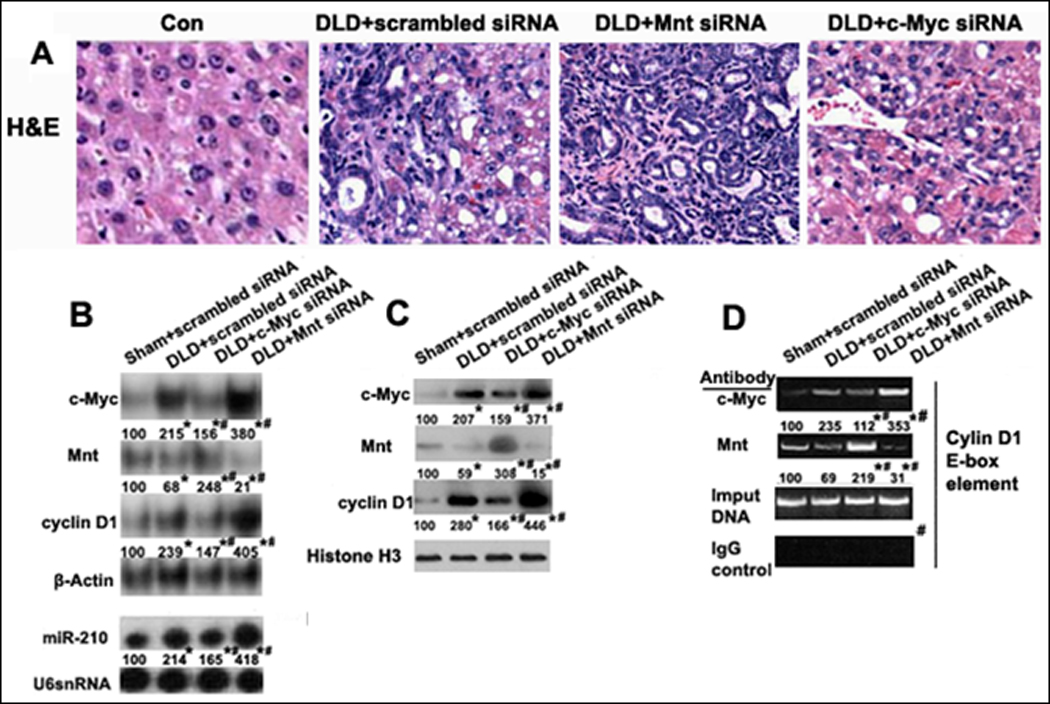
siRNA knockdown of either c-Myc or Mnt affecting changes to A) Liver morphology (H&E staining, 200X), B) c-Myc, Mnt, cyclin D1 and miR-210 mRNA expression, C) c-Myc, Mnt and cyclin D1 protein expression, and D) Binding activity of c-Myc, Mnt and in the E-box region of cyclin D1 promoter by ChiP analysis. *p<0.01 vs Sham+scrambled siRNA, #<0.01 DLD+c-Myc siRNA or Mnt siRNA vs DLD+scrambled siRNA.
c-Myc siRNA knockdown in DLD led to a 2.1 fold fall in c-Myc mRNA, a 1.7 fold increase in Mnt and a 1.9 fold fall in cyclin D1 compared to DLD+scrambled siRNA. Mnt siRNA in DLD led to a 2.6 fold fall in Mnt, a 1.5 fold increase in c-Myc, and a 1.8 fold increase in cyclin D1 compared to scrambled siRNA (Fig. 7B). c-Myc or Mnt siRNA knockdown in DLD had a similar effect on c-Myc, Mnt and cyclin D1 protein expression (Fig. 7C). We next looked at the effect of siRNA on the binding activities of c-Myc and Mnt on the cyclin D1 promoter by ChiP analysis. c-Myc siRNA in DLD resulted in a 2.1 fold fall in c-Myc binding and a 3.1 fold increase in Mnt binding to the cyclin D1 promoter compared to scrambled siRNA. Mnt siRNA in DLD led to a 1.5 fold increase in c-Myc and a 2.2 fold fall in Mnt for binding to the cyclin D1 promoter compared to scrambled siRNA (Fig. 7D). Collectively, the knockdown studies support the important contribution of c-Myc and Mnt in CCA progression.
DISCUSSION
Chemically induced CCA progression often involves initiation by a carcinogen like DEN, carbon tetrachloride, furan, 3'-methyl-4-dimethylaminoazobenezene or dimethylnitrosamine (DMN), followed by a procedure to promote the initiated cell proliferation, such as partial hepatectomy or liver flukes. Earlier reports showed cholangiocarcinogenesis promotion by LHBDL in hamsters after initiation with DMN which supports the link between cholestasis and CCA progression.20 Our model has several advantages including a higher incidence of CCA in a shorter time (50% incidence by week 28) than the hamster model (39.1% by week 40). The DLD model also developed more liver injury, chronic cholestasis, fibrosis, and cirrhosis, which mimics the physiopathological features of human CCA progression. The ligated left lobe fused together with the unligated median lobe in the hamster model which can compensate for the lack of bile flow in the ligated lobe and thus attenuate the effect of the ligation.
Our studies confirm that c-Myc is induced during cholangiocarcinogensis.18 c-Myc upregulation was found in the inflammatory cells, hepatocytes and cholangiocytes during CCA progression. The combination of c-Myc upregulation and Mnt downregulation will alter the binding balance to E-box containing promoters and thus affect the regulation of c-Myc target genes during cholestatic liver injury.5 DLD treatment resulted in persistently high levels of c-Myc and low levels of Mnt (Figs. 4A, 5A). Consistently, cyclin D1, a downstream target of c-Myc, is upregulated. The Mnt to c-Myc switch resulted in a change in E-box binding in the cyclin D1 promoter from Mnt-Max to c-Myc-Max (Fig. 6B–D). Our results confirm that c-Myc induction and Mnt reduction are required for the upregulation of cyclin D1 in vivo since c-Myc knockdown prevented the switch from Mnt to c-Myc E-box binding (Fig. 7D). Mnt siRNA knockdown also led to increased c-Myc binding and expression of cyclin D1 (Fig. 7B–D). In addition, c-Myc knockdown significantly reduced both cholangiofibrosis and CA in the DLD mice, but not completely blocked its formation. This suggests that c-Myc–independent pathways are also important in CCA progression. This is evident since we observe CCA in the unligated lobes of the DLD mice. It is possible that the CCA in the unligated lobes of a few DLD mice maybe the result of signaling pathways that work in a paracrine manner that is activated under the conditions of DLD and not with other treatments. This signal can originate from the cells within the ligated lobes and possibly travel to the cholangiocytes of the unligated lobes via the portal vein. Since inflammation is found in CCA, this may be one of the signaling pathways that are activated only under DLD conditions. This is a topic of interest and future study.
The mechanism of how Mnt falls and c-Myc increases during cholestatic cholangiocarcinogensis was unclear. miR-34a persistent inhibition in the DLD group may be due to a combination of LMBDL at the early time points and weekly DEN administration at the later time-points (Fig. 4E–F). Lin-28B is a RNA-binding protein which promotes transformation and invasion in HCC. Lin-28B mediates suppression of let-7, resulting in the upregulation of c-Myc. Our experiments demonstrated that high Lin-28B expression appeared during the formation of cystic hyperplasias (Figs. 3B, 4D). These results suggest that Lin-28B overexpression is related to driving hyperplasia lesion formation. High expression of Lin-28B correlated with low let-7a expression. However, c-Myc was upregulated starting from week 1, while Lin-28B upregulation and let-7a downregulation occurred later at week 8. This indicates that c-Myc expression is independent of Lin-28B and let-7a at the early time points and more likely influenced by miR-34a downregulation. miR-210 is a direct transcriptional target of HIF-2α and Mnt is a direct target of miR-210.11 Our results suggest that Mnt downregulation is due to miR-210 upregulation.
In conclusion, we have established a chronic cholestatic liver injury mouse model system that mimics human CCA progression. This allows us to study the mechanisms of chronic cholestasis accelerated CCA formation. In addition, miR-34a downregulation and miR-210 upregulation led to a switch from Mnt to c-Myc expression during cholestatic cholangiocarcinogenesis in vivo. However, Lin-28B and let-7a did not appear to influence c-Myc expression. The c-Myc-Mnt switch have important pathological consequences as it leads to the induction of cyclin D1 and participate in the progression of CCA.
Supplementary Material
Acknowledgments
Grant Support: Pilot/feasibility grant from the USC Research Center for Liver Diseases (P30DK48522) and NIH Grants (DK45334, DK51719 and AT1576). Pathological sections and staining were supported by the Imaging Core of the USC Research Center for Liver Diseases (P30DK48522).
List of abbreviations
- ALT
alanine aminotransferase
- CA
cholangiomas
- CAH
cystic atypical hyperplasias
- CBDL
common bile duct ligation
- CH
cystic hyperplasias
- CCA
cholangiocarcinoma
- ChiP
Chromatin immunoprecipitation
- DEN
diethylnitrosamine
- EMSA
Electrophoretic mobility shift assay
- HCC
hepatocellular carcinoma
- HIF
hypoxia-inducible factor
- IP
intraperitoneal
- LHBDL
left hepatic bile duct ligation
- LMBDL
Left and median bile duct ligation
- TUNEL
Terminal deoxynucleotidyl transferase dUTP nick end labeling
- PCNA
proliferating cell nuclear antigen
Footnotes
Publisher's Disclaimer: This is a PDF file of an unedited manuscript that has been accepted for publication. As a service to our customers we are providing this early version of the manuscript. The manuscript will undergo copyediting, typesetting, and review of the resulting proof before it is published in its final citable form. Please note that during the production process errors may be discovered which could affect the content, and all legal disclaimers that apply to the journal pertain.
- Study concept and design, acquisition of data; analysis and interpretation of data; drafting of the manuscript; statistical analysis, funding support and study supervision- H Yang
- Technical support, analysis, interpretation of data, drafting of manuscript- TWH Li
- Acquisition of data- J Peng and X Tang
- Technical support- K Ko and M Xia
- Study concept- MA Aller
Potential conflict of interest: Nothing to report.
Reference
- 1.Guglielmi A, Ruzzenente A, Campagnaro T, et al. Does intrahepatic cholangiocarcinoma have better prognosis compared to perihilar cholangiocarcinoma? J Surg Oncol. 2010;101:111–115. doi: 10.1002/jso.21452. [DOI] [PubMed] [Google Scholar]
- 2.Lazaridis KN, Gores GJ. Cholangiocarcinoma. Gastroenterology. 2005;128:1655–1667. doi: 10.1053/j.gastro.2005.03.040. [DOI] [PubMed] [Google Scholar]
- 3.Welzel TM, Graubard BI, El-Serag HB, et al. Risk factors for intrahepatic and extrahepatic cholangiocarcinoma in the United States: a population-based case-control study. Clin Gastroenterol Hepatol. 2007;5:1221–1228. doi: 10.1016/j.cgh.2007.05.020. [DOI] [PMC free article] [PubMed] [Google Scholar]
- 4.Sirica AE, Dumur CI, Campbell DJ, Almenara JA, Ogunwobi OO, Dewitt JL. Intrahepatic cholangiocarcinoma progression: prognostic factors and basic mechanisms. Clin Gastroenterol Hepatol. 2009;7(11 Suppl):S68–S78. doi: 10.1016/j.cgh.2009.08.023. [DOI] [PMC free article] [PubMed] [Google Scholar]
- 5.Yang H, Li TW, Ko KS, Xia M, Lu SC. Switch from Mnt-Max to Myc-Max induces p53 and cyclin D1 expression and apoptosis during cholestasis in mouse and human hepatocytes. Hepatology. 2009;49:860–870. doi: 10.1002/hep.22720. [DOI] [PMC free article] [PubMed] [Google Scholar]
- 6.Sugimachi K, Aishima S, Taguchi K, et al. The role of overexpression and gene amplification of cyclin D1 in intrahepatic cholangiocarcinoma. J Hepatol. 2001;35:74–79. doi: 10.1016/s0168-8278(01)00079-4. [DOI] [PubMed] [Google Scholar]
- 7.Christoffersen NR, Shalgi R, Frankel LB, et al. p53-independent upregulation of miR-34a during oncogene-induced senescence represses MYC. Cell Death Differ. 2010;17:236–245. doi: 10.1038/cdd.2009.109. [DOI] [PubMed] [Google Scholar]
- 8.Mendell JT. Tumors line up for a letdown. Nat Genet. 2009;41:768–769. doi: 10.1038/ng0709-768. [DOI] [PubMed] [Google Scholar]
- 9.Menrad H, Werno C, Schmid T, et al. Roles of hypoxia-inducible factor-1alpha (HIF-1alpha) versus HIF-2alpha in the survival of hepatocellular tumor spheroids. Hepatology. 2010;51:2183–2192. doi: 10.1002/hep.23597. [DOI] [PubMed] [Google Scholar]
- 10.Pineau P, Volinia S, McJunkin K, et al. miR-221 overexpression contributes to liver tumorigenesis. Proc Natl Acad Sci U S A. 2010;107:264–269. doi: 10.1073/pnas.0907904107. [DOI] [PMC free article] [PubMed] [Google Scholar]
- 11.Zhang Z, Sun H, Dai H, et al. MicroRNA miR-210 modulates cellular response to hypoxia through the MYC antagonist MNT. Cell Cycle. 2009;8:2756–2768. doi: 10.4161/cc.8.17.9387. [DOI] [PubMed] [Google Scholar]
- 12.Umemura T, Kodama Y, Kanki K, et al. Pentachlorophenol (but not phenobarbital) promotes intrahepatic biliary cysts induced by diethylnitrosamine to cholangio cystic neoplasms in B6C3F1 mice possibly due to oxidative stress. Toxicol Pathol. 2003;31:10–13. doi: 10.1080/01926230390173806. [DOI] [PubMed] [Google Scholar]
- 13.Strnad P, Tao GZ, Zhou Q, et al. Keratin mutation predisposes to mouse liver fibrosis and unmasks differential effects of the carbon tetrachloride and thioacetamide models. Gastroenterology. 2008;134:1169–1179. doi: 10.1053/j.gastro.2008.01.035. [DOI] [PMC free article] [PubMed] [Google Scholar]
- 14.Liu F, Song Y, Liu D. Hydrodynamics-based transfection in animals by systemic administration of plasmid DNA. Gene Ther. 1999;6:1258–1266. doi: 10.1038/sj.gt.3300947. [DOI] [PubMed] [Google Scholar]
- 15.von Burstin J, Eser S, Paul MC, et al. E-cadherin regulates metastasis of pancreatic cancer in vivo and is suppressed by a SNAIL/HDAC1/HDAC2 repressor complex. Gastroenterology. 2009;137:361–371. doi: 10.1053/j.gastro.2009.04.004. [DOI] [PubMed] [Google Scholar]
- 16.Heinrich S, Georgiev P, Weber A, Vergopoulos A, Graf R, Clavien PA. Partial bile duct ligation in mice: A novel model of acute cholestasis. Surgery. 2010;149:445–451. doi: 10.1016/j.surg.2010.07.046. [DOI] [PubMed] [Google Scholar]
- 17.Pinlaor S, Sripa B, Ma N, et al. Nitrative and oxidative DNA damage in intrahepatic cholangiocarcinoma patients in relation to tumor invasion. World J Gastroenterol. 2005;11:4644–4649. doi: 10.3748/wjg.v11.i30.4644. [DOI] [PMC free article] [PubMed] [Google Scholar]
- 18.Prakobwong S, Khoontawad J, Yongvanit P, et al. Curcumin decreases cholangiocarcinogenesis in hamsters by suppressing inflammation-mediated molecular events related to multistep carcinogenesis. Int J Cancer. 2010 doi: 10.1002/ijc.25656. [Epub ahead of print]. [DOI] [PubMed] [Google Scholar]
- 19.Mott JL. MicroRNAs involved in tumor suppressor and oncogene pathways: implications for hepatobiliary neoplasia. Hepatology. 2009;50:630–637. doi: 10.1002/hep.23010. [DOI] [PMC free article] [PubMed] [Google Scholar]
- 20.Thamavit W, Pairojkul C, Tiwawech D, Itoh M, Shirai T, Ito N. Promotion of cholangiocarcinogenesis in the hamster liver by bile duct ligation after dimethylnitrosamine initiation. Carcinogenesis. 1993;14:2415–2417. doi: 10.1093/carcin/14.11.2415. [DOI] [PubMed] [Google Scholar]
- 21.Sawanyawisuth K. Genes and cholangiocarcinoma. Southeast Asian J Trop Med Public Health. 2009;40:701–712. [PubMed] [Google Scholar]
Associated Data
This section collects any data citations, data availability statements, or supplementary materials included in this article.


