

Abstract
Rationale and Objectives
Determine inter- and intraobserver variability of computed tomography (CT) tumor volume measurements in advanced non-small-cell lung cancer (NSCLC) patients treated in a Phase II clinical trial using chest CT.
Materials and Methods
Twenty-three advanced NSCLC patients with a total of 53 measurable lung lesions enrolled in a Phase II, multicenter, open-label clinical trial of erlotinib were retrospectively studied with institutional review board approval. Two radiologists independently measured the tumor size, volume, and CT attenuation coefficient using commercially available volume analysis software. Concordance correlation coefficients (CCCs) and Bland-Altman plots were used to assess inter- and intraobserver agreement.
Results
High CCCs (0.949–0.990) were observed in all types of measurements for interobserver agreement. The 95% limits of agreements for volume, unidimensional, and bidimensional measurements were (−26.0%, 18.6%), (−23.1%, 24.4%), and (−34.0%, 48.6%), respectively. Volume measurements had slightly higher CCC and narrower 95% limits of agreement compared to uni- and bidimensional measurements. CCCs for intraobserver agreement were high (range, 0.946–0.996) with CCC for volume being slightly higher than CCCs of uni- and bidimensional measurements. The smaller the tumor volume was, the larger the interobserver difference of CT attenuation. Location, morphology, or adjacent atelectasis had no significant impact on inter- or intraobserver variability.
Conclusion
CT tumor volume measurement in advanced NSCLC patients using clinical chest CT and commercially available software demonstrated high inter- and intraobserver agreement, indicating that the method may be used routinely in clinical practice.
Keywords: Lung cancer, computed tomography, tumor volume measurement, interobserver variability, intraobserver variability
Lung cancer is a leading cause of death from cancer in the United States as well as worldwide, resulting in more than 160,000 deaths per year in the United States (1). Non-small-cell lung cancer (NSCLC), accounting for approximately 85% of lung cancer cases, has a 5-year survival rate of only 15%. Given the increasing availability of newer targeted therapeutic options against NSCLC, such as the epidermal growth factor receptor (EGFR) tyrosine kinase inhibitors, gefitinib and erlotinib, accurate assessment of response to a given therapy is of utmost importance (2-4). In addition, accurate tumor assessment to document time to progression has become a critical determinant because it is used as a primary end point in lung cancer clinical trials using targeted agents.
Two widely accepted and conventional guidelines for objective response assessment to therapy in patients with solid tumors include the World Health Organization (WHO) guideline that uses bidimensional tumor measurements and the Response Evaluation Criteria in Solid Tumors (RECIST) that uses unidimensional measurements of the longest diameter of the tumor (5). Recent advancement of computed tomography (CT) and multidetector-row CT (MDCT) imaging technology has enabled volumetric measurements of tumors (6-9). To use the tumor volume measurement as a method of response assessment to therapy, it is necessary to determine the reproducibility of this volume measurement. However, only a few reports have been published regarding the reproducibility of CT volume measurement of lung lesions in advanced NSCLC patients participating in prospective clinical trials (7,9). To answer questions of CT measurement reproducibility and repeatability, Zhao et al evaluated the variability in tumor measurements from same-day repeat CT scans using thin-section CT images in 32 NSCLC patients (9). In their study, the patients were recruited to a specific imaging trial, and their own semiautomated three-dimensional algorithm was used for determining tumor volume measurements (9). To widely apply CT volume measurements in response assessment of NSCLC in clinical practice, it is important to assess reproducibility of the measurements in NSCLC patients who were actually treated in a prospective clinical trial of therapeutic agents. CT volume measurement is gradually becoming a clinically available tool for assessing tumor burden. However, radiologists should accurately assess the performance characteristics of these volumetric tools including inter- and intraobserver reproducibility.
The purpose of the study is to determine inter- and intraobserver variability of CT tumor volume measurement in advanced NSCLC patients treated in a Phase II clinical trial using clinical chest CT and commercially available volume analysis software and investigate the performance characteristics of CT volume measurement, an emerging clinical tool.
MATERIALS AND METHODS
Patients
The original clinical trial was performed with 80 eligible patients and the clinical outcome has been previously reported (10). Eligible patients were ≥70 years of age with histologically or cytologically confirmed Stage IIIB/IV NSCLC. Additional inclusion criteria included Eastern Cooperative Oncology Group performance status of 0 to 2; white blood cell ≥3000/μL; hemoglobin ≥9.0 g/dL; platelet count ≥100,000/μL; total bilirubin ≤1.5 mg/dL; aspartate aminotransferase ≤2.0x institutional upper limit of normal; creatinine ≤1.5 mg/dL; measurable or assessable lesions as defined by RECIST; and life expectancy more than 8 weeks. Exclusion criteria included prior chemotherapy or treatment with any erythroblastic leukemia viral oncogene homolog (ErbB) 1- or ErbB2-targeted agent; major surgery or radiation therapy within the last 21 days; any malignancy within the last 5 years (excluding nonmelanoma skin cancers or definitively treated cervical cancer); any active gastrointestinal disorder that alters motility or absorption; and severe and unstable medical comorbidities (10).
Baseline CT scans of 58 patients treated at the Dana-Farber Cancer Institute were reviewed by a board-certified thoracic radiologist with 5 years of experience (M.N.) to identify patients with at least one measurable lung lesion according to RECIST. In 58 patients, 23 patients had at least one measurable lung lesion (53 lesions in total, 1–7 lesions per patient, average 2.3 lesions). The remaining 35 patients (of 58 patients) had measurable lesions outside of the lungs but no measurable lesions in the lungs. Therefore, the study population of the current study consisted of 23 patients (11 males and 12 females; 71–91 years old; mean: 77 years old) with histologically or cytologically confirmed, either by surgical or CT-guided biopsy or fine-needle aspiration, Stage IIIB/IV NSCLC who had not been treated with prior chemotherapy. Patients were enrolled in a Phase II, multicenter, open-label study and were treated with 150 mg of erlotinib by mouth daily as part of a first line therapy following written, informed consent (10). The study was approved by the institutional review board.
CT Examinations
CT scans of the chest were performed at baseline and after every two cycles (8 weeks) of therapy to determine response to erlotinib. The protocol at the Dana-Farber Cancer Institute with a four-row MDCT scanner (Volume Zoom; Siemens Medical Solutions, Forchheim, Germany) was as follows: patients were scanned in the supine position from the cranial to caudal direction from the clavicles to the adrenal glands at end-inspiration; 100 mL of iopromide (Ultravist 300, 300 mg iodine/mL; Bayer HealthCare Pharmaceuticals Inc, Wayne, NJ) was injected intravenously with an automated injector (Medrad, Pittsburgh, PA) at a rate of 2–3 mL/second, with a scan delay of 30 seconds, unless medically contraindicated. The parameters were as follows: 120 kVp, 165 mAs, 2.5 mm scanning thickness, and 0.5 second exposure time. The axial images (5 or 7 mm thickness) were reconstructed using B40f kernel for standard algorithm and B60f kernel for lung algorithm. Baseline chest CT images reconstructed with the standard algorithm were anonymized and transferred to a workstation with three-dimensional medical visualization and analysis software (Vitrea 2, version 4.0, Vital Images, Minnetonka, MN) for analysis.
Tumor Size and Volume Measurement
Two board-certified radiologists (P.D., a board-certified oncologic radiologist with 17 years of experience; M.N., a board-certified thoracic radiologist with 5 years of experience) independently measured the bidimensional diameters, volume and CT attenuation (Hounsfield unit) of 53 target lung lesions using a Food and Drug Administration–approved, commercially available volume analysis software (Vitrea 2).
The volume measurement was performed using commercially available volume analysis software for lung nodules as follows (Fig 1). Axial chest CT images were loaded and displayed in a lung window setting (level = −500; width = 1500). The radiologist manually selected a small region of interest within a lesion on a CT image, which showed the longest diameter of the lesion by a mouse click. The software automatically segmented the lesion from the surrounding normal lung and adjacent structures such as vessels and pleura, using a three-dimensional seed growing algorithm. The boundary of the segmented lesion was then displayed on the CT images. The radiologist visually assessed if the automated algorithm accurately segmented the lesion excluding adjacent structures such as vessels, pleura, atelectasis, and effusion. If needed, the radiologist manually adjusted the boundary of the tumor on each image, determining the boundary between the lesion and adjacent structures by visual assessment. After segmentation and manual correction, the volume of the segmented lesion was automatically calculated by adding volumes of all the voxels included in the segmentation (Fig 1). The software also provided the average CTattenuation coefficient (HU) of the segmented tumor. After segmentation, the reader manually measured the longest diameter and the longest perpendicular diameter of the target lesion on a CT image that demonstrated the longest diameter of the lesion, using a caliper-type measurement tool on the Vitrea Workstation.
Figure 1.
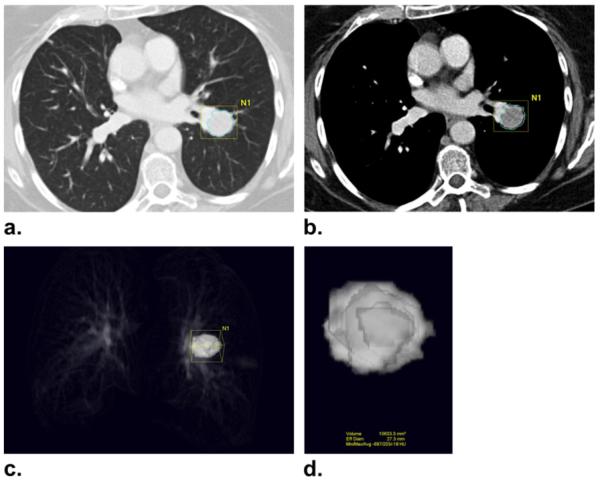
Computed tomography (CT) tumor volume measurement in a 73-year-old female with advanced non-small cell lung cancer. (a, b) CT scan of the chest in a patient with advanced lung cancer demonstrates a lung lesion abutting the pulmonary vasculature. Clicking a voxel within a lesion allows the software to automatically segment the lesion using adaptive threshold and size criteria, and the boundary of the segmented lesion is displayed on the CT images. The boundary of the tumor is adjusted manually by the radiologist on each image to separate the lesion and adjacent vasculature. (c, d) The segmented tumor is displayed in a three-dimensional fashion, and the volume and CT attenuation coefficient (Hounsfield units) of the segmented tumor are provided.
Written instructions for the measurement process were provided to the radiologists. A printed image of each lesion was provided to the radiologists so that the radiologists could identify the target lesions to measure. Measurements were performed using a lung window setting; however, the radiologists were allowed to view images on a mediastinal window setting (level = 50; width = 350) if it was necessary to manually separate the lesion from adjacent structures. One of the radiologists (M.N.) performed the measurements five times, with at least a 1-week interval between measurements. The other radiologist (P.D.) performed the measurements once. At each measurement, the CT scans were displayed in a randomized order using R 2.9.1., a language and environment for statistical computing (The R Foundation for Statistical Computing. Available at: http://www.R-project.org.).
The location (1 = purely intraparenchymal, 2 = pleura/fissure attached, 3 = justavascular), morphology (1 = smooth, 2 = lobulated, 3 = irregular), presence or absence of adjacent atelectasis (1 = present, 2 = absent) were recorded at the time of first measurement of five measurements by one of the radiologists (M.N.) (11).
Statistical Analysis
Inter- and intraobserver variability was assessed using concordance correlation coefficients (CCCs), mean relative difference (%), and 95% limits of agreement (%), percentage of observations inside the limits (%) for the longest diameter, the longest perpendicular diameter, the bidimensional measurement (the product of the longest diameter and the longest perpendicular diameter), the volume, and the average CT attenuation. Assuming two measurements have mean u1 and u2, with variance σ12, σ22, and covariance σ12, CCC = (2 σ12)/[ σ12+ σ22 + (u1− u2)2]. CCCs are composed of a measure of precision (how far each pair of measurements deviates from the best-fit line through the data) and a measure of accuracy (the distance between the best-fit line and the 45° line through the origin) (12). A CCC value of 1 indicates perfect agreement and −1 indicates perfect reversed agreement. We also computed the mean relative difference (%) between the two measurements, (100*[M1-M2]/M1; M1 = measurement 1, M2 = measurement 2), and the standard deviation (SD) of the difference among all tumors. The 95% limits of agreement (the mean relative change ± twice the SD of the difference) were also calculated. The trimmed SD, which is the SD of the relative difference after removing the top and bottom 2.5% of the values, was also calculated. Measurements by two radiologists were compared using Pearson’s correlation and linear regression.
Interobserver variability was further assessed using Bland-Altman plots (9,13). For the unidimensional, bidimensional, and volume measurements, the percentage of relative difference between the measurements by two radiologists was plotted against the average of the two measurements. For the CT attenuation coefficient (HU), the difference of the two measurements was plotted against the average CT attenuation coefficient, as well as against the average volume of the tumor. The first of the five measurements by a radiologist (M.N., radiologist 1) was compared with the measurement by the other radiologist (P.D., radiologist 2) to assess interobserver variability.
The influence of the lesion characteristics (location, morphology, presence/absence of adjacent atelectasis) on intra- and interobserver variability of volume measurement was assessed using the multivariate linear regression model. Regression coefficients were estimated and the P value of the F test was computed to evaluate the significance of the coefficients. We also conducted the multivariate regression models for the intra- and interobserver variability of unidimensional, bidimensional, and CT attenuation coefficient. Bonferroni correction was applied to control for multiplicity.
RESULTS
Interobserver Agreement
Table 1 demonstrates the interobserver agreement of the unidimensional, bidimensional, volume, and CT attenuation coefficient measurements. The detailed measurements results of two radiologists including volume, the longest diameter, the longest perpendicular diameter, bidimensional measurement and CT attenuation are shown in Figure 2. Figure 3 shows the Bland-Altman plots with the mean percentage of relative difference and the 95% limits of agreement of the two independent measurements by two radiologists. The absolute mean relative difference is higher for volume (−3.7%) as compared with the longest diameter (0.6%). However, since a decrease of 3.7% in cubic scale is corresponding to a decrease of 1.2% in a unidimensional scale, the two values are quite close after adjusting for the scale. Volume measurement had slightly higher CCC and narrower 95% limits of agreement compared to uni- and bidimensional measurements. However, the percentage of observations inside the limits of volume measurement was smaller compared to uni- and bidimensional measurements, indicating that there are more outliers (ie, observations outside of the 95% limits of agreement) for the volume measurement than the uni- and bidimensional measurement.
TABLE 1.
Interobserver Agreement Between Two Radiologists for Volume, Uni- and Bidimensional, and CT Attenuation Coefficient Measurements
| Types of Measurement | Concordance Correlation Coefficient* |
Mean Relative Difference (%) |
95% limits of Agreement (%) |
Percentage of Observations Inside the Limits (%) |
Standard Deviation‡ |
|---|---|---|---|---|---|
| Volume | 0.990 (0.983–0.994) | −3.7 | 26.0,18.6 | 90.5 | 0.112 (0.058) |
| Longest diameter | 0.969 (0.949–0.982) | 0.6 | −23.1, 24.4 | 94.3 | 0.119 (0.098) |
| Longest perpendicular diameter | 0.949 (0.914–0.970) | 7.1 | −23.9, 38.0 | 94.3 | 0.155 (0.105) |
| Bidimensional | 0.966 (0.942–0.980) | 7.3 | −34.0, 48.6 | 92.4 | 0.207 (0.156) |
| CT attenuation coefficient | 0.985 (0.975–0.991) | −0.7 | −55.1, 53.7† | 92.4 | 27.2† (18.9) |
CCC: concordance correlation coefficients; CT: computed tomography.
Data represent CCC; numbers in parentheses are the 95% confidence intervals.
The numbers in these cells are in Hounsfield units (HU).
The numbers in parentheses represent trimmed standard deviation (SD), the SD of the relative difference after removing the top and botto 2.5% of the values.
Figure 2.

Comparison of the measurements results of two radiologists including volume (a), the longest diameter (b), the longest perpendicular diameter (c), bidimensional measurement, (d) and computed tomography (CT) attenuation (e) measurements demonstrated high correlation between the two measurements (r2 = 0.981 for volume, r2 = 0.945 for the longest dimension, r2 = 0.911 for the longest perpendicular diameter, r2 = 0.934 for bidimensional measurement, and r2 = 0.976 for CT attenuation, Pearson correlation).
Figure 3.

Bland-Altman plots for volume and uni- and bidimensional and computed tomography (CT) attenuation coefficient measurements by two independent observers. The figures demonstrate interobserver variability as a function of average measurement. Relative difference between two radiologists’ measurements is plotted by the average of both radiologists for volume (a), unidimensional measurements (b), the longest diameter, (c) the longest perpendicular diameter, and bidimensional measurement (d). Difference of CT attenuation coefficient (Hounsfield units) between two radiologists’ measurements is plotted by the average HU (e) and average volume (f). Dashed lines indicate the upper and lower 95% limits of agreement. Dotted lines indicate the average difference.
Because the outliers might inflate the variance and hence the range of the limits, we compared the SD and the trimmed SD. Although the SD of the relative difference for volume and the longest diameter measurements were quite similar (0.112 vs. 0.119, respectively), the trimmed SD for the volume measurement became almost half of the longest diameter measurement (0.058 vs. 0.098).
The average CT attenuation coefficient had high CCC (0.985) and 95% limits of agreement of −55.1 HU and 53.7 HU (Table 1). The Bland-Altman plots of the CT attenuation coefficient did not show particular trend in difference when plotted against the average CT attenuation values. However, when plotted against the average volume, the Bland-Altman plot visually demonstrated that the smaller the volume, the larger the difference of the CT attenuation measurements (Fig 3).
Intraobserver Agreement
Table 2 demonstrates the summary of the intraobserver agreement of the unidimensional, bidimensional, volume, and CT attenuation coefficient measurements performed five times each by a radiologist (M.N.). Volume measurements had slightly higher CCC and higher percentage of observations inside the limits compared to uni- or bidimensional measurements. The average SD of the relative difference for the volume was slightly larger than that for the longest diameters. However, the trimmed SD after removing the outliers is similar for the volume and the longest diameters.
TABLE 2.
Intraobserver Agreement for Volume, Uni- and Bidimensional, and CT Attenuation Coefficient Measurements
| Types of Measurement | Average Concordance Correlation Coefficient* |
Average Mean Relative Difference (%)* |
Average Standard Deviation* |
Average Trimmed Standard Deviation* |
Average Percentage of Observations Inside the Limits (%)* |
|---|---|---|---|---|---|
| Volume | 0.992 (0.985–0.996) | −5.4 (−9.3, −0.2) | 0.148 (0.104–0.220) | 0.008 (0.064–0.113) | 95.0 (90.5, 98.1) |
| Longest diameter | 0.977 (0.971–0.984) | −3.2 (−6.0, −0.7) | 0.110 (0.098–0.117) | 0.086 (0.071–0.095) | 94.7 (90.5, 98.1) |
| Longest perpendicular diameter | 0.959 (0.946–0.971) | −1.7 (−5.2, 21.3) | 0.160 (0.138–0.197) | 0.117 (0.100–0.130) | 94.3 (90.5, 96.2) |
| Bidimensional | 0.975 (0.959–0.989) | −5.1 (−8.4, 0.3) | 0.210 (0.186–0.234) | 0.165 (0.141–0.187) | 94.7 (92.4, 98.1) |
| CT attenuation coefficient | 0.984 (0.974–0.996) | 6.6† (−3.1, 13.7) | 26.2† (12.6–33.4) | 16.4† (10.1–21.6) | 94.5 (90.5, 96.2) |
Numbers in parentheses represent range of each statistical parameter.
The numbers in these cells are in Hounsfield units (HU).
Impact of Lesion Characteristics on CT Measurement Variabilit
Table 3 demonstrates the results of the lesion characteristics including location, morphology, presence/absence of adjacent atelectasis. None of the lesion characteristics had significant impact on inter- or intraobserver variability of the measurement using multivariate linear regression model after adjusting for multiplicity. The absence of adjacent atelectasis seems to increase the inter-rater variability for the bidimensional (P = .002); however, the effect is removed after adjusting for the number of tests (n = 30).
TABLE 3.
The Summary of the Lesion Characteristics
| Lesion Characteristics | Number of Lesions |
|---|---|
| Location | |
| Intraparenchymal | 25 |
| Pleura/fissure | 18 |
| Juxtavascular | 10 |
| Morphology | |
| Smooth | 7 |
| Lobulated | 14 |
| Irregular | 32 |
| Adjacent atelectasis | |
| Present | 17 |
| Absent | 36 |
DISCUSSION
High inter- and intraobserver agreements were observed in the CT tumor volume measurement using routine clinical chest CT and commercially available volume analysis software in advanced NSCLC patients who were actually treated in a Phase II clinical trial. CCCs of volume measurement were slightly higher than those of the unidimensional and bidimensional measurements.
The 95% limits of agreement of volume measurement were −26.0% and 18.6%, which were narrower than those of the longest diameter (−23.1%, 24.4%), the most widely used measurement defined by RECIST. Of note, the 95% limits of agreement of volume measurement obtained in the present study is much narrower than the cutoff values of −65% and 73% proposed in the original RECIST article published in 2000, based on a simple mathematical conversion from the diameter to a sphere (1,9). This result was concordant with the observation by Zhao et al in their study of reproducibility using 32 NSCLC patients, although their slice thickness of CT images was 1.25 mm as opposed to 5 or 7 mm in our study (9). Our results indicated that the difference between CT volume measurements beyond −26.0% and 18.6% attributes to a true change in tumor volume rather than a measurement variation in advanced NSCLC patients, and the volume measurement can detect much smaller changes in tumor burden than originally expected.
Despite the slightly narrower 95% limits of agreements, volume measurement had more observations outside of the 95% limits compared to the longest diameter measurement. After removing the outliers, the SD of the volume decreased to 0.058 from 0.112, demonstrating that the outliers made the SD twice larger. We reviewed the imaging characteristics of five lesions outside of the 95% limits of agreement to identify features that are common to them; however, no common feature was observed. Four lesions were intraparenchymal and one was pleura-attached. Three lesions were irregular in morphology and two were lobulated. Four lesions had no adjacent atelectasis and one had adjacent atelectasis. These five lesions were not particularly different in imaging characteristics compared to other lesions that had good reproducibility in volume measurement. Similarly, location or morphology of the lesions or presence/absence of adjacent atelectasis did not have a significant impact on measurement variability. This result is different from the report by Wang et al, who studied the volume measurement variability of 4225 small nodules (15–500 mm3) detected at lung cancer screening in 2239 participants and demonstrated that nodule morphology, location, and size influenced volume measurement variability, particularly among the juxtavascular and irregular nodules (11). Although a study with a larger number of patients and a larger number of observers might be helpful to address this important issue, the initial observations in the present study of 23 patients’ lung lesions indicates the importance of visual assessment of the boundary of segmented lesion by experienced radiologists in each lesion in advanced NSCLC regardless of morphology or location. In the present study, manual adjustment of segmentation was necessary in each volume measurement for both radiologists. When performing a tumor volume measurement on a follow-up study, it is necessary to look at the boundaries of the segmented lesion on the prior study to minimize the change in volume introduced by measurement variability.
Inter- and intraobserver variability of CT volume measurement has been studied using small lung nodules detected in lung cancer screening trials (14-18). However, these nodules tend to be small and discrete, and are located within otherwise normal lung without surrounding atelectasis or effusion. Therefore, these nodules are relatively easy to segment and measure using commercially available software with very high reproducibility (14-18). There are only a few reports describing the reproducibility of CT volume measurement of lung lesions in actual NSCLC patients(7, 9). Zhao et al recently reported reproducibility and repeatability of CT volume measurement in 32 NSCLC patients with one lesion per patient who underwent two chest CT scans on the same day for research purposes (9). The study demonstrated high reproducibility and repeatability of chest CT scans, with CCCs ≥0.960 for radiologists’ measurements and CCCs ≥1.00 for the computer aided measurements. Our results showed similarly high CCCs for uni- and bidimensional measurements compared to their CCCs for radiologist measurements on the same image. For the volume measurement, our results showed slightly lower CCCs (0.990 compared to 1.00) with wider 95% limits of agreements. The difference could be due to several factors, including the difference in patient populations, the slice thickness of CT images (5 or 7 mm vs. 1.25 mm), and the performance of the volume analysis software (commercially available versus homegrown). Of note, the patients in the study by Zhao et al were recruited for their particular imaging study rather than for an actual oncologic clinical trial, and the exact clinical stages of lung cancer of these patients were not reported in detail (9). In contrast, the patients in our present study were actually enrolled and treated in a phase II clinical trial for patients with advanced NSCLC, and comprise the population that will benefit most from precise assessment of tumor burden after anticancer drug therapy in the actual clinical setting (10). To our knowledge, the reproducibility data of tumor volume measurements in such a population have not been previously reported. We believe the assessment of inter- and intraobserver variability of CT tumor volume measurement will be needed when applying volume measurement tools to different patient population in order to precisely assess true change of tumor burden. Our study also demonstrated that the lesion characteristics such as location, morphology, and adjacent atelectasis did not impact measurement variability in advanced NSCLC, which was not investigated in the study by Zhao et al (9).
It is well-known that CT attenuation coefficient decreases after targeted therapy using tyrosine kinase inhibitors in some solid tumors such as gastrointestinal stromal tumor (19). It is possible that the CT attenuation coefficient can provide additional metrics of response assessment to tyrosine kinase inhibitor therapy in NSCLC. Our study demonstrated high inter- and intraobserver reproducibility for the CTattenuation coefficient measurement in lung lesions in NSCLC. Since the 95% limits of agreement for the average CT attenuation coefficient were −55.1 HU and 53.7 HU, the difference between CT attenuation coefficient measurements beyond this range can attribute to a true change in tumor CT attenuation rather than measurement variability in advanced NSCLC patients. We also demonstrated that the variability of CT attenuation coefficient is higher for the smaller volume lesions, indicating that the changes in CT attenuation coefficient after therapy should be evaluated with caution in small lung lesions since the changes can be due to measurement variability. To our knowledge, these findings have not been described in the previous literature.
The limitations of the present study include retrospective design and relatively small number of patients, as well as lack of thin-slice reconstruction of CT images. Thin-slice reconstruction of CT images could enhance the ability to accurately determine volume status. However, our data are from an already completed clinical trial performed between 2003 and 2006 in which chest CT examinations were performed as a part of standard care and the chest CT protocol did not include thin-slice reconstructions. Given the large and increasing number of lung cancer patients who need accurate response assessment for assessing the efficacy of therapy on a routine basis in oncologic practice, we believe it is important to demonstrate the reproducibility performance of volume measurements using standard clinical chest CT protocol. High reproducibility of volume measurements in the present study using a routine clinical chest CT protocol provides a promising insight that the CT volume measurement can be incorporated into a routine tumor response assessment to therapy in clinical oncology–based radiology practice. We chose to use commercially available, Food and Drug Administration–approved volume analysis software for the lung lesions with a hope that the data acquired using such a method are one step closer to the standardized volume measurement method which can be incorporated in clinical practice.
In conclusion, CT tumor volume measurements in advanced NSCLC patients performed using routine clinical chest CT and commercially available, Food and Drug Administration–approved volume analysis software demonstrated high inter- and intraobserver agreement which was independent of location, morphology or adjacent atelectasis. The results indicate that CT volume measurements may be used routinely in the response assessment of advanced NSCLC patients in a more widespread and standardized fashion.
Acknowledgments
The investigators were supported by 2009–11 Agfa HealthCare/RSNA Research Scholar Grant (M.N.), Grants 1RO1CA114465–01 (B.E.J., P.A.J.) and 5R21 CA11627-02 (H.H.) from the National Institutes of Health, Grant No. 2P50CA090578–06 (B.E.J, P.A.J.) from the National Cancer Institute Specialized Program of Research Excellence in Lung Cancer, and a grant from Genentech Inc, as well as by the Doris and William Krupp Research Fund in Thoracic Oncology.
Contributor Information
Mizuki Nishino, Department of Imaging, Dana-Farber Cancer Institute and Brigham and Women’s Hospital, 44 Binney St, Boston, MA 02115; Department of Radiology Brigham and Women’s Hospital, Boston, MA.
Mengye Guo, Department of Imaging, Dana-Farber Cancer Institute and Brigham and Women’s Hospital, 44 Binney St, Boston, MA 02115.
David M. Jackman, Department of Medical Oncology, Dana-Farber Cancer Institute and Brigham and Women’s Hospital, 44 Binney St, Boston, MA 02115.
Pamela J. DiPiro, Department of Imaging, Dana-Farber Cancer Institute and Brigham and Women’s Hospital, 44 Binney St, Boston, MA 02115; Department of Radiology Brigham and Women’s Hospital, Boston, MA.
Jeffrey T. Yap, Department of Imaging, Dana-Farber Cancer Institute and Brigham and Women’s Hospital, 44 Binney St, Boston, MA 02115; Department of Radiology Brigham and Women’s Hospital, Boston, MA.
Tak K. Ho, Department of Imaging, Dana-Farber Cancer Institute and Brigham and Women’s Hospital, 44 Binney St, Boston, MA 02115
Hiroto Hatabu, Department of Radiology Brigham and Women’s Hospital, Boston, MA.
Pasi A. Jänne, Department of Medical Oncology, Dana-Farber Cancer Institute and Brigham and Women’s Hospital, 44 Binney St, Boston, MA 02115.
Annick D. Van den Abbeele, Department of Imaging, Dana-Farber Cancer Institute and Brigham and Women’s Hospital, 44 Binney St, Boston, MA 02115.
Bruce E. Johnson, Department of Medical Oncology, Dana-Farber Cancer Institute and Brigham and Women’s Hospital, 44 Binney St, Boston, MA 02115.
REFERENCES
- 1.Jemal A, Siegel R, Ward E, et al. Cancer statistics, 2009. CA Cancer J Clin. 2009;59:225–249. doi: 10.3322/caac.20006. [DOI] [PubMed] [Google Scholar]
- 2.Lynch TJ, Bell DW, Sordella R, et al. Activating mutations in the epidermal growth factor receptor underlying responsiveness of non-small-cell lung cancer to gefitinib. N Engl J Med. 2004;350:2129–2139. doi: 10.1056/NEJMoa040938. [DOI] [PubMed] [Google Scholar]
- 3.Paez JG, Janne PA, Lee JC, et al. EGFR mutations in lung cancer: correlation with clinical response to gefitinib therapy. Science. 2004;304:1497–1500. doi: 10.1126/science.1099314. [DOI] [PubMed] [Google Scholar]
- 4.Pao W, Miller V, Zakowski M, et al. EGF receptor gene mutations are common in lung cancers from “never smokers” and are associated with sensitivity of tumors to gefitinib and erlotinib. Proc Natl Acad Sci USA. 2004;101:13306–13311. doi: 10.1073/pnas.0405220101. [DOI] [PMC free article] [PubMed] [Google Scholar]
- 5.Therasse P, Arbuck SG, Eisenhauer EA, et al. New guidelines to evaluate the response to treatment in solid tumors: European Organization for Research and Treatment of Cancer, National Cancer Institute of the United States, National Cancer Institute of Canada. J Natl Cancer Inst. 2000;92:205–216. doi: 10.1093/jnci/92.3.205. [DOI] [PubMed] [Google Scholar]
- 6.Zhao B, Schwartz LH, Moskowitz CS, et al. Pulmonary metastases: effect of CT section thickness on measurement-initial experience. Radiology. 2005;234:934–939. doi: 10.1148/radiol.2343040020. [DOI] [PubMed] [Google Scholar]
- 7.Zhao B, Schwartz LH, Moskowitz CS, et al. Lung cancer: computerized quantification of tumor response–initial results. Radiology. 2006;241:892–898. doi: 10.1148/radiol.2413051887. [DOI] [PubMed] [Google Scholar]
- 8.Gavrielides MA, Kinnard LM, Myers KJ, et al. Noncalcified lung nodules: volumetric assessment with thoracic CT. Radiology. 2009;251:26–37. doi: 10.1148/radiol.2511071897. [DOI] [PMC free article] [PubMed] [Google Scholar]
- 9.Zhao B, James LP, Moskowitz CS, et al. Evaluating variability in tumor measurements from same-day repeat CT scans of patients with non-small cell lung cancer. Radiology. 2009;252:263–272. doi: 10.1148/radiol.2522081593. [DOI] [PMC free article] [PubMed] [Google Scholar]
- 10.Jackman DM, Yeap BY, Lindeman NI, et al. Phase II clinical trial of chemotherapy-naive patients > or = 70 years of age treated with erlotinib for advanced non-small-cell lung cancer. J Clin Oncol. 2007;25:760–766. doi: 10.1200/JCO.2006.07.5754. [DOI] [PubMed] [Google Scholar]
- 11.Wang Y, van Klaveren RJ, van der Zaag-Loonen HJ, et al. Effect of nodule characteristics on variability of semiautomated volume measurements in pulmonary nodules detected in a lung cancer screening program. Radiology. 2008;248:625–631. doi: 10.1148/radiol.2482070957. [DOI] [PubMed] [Google Scholar]
- 12.Lin LI. A concordance correlation coefficient to evaluate reproducibility. Biometrics. 1989;45:255–268. [PubMed] [Google Scholar]
- 13.Bland JM, Altman DG. Statistical methods for assessing agreement between two methods of clinical measurement. Lancet. 1986;1:307–310. [PubMed] [Google Scholar]
- 14.Yankelevitz DF, Reeves AP, Kostis WJ, et al. Small pulmonary nodules: volumetrically determined growth rates based on CT evaluation. Radiology. 2000;217:251–256. doi: 10.1148/radiology.217.1.r00oc33251. [DOI] [PubMed] [Google Scholar]
- 15.Kostis WJ, Yankelevitz DF, Reeves AP, et al. Small pulmonary nodules: reproducibility of three-dimensional volumetric measurement and estimation of time to follow-up CT. Radiology. 2004;231:446–452. doi: 10.1148/radiol.2312030553. [DOI] [PubMed] [Google Scholar]
- 16.Gietema HA, Wang Y, Xu D, et al. Pulmonary nodules detected at lung cancer screening: interobserver variability of semiautomated volume measurements. Radiology. 2006;241:251–257. doi: 10.1148/radiol.2411050860. [DOI] [PubMed] [Google Scholar]
- 17.Petrou M, Quint LE, Nan B, et al. Pulmonary nodule volumetric measurement variability as a function of CT slice thickness and nodule morphology. AJR Am J Roentgenol. 2007;188:306–312. doi: 10.2214/AJR.05.1063. [DOI] [PubMed] [Google Scholar]
- 18.Marchianò A, Calabrò E, Civelli E, et al. Pulmonary nodules: volume repeatability at multidetector CT lung cancer screening. Radiology. 2009;251:919–925. doi: 10.1148/radiol.2513081313. [DOI] [PubMed] [Google Scholar]
- 19.Choi H, Charnsangavej C, Faria SC, et al. CT Evaluation of the response of gastrointestinal stromal tumors after imatinib mesylate treatment: a quantitative analysis correlated with FDG-PET findings. AJR Am J Roentgenol. 2004;183:1619–1628. doi: 10.2214/ajr.183.6.01831619. [DOI] [PubMed] [Google Scholar]