Abstract
Arterial elasticity has gained importance in the past decades because it has been shown to be an independent predictor of cardiovascular diseases. Several in vivo and ex vivo techniques have been developed to characterize the elastic properties of vessels. In vivo techniques tend to ignore the anisotropy of the mechanical properties in the vessel wall, and therefore, fail to characterize elasticity in different directions. Ex vivo techniques, have focused their efforts in studying the mechanical properties in different axes. In this paper, we present a technique that uses piezoelectric elements to measure the elasticity of soft tubes and excised arteries in two directions while maintaining the natural structure of these vessels. This technique uses sonometry data from piezoelectric elements to measure the strain in the longitudinal and circumferential directions while the tubes/arteries are being pressurized. We conducted experiments on urethane tubes to evaluate the technique and compared the experimental results with mechanical testing done on the materials used for making the tubes. We then performed sonometry experiments on excised pig carotid arteries assuming that they are transversely isotropic materials. To evaluate the sensitivity of this technique to changes in the material properties, we changed the temperature of the saline bath in which the arteries were immersed. The calculated Young’s modulus from sonometry experiments for the urethane tubes and the mechanical testing values showed good agreement, deviating no more than 13.1%. The elasticity values from the excised arteries and the behavior with the temperature changed agreed with previous work done in similar arteries. Therefore, we propose this technique for nondestructive testing of the biaxial properties of soft materials tubes and excised arteries in their natural physiological shape.
Keywords: Arterial elasticity, elastic moduli, piezoelectric elements, sonometry
Introduction
Arterial elasticity has gained importance in the past decades as an independent predictor of cardiovascular diseases and mortality(Dolan et al., 2006). Ex vivo and in vivo testing of vessels is important, first to understand the intrinsic mechanical properties of the tissues, and second, to relate such properties to the physiology of the system to which they belong. Several in vivo approaches to study the properties of vessels have been developed such as pulse wave velocity(Fulton and McSwiney, 1930, Harada et al., 2002), imaging techniques (Bank et al., 1999, Woodrum et al., 2006) and augmentation index analysis(Obara et al., 2009). Even though these techniques have the potential to be applied in a clinical setting, the complexity of the measurements and analysis has not allowed them to become widely used. Another disadvantage to in vivo testing is that it tends to ignore that arteries consist of anisotropic materials, therefore the mechanical properties are not fully characterized.
Ex vivo testing techniques have been applied to understanding the differences in mechanical properties in the circumferential and longitudinal directions. Fung, et al., proposed a biaxial technique, in which the arteries are cut open and treated as thin films. Then, the tissue samples were placed on a machine that stretched them in two directions while recording the stresses and strains(Debes and Fung, 1995, Sacks and Sun, 2003). Other attempts to characterize arteries used an inflation method where they pressurized a thin film of vessel wall to create a bubble while optically tracking the shape in the directions corresponding to the axial and in longitudinal axes(Marra et al., 2006, Wright et al., 2004). Kassab’s group developed a testing technique that measured the circumferential, longitudinal and torsional properties independently from each other by pressurizing the vessels while keeping them at a fixed length, and later stretching them in the axial direction at a set pressure(Lu et al., 2003).
In this paper, we are proposing the use of piezoelectric elements and sonometry to track the strain in the longitudinal and circumferential directions when pressurizing soft tubes and arteries. This is a nondestructive testing technique as there is no need to modify the geometrical shape of the cylindrical structures and no need to exceed the elastic limit of the materials (no plastic deformations). In addition, the artery is stressed while maintaining its natural shape, giving material properties relevant to its in situ state. In this paper, we first present the constitutive equations that govern the longitudinal and circumferential stress-strain relationships for isotropic and transversely isotropic materials. Next, we describe the experiments using sonometry on soft urethane tubes and excised pig carotid arteries in addition to mechanical testing done on urethane samples to validate the sonometry technique. We believe that this technique can be widely used to study the biaxial mechanical properties of arteries in their natural shape. This will allow better characterization and understanding of the elasticity of arteries in the different disease processes.
Methods
Theory
The mechanical response of arteries is characterized by nonlinear material response as well as intrinsic anisotropy due to its composite-layered microstructure (Dobrin and Canfield, 1984). We will be concerned in this work with the development of a simple and adequate theory that would allow us to approximately capture the anisotropic and nonlinear response of arterial vessels. Although the anisotropy of arteries is quite complex, originating from helical patterns of collagen and elastin fibers wound around its axis arranged in different layers, we are primarily interested in capturing the apparent differences in elastic moduli in the circumferential and longitudinal directions. The main reason for this is that circumferential compliance plays a fundamental role in the physiology of arteries. Therefore, we would start by assuming that the response observed in our experiments can be captured by a transversely isotropic material model. Moreover, we will characterize the nonlinear response by using a small-strain nonlinear elastic (secant-moduli) formulation in which the Young’s moduli in different directions will be taken as a function of the state of stress. Furthermore, we will ignore shear stresses and shear deformations, as we will be concentrating on the response of arteries to internal pressure alone.
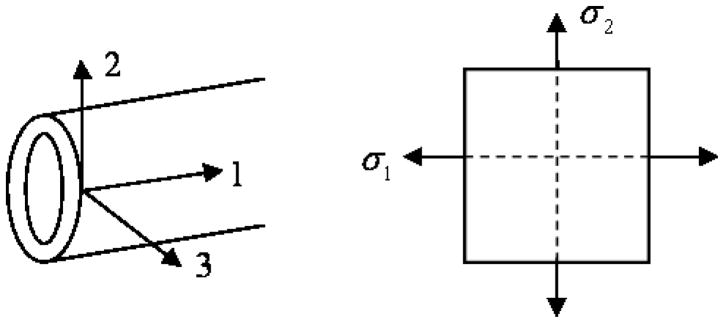
To this end, considering the material axes in a cylindrical body as shown in Figure 1, where 1 is the longitudinal direction, 2 the circumferential and 3 the thickness direction, we can start with the strain-stress relationship for an orthotropic material as
Fig. 1.
Axes for an isotropic tube or a transversely isotropic artery
| (1) |
where σ1, σ2 and σ3 are the stress in the longitudinal (axial stress), circumferential (hoop stress) and thickness directions, respectively, and ε1, ε2 and ε3 are the strains in the respective directions, νij and νji for i and j equal to 1, 2 and 3 are the Poisson’s ratios between the 3 orthogonal directions and E1, E2 and E3 the respective Young’s modulus. Consider a transversely isotropic material in which E1 = E3. For instance, this can represent a cylinder with fibers wound around its circumference or a first approximation for an artery, where there are different fibers oriented longitudinally and circumferentially. From the symmetry of the constitutive matrix, we have in general.
| (2) |
Using the transverse isotropy condition, i.e. E1 = E3, the following relationships hold.
| (3) |
Now, let us determine what constraints the incompressibility condition imposes on the material constants. Incompressibility requires that ε1 + ε2 + ε3 = 0 for all states of stress. So, we can operate on our constitutive equations as
| (4) |
For this condition to hold for all states of stress, we must have
| (5) |
The above expression simply states that the sum of the elements in each column must add up to zero. Expanding the above expression yields three simultaneous equations given as
| (6) |
From the transverse isotropy condition, we set ν12 = ν32 Substituting this expression into the second equation above, yields
| (7) |
Also, notice that from the transverse isotropy condition we stated that .
Therefore,
| (8) |
And finally, from the first equation resulting from the incompressibility condition and using the above result, we have
| (9) |
| (10) |
Considering the type of loading in our experiments, the walls of a thin cylinder under internal pressure can be considered under a state of plane stress. For our material coordinate system, this implies σ3 = 0. Hence, the constitutive equations reduce to
| (11) |
Consider the specific case for a thin tube where σ2 = 2σ1. Then,
| (12) |
and
| (13) |
Therefore, the secant elastic moduli in the circumferential and longitudinal directions solved from equations (12) and (13), respectively, are:
| (14) |
and
| (15) |
For the special case of an incompressible and isotropic material(Reddy, 2008), E1 = E2 = E3 = E and νij = νji, i, j 1, 2,3 are equal to 0.5. Replacing these conditions in (1) we obtain the following equivalent expressions
| (16) |
| (17) |
For the isotropic and transversely isotropic cases, the stresses and strains in the circumferential directions were calculated using the expressions for a thin walled cylinder, because the ratio of the thickness to the radius was around 0.2, and are described below,
| (18) |
| (19) |
| (20) |
| (21) |
| (22) |
where P is the transmural pressure, rout and l are the radius and length at each pressure value measure with the piezoelectric elements, respectively, r is mean radius, h is the thickness and r0 and l0 the initial values for the radius and the length, respectively. For both conditions, isotropic and transversely isotropic, the state of incompressibility was defined as ε1 + ε2 + ε3 = 0.
Experiments
Urethane tubes and arteries
As a model for the experiments, we developed a custom-made injection process to create our own tubes out of urethane. The urethane used (Reoflex 20, Smooth-On Inc, Easton, PA) comes in two different components (A and B), which are mixed in equal amounts. To soften the urethane mixture there is a third component that can be added (So-Flex, Smooth-On Inc, Easton, PA). The percentages were determined by the weight of the components used. Three tubes were made, two of them had no So-Flex, which we defined as 0% (0% of So-Flex was added to the mixture of A or B); we refer to these tubes in this paper as 0% #1 and 0% #2. We also made a tube with 15% So-Flex. A glass tube with an internal diameter of 4.98 mm was set vertically in a clamp attached to a ring stand. The liquid urethane mixture was then injected from the bottom in order to avoid bubbles in the mixture. Once the tube was filled with the urethane, a stainless steel rod of 3.2 mm diameter was introduced from the top and centered from one end of the tube to the other. The centering process was guaranteed by two custom machined nozzles that were in each extreme end of the glass tube. Both the inside of the glass tube and the stainless steel rod were sprayed with a demolding agent (Smooth-On, Easton, PA). The urethane was allowed to cure for at least 24 hours before taking the rod and the urethane tube out of the glass mold.
Two pairs of carotid arteries (left and right) were excised from healthy female pigs (Pig 1: 33.8 kg, Pig 2: 47 kg) after the animals were euthanized according the Institutional Animal Care Use Committee guidelines from our institution. The specimens were kept in the refrigerator (4°C) overnight in saline solution and tested the next day.
Sonometry experiments
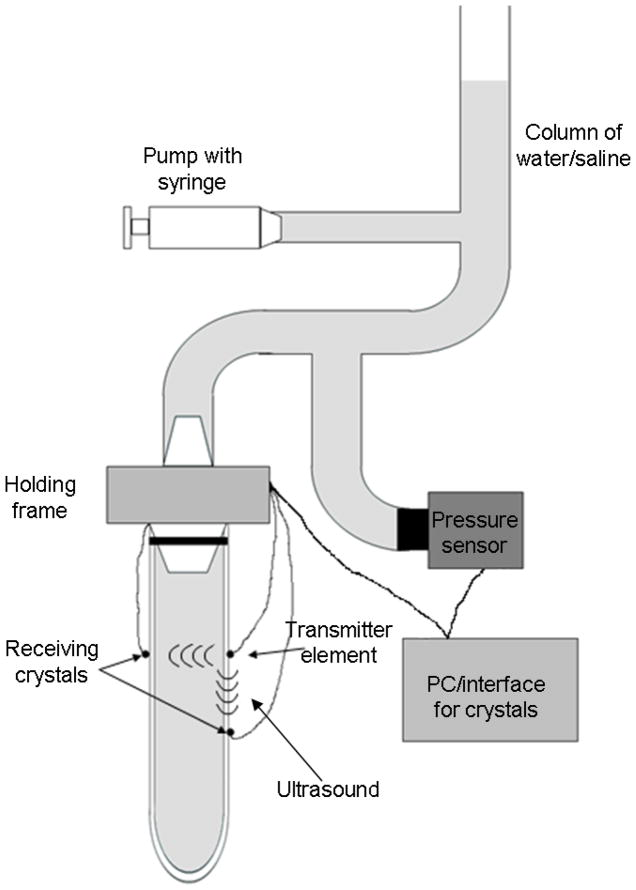
The tubes and the arteries were mounted on a holding frame and cannulized on the upper end while sealed with a suture at the bottom. Before starting the experiments, we made sure that the tube/artery was filled with water/saline and that there were no bubbles inside the structures. The sonometry experiments were performed using a Sonometrics system (Sonometrics Corp. London, ON, Canada) with 1 mm diameter piezoelectric elements. The displacement in the circumferential and the longitudinal directions were measured using 3 piezoelectric elements during pressurization of the tubes/arteries. Two of the elements were set as receivers, and one as a transmitter. The transmitter was placed on one side of the structure, while the element used to measure the diameter changes was placed at the same level on opposite side of the tube/artery. To track the longitudinal motion, the third element was placed on the same side as the transmitter at a distance of 15 mm for the urethane tubes and 20 mm for the arteries. The experimental setup is described in Figure 2. The location for the all the piezoelectric elements was marked prior to the attachment using a ruler, to make sure that the elements location was appropriate. The speed of sound used to calculate the distances from the time of flight was 1480 m/s, since the tubes were filled with water and the arteries with saline solution. The experiments on the urethane tubes were all performed at room temperature, around 22°C.
Fig. 2.
Schematic of the experimental set up. The tubes or arteries were pressurized using and infusion pump that increased the level in a column of water/saline, increasing the transmural pressure. The pressure was measure using a pressure transducer at the level of the water/saline bath. The piezoelectric elements were attached to the walls of the tube/artery. The data from the crystals was digitized using a computer. The tube/artery was sealed on the bottom end with a suture.
The piezoelectric elements were attached to each of the urethane tubes using silicone glue (732 Multi-Purpose Sealant, Dow Corning Corp, Midland, MI). The attachment to the arteries required putting a point of superglue (size of a pin head) on the marked spots, and then using medical adhesive (Hollister Inc. Libertyville, IL, USA). The piezoelectric elements were attached to the superglue. After placing the elements we let the glue cure for 5 to 10 minutes. The tube/artery with the elements was then immersed in a water or saline bath. The sensitivity of each element was maximized using the interface available with the computer before each set of experiments. The pressurization of the structures was performed using an infusion pump (KDS210, Kd Scientific, Holliston, MA) set to deliver water/saline at a specific rate to a column of water, changing the transmural pressure from 10 to around 80 mmHg and then back down to 10 mmHg (Fig. 2). Before recording data, 4 to 5 complete pressurization and depressurization cycles (from 10 to 80 mmHg and back to 10 mmHg) were performed for preconditioning of the tube/artery. This was repeated every time the piezoelectric elements were attached. The data were acquired with the Sonometrics interface and software and a PC; the sampling rate was set to 483.7 Hz, the length of the transmitting pulse to 406.3 ns and an inhibit delay equivalent to 3 mm (as the elements were at all times farther than this). The pressure inside the structure was recorded using a pressure sensor (PX319-015G5V, Omegadyne Inc. Sunbury, OH) set at the level of the crystals. The signal was digitized using an analog input of the Sonometric system. Before the experiments, the pressure sensor was calibrated using a column of water which was set at 3 different levels (10, 50 and 100 mmHg) to establish the calibration curve for the sensor.
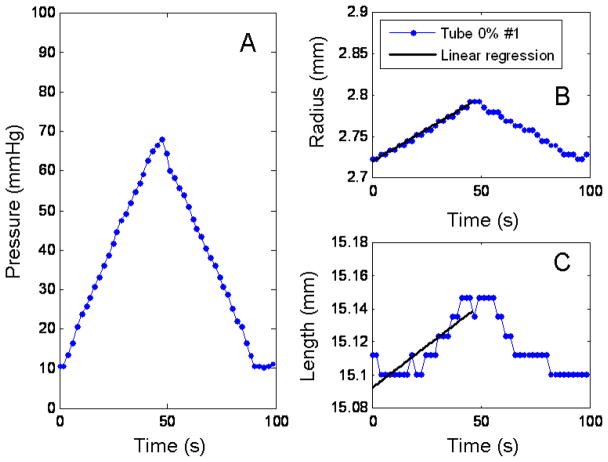
During the analysis of the piezoelectric element data for the tubes, the change in radius and length was linear (Fig 3), therefore a linear regression on the data was done to extrapolate the values of r and l to a 0 mmHg pressure and to decrease the noise. To assess the goodness of the fit the R2 values of the regressions were calculated. The data from the fitting was used in equations (18), (19), (21) and (22) described in the Methods section to calculate the stress and strain and the Young’s modulus using equation (16). Due to the nonlinearity of the artery stress-strain data, the same linear regression procedure was not possible in the arteries.
Fig. 3.
Diameter and length response to a pressurization loop for the 0%#1 urethane tube. Panel A shows the pressure profile going into the tube. Panel B is the response of the diameter to the pressure. Panel C, the response of the length to the pressure. The solid lines in panels B and C are the linear regression of the pressurization data.
To study the properties of healthy pig carotid arteries, the left and the right carotids of pig 1 were tested at room temperature and a pressurization rate of 50 ml/min (pressurization and depressurization loop around 80 seconds). After the piezoelectric elements were attached and the vessel was immersed in the saline, 4 to 5 cycles of preconditioning were done before acquiring data. This preconditioning procedure was done for all the experiments, every time the elements were attached or the artery was taken out of the saline bath.
To evaluate the effect of pressurization rate on the mechanical properties of the excised arteries we used the pump at three different rates. The slower rate infused water at 26.6 ml/min (130 seconds pressurization and depressurization loop). The medium rate was 40 ml/min (around 90 s); and the fast rate was 56 ml/min (the fastest the pump could infuse) took 70 seconds. For these experiments the left carotid artery of pig 2 was used.
To evaluate the ability of this technique to measure the changes in the mechanical properties of arteries, we varied the temperature of the saline bath in which the arteries were submersed during the experiments. Three temperatures were used, 6 °C, 22 °C (room temperature) and 40 °C. The right carotid artery from Pig 2 was immersed in each of the baths and left for 5 minutes for the artery to acclimate. Then we proceeded to do the conditioning pressurizing cycles before acquiring the data.
Mechanical testing in tubes
In order to compare and validate the results of the sonometric experiements, we performed controlled compression tests on urethane samples using a DMA machine (Q800, TA Instruments, New Castle, DE). These tests were done on samples of about 5 × 5 × 5 mm from the same urethane composition mixture as the tubes used for the sonometry experiments. The controlled force test was done to determine the Young’s modulus in a linearly elastic portion of the material. In this test, the loading rate was 1 N/min to a maximum of 0.75 N, which translates to about 5% strain. The same test was repeated in five different samples from the same batch to measure the reproducibility of the compression test.
Results
The changes in the diameter and length of the urethane tubes showed to be linear as it was expected, since these tubes are isotropic, linearly elastic materials. Figure 3 shows changes in diameter and length for pressure loop for the 0% #1 urethane tube. Panel A shows the linear pressure profile generated by the infusion pump from; Panel B, the changes for the diameter with its linear regression. Similarly, Panel C, shows the change in the length to the pressure loop with linear regression is shown in a solid black line. The R2 values for the 0% #1, 0% #2 and 15% tubes were 0.9876, 0.986 and 0.9866 for the diameter and 0.6728, 0.8453 and 0.9030 for the length.
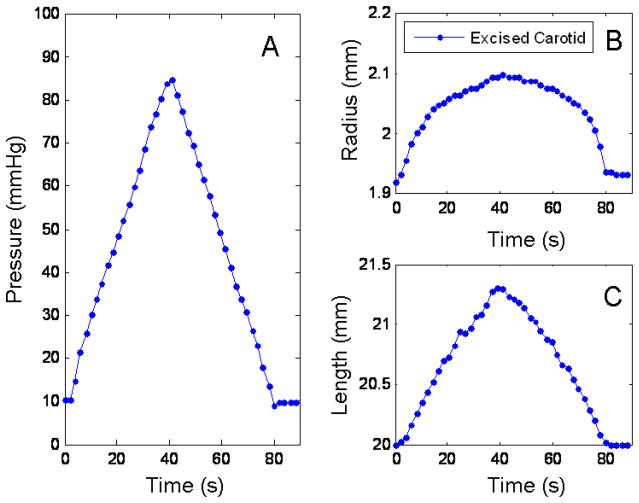
Similarly, Figure 4 shows the response of the diameter and the length of an excised pig carotid artery (right) to pressure. Panel A shows the pressure profile, Panel B, the change in diameter and Panel C, the change in the length. Notice how in this case, the changes in the diameter are not linear, while the changes in the length conserve a linear behavior. The stress-strain relationships for the tubes and the arteries were calculated using equations (18) to (22). The values of r were taken from the piezoelectric elements, and calculated as . The initial h = 0.89 mm for the tubes and 0.5 mm for the arteries (measured using a caliper after testing). The changes in the r and h due to pressure were calculated assuming a constant cross section and using the values for rout from the piezoelectric elements.
Fig. 4.
Diameter and length response to a pressurization loop for the right carotid of pig 1. Panel A shows the pressure profile going into the tube. Panel B is the response of the diameter to the pressure. Panel C, the response of the length to the pressure.
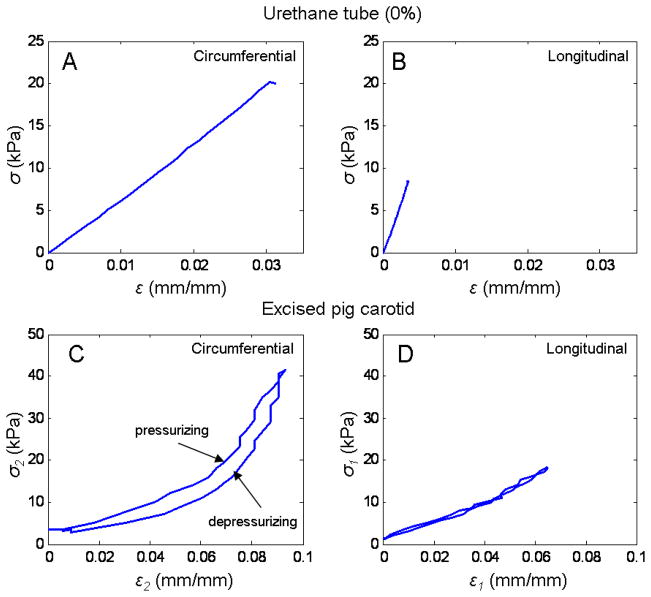
Figure 5 shows the stress-strain relationships in the circumferential and longitudinal directions for the 0% #1 tubes and right carotid artery. In panels A and B are the circumferential and longitudinal stress-strain relationships for the tube. Notice that in this case we only show the pressurization part of the loop since the data is from the linear regression and there was no hysteresis. In panel C and D are the stress-strain in the circumferential and longitudinal directions, respectively.
Fig. 5.
Strain-stress relationships for tube (0%#1) and artery (right carotid artery pig 1). Panel A shows the strain-stress relationship for the urethane tube in the circumferential direction. Panel B, in the longitudinal direction. In the tube since there was no hysteresis, only the calculated values for the stresses and strains from the linear regression during pressurization are shown. Panel C and D, show the relationships between strain and stresses for the excise right pig 1 carotid artery in the circumferential and longitudinal directions, respectively.
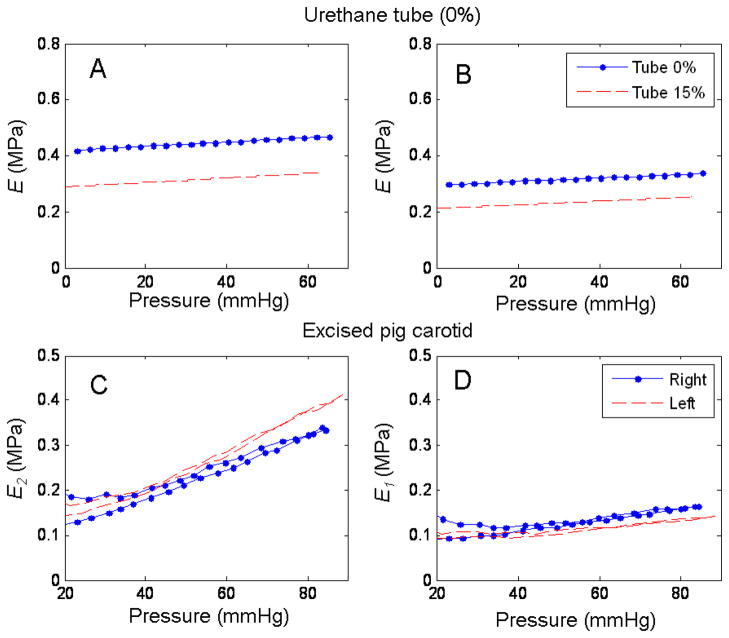
From the stress and strain values from equations (18) to (22), we calculated the values of secant elastic modulus for the tube using (16) and (17). In this case since the tube is a linear elastic material the secant modulus and the Young’s modulus are the same. For the arteries, the secant moduli, E2 and E1 were calculated using the transversely isotropic constitutive equations (14) and (15). In Figure 6, panel A are the results for the 0% #1 and 15% tube using (16), while in panel B are the results using (17). Note that since this is an isotropic material the results from (16) and (17) should agree. In this case the discrepancy can be explained by the low strain registered in the length for all the urethane tubes, which biased the results using (17) since this equation gives more importance to the strain in the longitudinal direction than in the circumferential. Panel C and D, show E2 and E1 for the right and left artery for pig 1.
Fig. 6.
Calculated Young’s moluli for the tubes (0% #1 and 15%) and the right and left carotid artery from pig1. Panels A and B, show the calculated values for E from (16) and (17) for the two tubes (.- for the 0% #1 and -- for the 15% tube). Panels C shows the E2 for the (.-) right and (--) left excised carotid arteries from pig1. Panel D, shows the E1 for the two same two arteries, the legend from C applies to D.
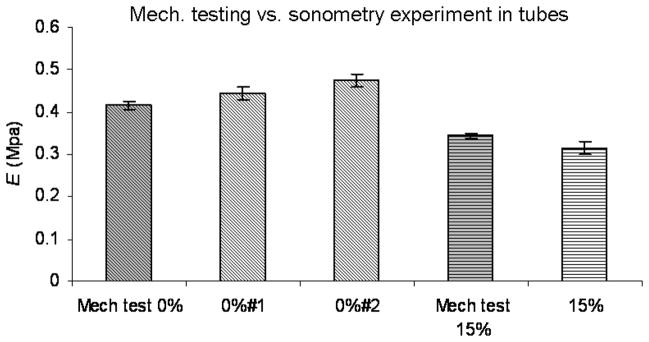
Figure 7 shows the comparison between the results of the Young’s modulus (E) using the sonometry technique and the mechanical test. The first bar shows the result of the compression test in the 0% urethane sample. Bars 2 and 3 are the results of the sonometry experiments on the 0% #1 and 0% #2 tubes. The fourth bar is the result of the mechanical testing on the 15% urethane sample, and the fifth bar, is the results of the sonometry experiment on the 15% urethane tube. The error bars in the mechanical testing are the standard deviation of 5 tests on 5 different samples of the same material. The error bars on the sonometry experiments are the standard deviation of 3 consecutive pressurization loops on each of the tubes.
Fig. 7.
Comparison between the sonometry results in urethane tubes and mechanical testing. First column is the Young’s modulus for the 0% soflex urethane samples. Column 2 and 3 the results for tubes 0%#1 and 0%#2, respectively, with sonometry. Column 4 is the mechanical testing results on the 15% soflex urethane samples. Column 5 is the sonometry results on the 15% tube. The error bars for the mechanical testing represent the standard deviation of the results from 5 different samples of the same material. The error bars for the sonometry results represent the standard deviation of the results from 3 consecutive pressurization loops.
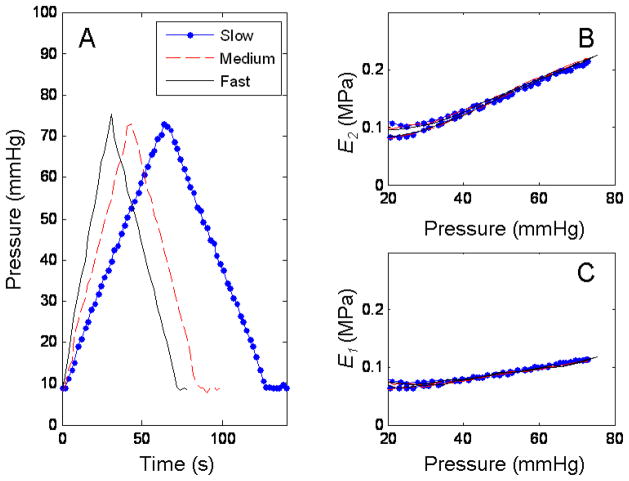
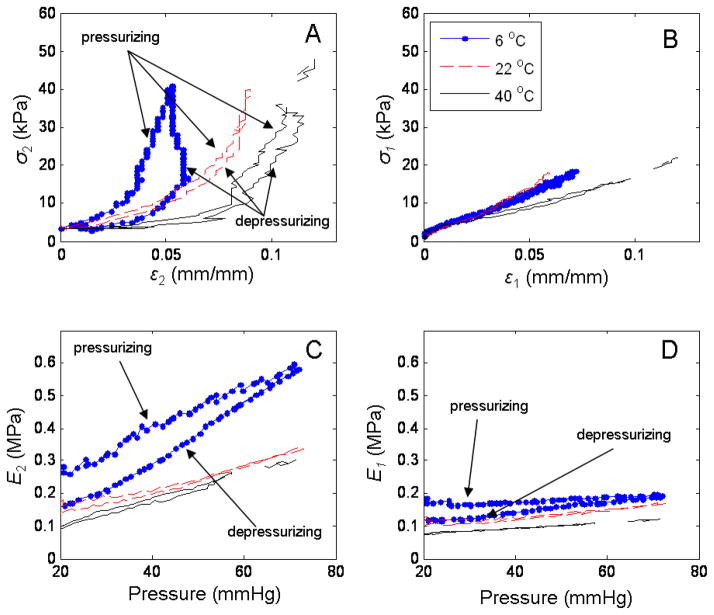
The results of the different pressurization rates on an excised pig carotid artery are shown in Figure 8. Panel A shows the 3 different linear pressurization profiles, slow, medium and fast. Panel B and C show the calculated secant Young’s modulus in the circumferential and longitudinal directions respectively for each of the pump rates. The response of the carotid artery to the different temperatures was as expected. The artery stiffened in cold saline while becoming more compliant in the warn saline. Figure 9 shows the results for the stress-strain relationships and the secant elastic moduli (E1 and E2) as a function of temperature. Panel A and B, shows the stresses and strain in the circumferential and longitudinal direction, respectively. Panel C and D the corresponding secant moduli calculated using (14) and (15).
Fig. 8.
Response of right carotid artery from pig 2 to different pressurization rates. Panel A shows 3 different pressurization rates, slow (.-) (26.6 ml/min), medium (--) (40 ml/min) and fast (−) (56 ml/min). Panel B are the results for the circumferential elastic modulus as a function of pressure for the 3 pressurization rates. Panel C, is the calculated longitudinal moduli for the different pressurization rates. The legend in panel A applies to panels B and C.
Fig. 9.
Temperature effect on strain-stress relationships and elastic moduli calculation in the circumferential and longitudinal directions. Panel A and B show the strain-stress relationships in the circumferential and longitudinal directions respectively, to 3 saline bath temperatures (6 °C (.-), 22°C (--) and 40°C (−)). Panel C and D show E2 and E1 respectively for the 3 different temperatures. Legend from panel B applies to panels A, C and D.
Discussion
The differences in the response of the diameter and the length for the tubes and the arteries are attributed to the difference in the nature of the materials. The tubes are isotropic and linearly elastic in the region of strain that we explored. The behavior of the artery showed a nonlinear behavior in the circumferential direction and almost a linear behavior on the longitudinal direction. In both cases, tubes and arteries, in panel B and C of Figures 3 and 4, it is appreciable that the deformation in both directions was completely reversible, meaning that this testing technique, at this strain and stresses levels, does not cause plastic deformations.
Notice in Figure 3 panel C, the low strain recorded in the longitudinal direction. This is due to the resolution of the system (minimum 11 μm) and the nature of the urethane, which strained in the circumferential direction but it strained very little in the longitudinal one. This low strain affects the calculation of the elastic modulus (E) especially when using (17), since this equation gives more importance to the strain in the longitudinal axis and diminishes the contribution from the circumferential direction. This explains why in Figure 6, panels A and B, the two values for the elastic modulus from equations (16) and (17) deviate from one another in both tubes.
The strain-stress relationships showed in Figure 4, demonstrate the same linear and nonlinear behavior between the tubes and the arteries discussed before. It is important to notice in this figure, the difference in hysteresis in the strain-stress relationship in the artery for the circumferential (Panel C) and longitudinal directions (Panel D). The hysteresis suggests a viscoelastic behavior, characteristic of soft tissues. Since the arterial tissue is an orthotropic material, it is possible that the longitudinal and circumferential directions have different hysteresis in the two directions measured. This might be due to the strain levels that were used our experiments, or it could be the nature of the arterial wall and the distribution of its multiple components (elastin, collagen and smooth muscle).
Figure 6 showed the Young’s modulus for the circumferential (Panel C) and longitudinal (Panel D) directions for two normal, healthy pig carotid arteries. It is important to clarify that the harvesting and storing of the arteries in saline solution overnight before performing the experiments, excluded any participation of the vasoactive components of the arterial wall (smooth muscle) materials. In this study we wanted to show the application of this technique by measuring the passive mechanical properties of the arterial wall. To study the contribution of the smooth muscle to the mechanical properties, the experiments could be performed in oxygenated Krebs solutions (Tremblay et al., 2010). By using vasoactive drugs such as epinephrine and nitroprusside the smooth muscle tone could be altered and the effect on the stiffness of the arterial wall evaluated. In Figure 6, it is possible to see the effect of pressure on the elastic modulus of the passive elements of the arterial wall (elastin and collagen), and how it increases with pressure in a linear fashion. The pressure had more effect on the circumferential than on the longitudinal direction, and this, as we mentioned before, could be due to the levels of strain achieved in our experiments. The values for the elastic modulus observed in our experiments are in the same range as the ones presented in the work by O’Rourke et al., in their systematic review of the clinical applications of the arterial elasticity and the reference values in different vascular beds(O’Rourke et al., 2002). In the same figure, as mentioned before, panel A and B, showed the results of the calculation of E, from (16) and (17) respectively. The discrepancy is attributed to the low strain in the longitudinal direction. Therefore the values for E presented in Figure 7 were obtained from equation (16) which gives prevalence to the strain and the stress in the circumferential direction for the calculation of the Young’s modulus. In this figure, we showed good agreement in the values of E between the sonometry techniques and mechanical testing of urethane samples with percent errors of 6.8% and 13.1 % for the 0% #1 and 0% #2 tubes, respectively, and a percent error of −8.2% for the 15% So-Flex tube.
For the pressurization rates explored in this study, we observed no effect on the mechanical properties of the excised arteries (Fig. 8) or the tubes (data not shown). This could be due to the rates that we used in our experiments, which were determined partially by the limits of the pump. The fastest the pump could infuse saline on the column was at 56 ml/min, which translated into a 70 seconds pressurization loop. The results may differ if the rates could be pushed to 30 seconds or less, where the viscoelastic properties of the arteries could have a bigger impact on the response of the wall to the changing pressure.
The response of the arterial wall mechanics to temperature changes was expected. Previous work has shown similar results, where the arteries become stiffer in cold solutions and more compliant in warm ones (Atienza et al., 2007, Guinea et al., 2005, Tsatsaris, 2005). In our case, Figure 9 showed the changes in the strain-stress relationships, where a progression is observed from the cold saline solution (6 °C) to the warm one (40 °C). This effect was more evident in the circumferential direction, while for the longitudinal modulus, the lines for the different temperatures seem to deviate from one another at our maximum strain values. Another interesting observation is the variation of hysteresis in the circumferential direction as a function of temperature (Figure 9, panel A). The maximum hysteresis was observed at the coldest saline solution, while the least amount of hysteresis was at room temperature. This would suggest that temperature plays a significant role in the viscoelastic behavior of the arterial wall mechanics.
Some of the disadvantages of our technique included the minimum resolution of 11 μm mentioned before, which could be a problem when testing materials that strain different amounts in the two directions, like in our case, or when testing stiffer materials with high E, that strain very little. A possible to solution to this problem could be to space the piezoelectric elements more in the longitudinal direction, this way the amount of strain measure would increase. In our experiments, the maximum pressure of 80 or 90 mmHg was determined by the height of the column of water/saline, which couldn’t go any higher due to space limitation. Exploring a wider range of pressures (up to 150 mmHg) could have given more information of the behavior in the longitudinal direction, and possibly explore the nonlinear properties in this direction. Another disadvantage in our experiments was the maximum infusion rate that the pump could achieve. This potentially limited our experiments in studying the dependence of the mechanical properties due to the stressing rate. Finally, it is important to mention that the change of saline baths for the temperature dependence experiment, caused some interruption of the signal from the piezoelectric elements at some pressure levels, as could be seen in Figure 9.
Nevertheless, we have demonstrated that application of piezoelectric elements presented in this work can be of potential use in the study and characterization of the biaxial mechanical properties of arterial walls in their natural shape. The use of oxygenated Krebs or Ringer’s solutions instead of a saline bath could potentially allow the study of the vasoactive components of the arterial wall. Finally, even though this would be an invasive technique, it could be used for in vivo animal models and could give valuable information of the role of biaxial biomechanics of arterial wall in different physiological and diseases processes.
Conclusion
In this work we presented a novel application of piezoelectric elements and sonometry to study the in situ properties of arteries and soft tubes in two different directions (circumferential and longitudinal). We presented the equations for isotropic and transversely isotropic materials, and validated the technique in urethane tubes against mechanical testing. Finally we showed the application of the technique in arteries and compared the results to values in the literature and we found good agreement. Therefore we propose this approach for the study of the biaxial mechanical properties in arteries, in nondestructive way, while conserving the natural geometry of the structure being tested.
References
- ATIENZA JM, GUINEA GV, ROJO FJ, BURGOS RJ, GARCIA-MONTERO C, GOICOLEA FJ, ARAGONCILLO P, ELICES M. The influence of pressure and temperature on the behavior of the human aorta and carotid arteries. Revista Española de Cardiologia. 2007;60:259–67. [PubMed] [Google Scholar]
- BANK AJ, KAISER DR, RAJALA S, CHENG A. In vivo human brachial artery elastic mechanics: effects of smooth muscle relaxation. Circulation. 1999;100:41–47. doi: 10.1161/01.cir.100.1.41. [DOI] [PubMed] [Google Scholar]
- DEBES JC, FUNG YC. Biaxial mechanics of excised canine pulmonary arteries. American Journal of Physiology. 1995;269:H433–442. doi: 10.1152/ajpheart.1995.269.2.H433. [DOI] [PubMed] [Google Scholar]
- DOBRIN PB, CANFIELD TR. Elastase, collagenase, and the biaxial elastic properties of dog carotid artery. American Journal of Physiology. 1984;247:H124–31. doi: 10.1152/ajpheart.1984.247.1.H124. [DOI] [PubMed] [Google Scholar]
- DOLAN E, THIJS L, LI Y, ATKINS N, MCCORMACK P, MCCLORY S, O’BRIEN E, STAESSEN JA, STANTON AV. Ambulatory arterial stiffness index as a predictor of cardiovascular mortality in the Dublin Outcome Study. Hypertension. 2006;47:365–370. doi: 10.1161/01.HYP.0000200699.74641.c5. [DOI] [PubMed] [Google Scholar]
- FULTON JS, MCSWINEY BA. The pulse wave velocity and extensibility of the brachial and radial artery in man. Journal of Physiology. 1930;69:386–392. doi: 10.1113/jphysiol.1930.sp002658. [DOI] [PMC free article] [PubMed] [Google Scholar]
- GUINEA GV, ATIENZA JM, ELICES M, ARAGONCILLO P, HAYASHI K. Thermomechanical behavior of human carotid arteries in the passive state. Am J Physiol Heart Circ Physiol. 2005;288:H2940–5. doi: 10.1152/ajpheart.01099.2004. [DOI] [PubMed] [Google Scholar]
- HARADA A, OKADA T, NIKI K, CHANG D, SUGAWARA M. On-line noninvasive one-point measurements of pulse wave velocity. Heart and Vessels. 2002;17:61–68. doi: 10.1007/s003800200045. [DOI] [PubMed] [Google Scholar]
- LU X, YANG J, ZHAO JB, GREGERSEN H, KASSAB GS. Shear modulus of porcine coronary artery: contributions of media and adventitia. American Journal of Physiology - Heart and Circulation Physiology. 2003;285:H1966–1975. doi: 10.1152/ajpheart.00357.2003. [DOI] [PubMed] [Google Scholar]
- MARRA SP, KENNEDY FE, KINKAID JN, FILLINGER MF. Elastic and rupture properties of porcine aortic tissue measured using inflation testing. Cardiovascular Engineering. 2006;6:123–131. doi: 10.1007/s10558-006-9021-5. [DOI] [PubMed] [Google Scholar]
- O’ROURKE MF, STAESSEN JA, VLACHOPOULOS C, DUPREZ D, PLANTE GE. Clinical applications of arterial stiffness; definitions and reference values. American Journal of Hypertension. 2002;15:426–44. doi: 10.1016/s0895-7061(01)02319-6. [DOI] [PubMed] [Google Scholar]
- OBARA S, HAYASHI S, HAZAMA A, MURAKAWA M, KATSUDA S. Correlation between augmentation index and pulse wave velocity in rabbits. Journal of Hypertension. 2009;27:332–340. doi: 10.1097/HJH.0b013e32831ac951. [DOI] [PubMed] [Google Scholar]
- REDDY JN. An Introduction to Continuum Mechanics with Applications. Cambridge University Press; 2008. [Google Scholar]
- SACKS MS, SUN W. Multiaxial mechanical behavior of biological materials. Annual Review of Biomedical Engineering. 2003;5:251–284. doi: 10.1146/annurev.bioeng.5.011303.120714. [DOI] [PubMed] [Google Scholar]
- TREMBLAY D, CARTIER R, MONGRAIN R, LEASK RL. Regional dependency of the vascular smooth muscle cell contribution to the mechanical properties of the pig ascending aortic tissue. J Biomech. 2010;43:2448–51. doi: 10.1016/j.jbiomech.2010.04.018. [DOI] [PubMed] [Google Scholar]
- TSATSARIS A. Effect of temperature increase on the distensibility of porcine thoracic aorta. International Journal of Artificial Organs. 2005;29:887–91. doi: 10.1111/j.1525-1594.2005.00152.x. [DOI] [PubMed] [Google Scholar]
- WOODRUM DA, ROMANO AJ, LERMAN A, PANDYA UH, BROSH D, ROSSMAN PJ, LERMAN LO, EHMAN RL. Vascular wall elasticity measurement by magnetic resonance imaging. Magnetic Resonance in Medicine. 2006;56:593–600. doi: 10.1002/mrm.20991. [DOI] [PubMed] [Google Scholar]
- WRIGHT JE, DREXLER ES, SLIFKA AJ, MCCOWAN CN, IV, YDD, SHANDAS R. Stress and strain in rat pulmonary artery material during a biaxial bubble test. Biomedical Sciences Instrumentation. 2004;40:303–308. [PubMed] [Google Scholar]


