

Abstract
Photoacoustic microscopy (PAM) offers label-free, optical absorption contrast. A high-speed, high-resolution PAM system in an inverted microscope configuration with a laser pulse repetition rate of 100,000 Hz and a stationary ultrasonic transducer was built. Four-dimensional in vivo imaging of microcirculation in mouse skin was achieved at 18 three-dimensional volumes per second with repeated two-dimensional raster scans of 100 by 50 points. The corresponding two-dimensional B-scan (50 A-lines) frame rate was 1800 Hz, and the one-dimensional A-scan rate was 90,000 Hz. The lateral resolution is 0.23±0.03 μm for Au nano-wire imaging, which is 2.0 times below the diffraction limit.
Modern optical microscopes are indispensable tools for life scientists to visualize the morphological details of cellular and subcellular anatomy, comprehend fundamental biological processes, and solve biological problems. Optical-resolution photoacoustic microscopy (OR-PAM), a major method of photoacoustic tomography (PAT) [1–2], has been recognized as a novel, optical microscopic method with excellent, label-free optical absorption contrast and high lateral resolution [3–7]. The absorption contrast enables imaging of nonfluorescent molecules.
In OR-PAM, transient acoustic waves are generated by laser-induced thermal expansion when nanosecond laser pulse energy is deposited into a focal volume of biological tissue [3]. Hemoglobin in blood, as well as melanin in skin, hair, iris, retina tissues, etc., produces excellent endogenous contrast [8–10]. Functional PAT based on either the quantitative oxygen-saturation measurement of hemoglobin or the flow speed measurement of red blood cells (RBCs) further extends the contrast mechanisms for in vivo biomedical imaging [11–12]. The conjugation of weakly fluorescent, low-scattering, low-absorbing, endogenous targets in non-pigmented cells with exogenous contrast agents such as gold nanoparticles promises in vivo detection of circulating cancer cells [13]. A recently reported submicron-resolution OR-PAM system expanded the scope to cellular and sub-cellular organelles [7]. In this Letter, we demonstrate a high resolution OR-PAM system with almost two orders of magnitude of imaging speed improvement over our previously reported submicron OR-PAM system [7] and minimum PA signal loss within its entire imaging field of view (FOV).
The schematic of our imaging system is shown in Fig. 1. For cellular imaging applications, the small imaging field of view (FOV) and the access to both sides of tissue samples favor this system design with two-dimensional (2D) optical scan and a single, stationary ultrasonic transducer. A pulsed laser (532 nm wavelength λ, 2 ns pulse duration, and 100 kHz pulse repetition rate) was used as the light source. It was generated from a second harmonic crystal (KTP) by a diode-pumped, and actively E-O Q-switched Nd:YVO4 laser operating at 1064 nm wavelength. A 2D Galvo system scanned the collimated laser beam pivotally through the pupil of the optical objective (Olympus LCPlanFI, 0.6 NA, infinity corrected). Two achromatic lenses (75 mm focal length) formed a standard 4-f system that imaged the scanning Galvo mirrors to the pupil location of the objective. The system was designed in an inverted microscope configuration with the sample illuminated by the laser beam from the bottom. The excited PA signal was detected by a stationary ultrasonic transducer through water coupling.
Fig. 1.
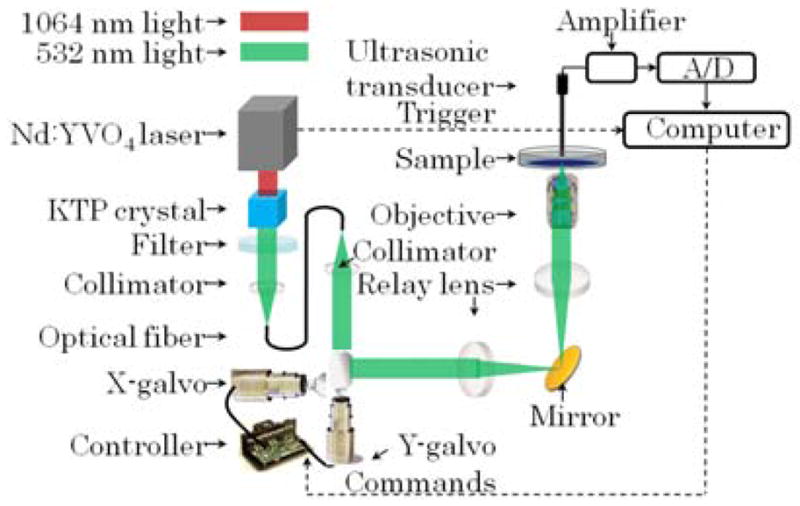
(Color online) Schematic of the high-speed, high-resolution optical-resolution photoacoustic microscopy (OR-PAM) system.
Two types of stationary, ultrasonic transducers were custom-built according to the trade-off between imaging FOV and detection sensitivity. The non-focused transducer (lead magnesium niobate-lead titanate single crystal) had an effective acoustic NA of 0.05 [14]. The focused ultrasonic transducer (LiNbO3 single crystal) had an acoustic NA of 0.2. Both transducers had a center frequency of 40 MHz.
The detected PA signal was amplified and digitized with an analog-to-digital (A/D) conversion card (ATS-9462 card, Alazar Inc.) housed in a quad-core workstation. For initial alignment, both the sample and the ultrasonic transducer could be manually translated by three-dimensional mechanical stages that are not shown in Fig. 1. The trigger signal, synchronized with the laser pulses, was sent to the computer as the A-line trigger signal of the imaging system. Commands to the x-y Galvo scanning system were generated by an NI-6713 card housed in the workstation to control the two-dimensional (2D) optical scan. Three-dimensional (3D) imaging data was streamed to the computer’s main RAM by a data acquisition thread and was simultaneously delivered to multiple threads for real-time image processing and displaying.
The lateral resolution of the OR-PAM system was determined by the NA of the optical objective [7]. We evaluated the system’s lateral resolution by imaging Au nanowire particles (product number 50-30-6000, 30 by 6000 nm, Nanopartz, Inc.). A total of 11 measurements of the line spread function were documented and analyzed for the lateral resolution. The laser beam of 5-nJ energy per pulse was scanned point by point on the sample surface, with 256 A-line measurements at each point. A Gaussian amplitude fitting of the measured line spread function is shown in Fig. 2. The average lateral resolution is 0.23 μm, and the standard deviation is 0.03 μm. The lateral resolution is 2.0 times less than the optical diffraction limit of 0.45 μm (0.51λ/NA), probably owing to nonlinear optical absorption of Au nanoparticles and to nonlinear acoustic signal amplification due to laser generated nano-bubbles [15]. This is the first experimental report on super-resolution due to apparent phase transition from liquid to vapor.
Fig. 2.
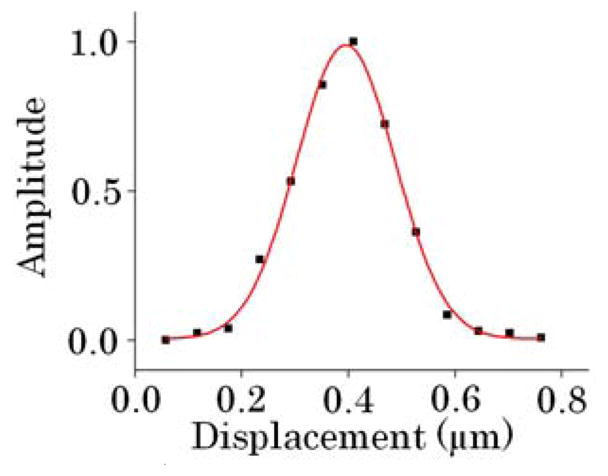
(Color online) Gaussian amplitude curve fitting of a measured Au nano-wire line spread function.
In order to reduce the jitter of the fast axis scan mirror during imaging, a sinusoidal waveform was applied on the fast axis command line. We used only the forward portion of each sinusoidal scan for imaging. An improved imaging protocol using both the forward and backward scan parts will double the imaging speed if the slight misalignment between the forward scan frame and the backward scan frame can be corrected or neglected. The slow axis position was updated before each sinusoidal scan of a B-mode image. The 3D data was usually presented as a 2D maximum amplitude projection (MAP) PA image after interpolation transformation from a sinusoidal scan to a linear scan and assigning the gray scale value as the maximum PA signal amplitude along one A-line perpendicular to the X-Y plane.
The imaging FOV of the non-focused ultrasonic transducer was quantified from the 2D MAP PA image (Fig. 3a) of a 500 μm by 500 μm area of the black tape. Two MAP curves are shown in Fig. 3b (along the fast axis) and Fig. 3c (along the slow axis). Gaussian amplitude fittings of the two plots gave a full width at a half maximum (FWHM) FOV of 326 μm along the fast (X) axis and of 291 μm along the slow (Y) axis.
Fig. 3.

(Color online) Imaging field of view (FOV) calibration: (a) Maximum amplitude projection (MAP) PA image of black tape patch acquired with the non-focused ultrasonic transducer. Gaussian amplitude fittings of the MAP PA signals along (b) the fast (X) axis and (c) the slow (Y) axis give a full width at half maximum (FWHM) FOV of 326 μm along the fast axis (X) and of 291 μm along the slow (Y) axis. (d) MAP PA image of a black tape patch acquired with the focused ultrasonic transducer. Gaussian amplitude fittings of the MAP PA signals along (e) the fast (X) axis and (f) the slow (Y) axis give a FWHM FOV of 33 μm along the fast (X) axis and of 67 μm along the slow (Y) axis.
Accordingly, the imaging FOV of the focused ultrasonic transducer was quantified from the 2D MAP PA image (Fig. 3d) of a 150 μm by 150 μm area of the same black tape. Two MAP curves are shown in Fig. 3e (along the fast axis) and Fig. 3f (along the slow axis). Gaussian amplitude fittings of the two plots gave a FWHM FOV of 33 μm in the fast (X) axis direction and of 67 μm in the slow (Y) axis direction. The asymmetry between the two axes is due to the aspherical focusing of the ultrasonic transducer.
The peak response of the non-focused ultrasonic transducer was recorded when it was 650 μm away from the black tape sample surface. The peak response of the focused ultrasonic transducer was recorded when it was 2 mm away from the black tape sample surface. The focused ultrasonic transducer provided a 6 dB greater peak response than the non-focused ultrasonic transducer at the cost of imaging FOV.
To demonstrate cellular imaging, a thin blood smear was prepared, and a 250 μm × 125 μm patch on the specimen slide was imaged with the stationary, non-focused ultrasonic transducer with a laser pulse energy of 20 nJ. Each B-scan image had 2048 A-lines. 512 B-mode images were acquired for each 3D image. The RBCs in Fig. 4 show opposite contrast to conventional transmission optical microscopy. Shadows at the center of the RBCs are due to their biconcave structures.
Fig. 4.
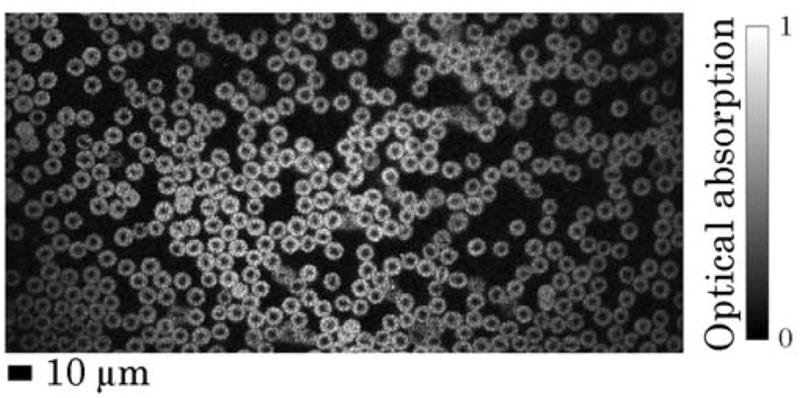
Maximum amplitude projection (MAP) PA image of red blood cells on a 250 μm × 125 μm specimen slide patch.
The frame rates of the B-mode imaging modes were acquired by measuring the periods of fast-axis scanning waveforms with an oscilloscope. For frame sizes of 4096, 2048, and 1024 A-lines, the frame rates were 22, 43, and 81 Hz, respectively. The ratio of the overhead time to the frame period decreased with increasing frame size.
To demonstrate in vivo, real-time, four-dimensional (4D) microcirculation imaging, repeated 2D raster scans of 100 by 50 points on a 100 μm × 50 μm skin patch on a mouse ear were made with a laser pulse energy of 26 nJ. A data set of 256 3D images was continuously recorded in 14.2 seconds and streamed into a 4D microcirculation movie (Media 1) provided in the supplemental file. A 4D imaging speed of 18 3D volumes per second was achieved for repeated 2D raster scans of 100 by 50 points. The corresponding 2D B-scan (50 A-lines) frame rate was 1800 Hz while the 1D A-scan rate was 90,000 Hz. A MAP image extracted from the 4D movie is shown in Fig. 5, with flowing RBC clusters identified with red arrows. No damage to the mouse ear tissue was observed after imaging with 40 nJ laser pulse energy [7].
Fig. 5.
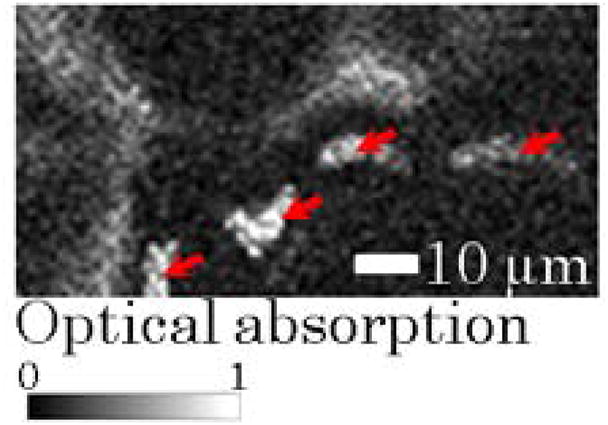
(Color online) Representative maximum amplitude projection (MAP) PA image of a 50 μm × 25 μm mouse ear patch extracted from a 4D movie (Media 1).
Although imaging speed can be increased as the laser pulse repetition rate is improved, the final imaging speed is limited by practical factors such as laser safety, imaging depth, and Q-switch noise coupled into the data acquisition system. Our current setup works only in transmission mode, which limits its applications. However, we are developing a reflection-mode system.
In summary, we demonstrated a high-speed, high-resolution OR-PAM system in an inverted microscope configuration with a nanosecond pulsed laser (pulse repetition rate 100,000 Hz), and a stationary ultrasonic transducer. The lateral resolution is 0.23 ± 0.03 μm for Au nano-wire imaging, which is 2.0 times below the diffraction limit. 4D imaging of microcirculation in a mouse ear was achieved at 18 3D volumes per second for repeated 2D raster scans of 100 by 50 points. The corresponding 2D B-scan (50 A-lines) frame rate was 1800 Hz. The high imaging speed makes this cellular imaging system suitable for demanding dynamic cellular imaging applications such as in vivo flow cytometry of circulating cancer cells conjugated with Au nano-particles.
Supplementary Material
Acknowledgments
We gratefully thank the National Institutes of Health for supporting grants R01 EB000712, R01 EB008085, R01 CA134539, U54 CA136398, R01 CA157277, P41-EB2182. Help from Dr. Dakang Yao in preparing samples is appreciated. L.W. has a financial interest in Microphotoacoustics, Inc. and Endra, Inc., which, however, did not support this work.
Extended references
- 1.Wang LV. Prospects of photoacoustic tomography. Medical Physics. 2008;35(12):5758–5767. doi: 10.1118/1.3013698. [DOI] [PMC free article] [PubMed] [Google Scholar]
- 2.Wang Lihong. Multiscale photoacoustic microscopy and computed tomography. Nature Photon. 2009;3:503–509. doi: 10.1038/nphoton.2009.157. [DOI] [PMC free article] [PubMed] [Google Scholar]
- 3.Maslov K, Zhang HF, Hu S, Wang LV. Optical-resolution photoacoustic microscopy for in vivo imaging of single capillaries. Optics Letters. 2008;33:929–931. doi: 10.1364/ol.33.000929. [DOI] [PubMed] [Google Scholar]
- 4.Ku G, Maslov K, Li L, Wang LV. Photoacoustic microscopy with 2-μm transverse resolution. J Bio Opt. 2010;15(2):09322SSR. doi: 10.1117/1.3339912. [DOI] [PMC free article] [PubMed] [Google Scholar]
- 5.Rao Bin, Li Li, Maslov Konstantin, Wang Lihong. Hybrid-scanning optical-resolution photoacoustic microscopy for in vivo vasculature imaging. Opt Lett. 2010;35:1521–1523. doi: 10.1364/OL.35.001521. [DOI] [PMC free article] [PubMed] [Google Scholar]
- 6.Xie Zhixing, Jiao Shuliang, Zhang Hao F, Puliafito Carmen A. Laser-scanning optical-resolution photoacoustic microscopy. Opt Lett. 2009;34:1771–1773. doi: 10.1364/ol.34.001771. [DOI] [PubMed] [Google Scholar]
- 7.Maslov Konstantin, Ku Geng, Wang Lihong V. Photoacoustic microscopy with submicron resolution. Proc SPIE. 2010;7564:75640W. [Google Scholar]
- 8.Zhang HF, Maslov K, Wang LV. In vivo imaging of subcutaneous structures using functional photoacoustic microscopy. Nat Protoc. 2007;2(4):797–804. doi: 10.1038/nprot.2007.108. [DOI] [PubMed] [Google Scholar]
- 9.Hu Song, Rao Bin, Maslov Konstantin, Wang Lihong V. Label-free photoacoustic ophthalmic angiography. Opt Lett. 2010;35:1–3. doi: 10.1364/OL.35.000001. [DOI] [PMC free article] [PubMed] [Google Scholar]
- 10.Jiao Shuliang, Jiang Minshan, Hu Jianming, Fawzi Amani, Zhou Qifa, Kirk Shung K, Puliafito Carmen A, Zhang Hao F. Photoacoustic ophthalmoscopy for in vivo retinal imaging. Opt Express. 2010;18:3967–3972. doi: 10.1364/OE.18.003967. [DOI] [PMC free article] [PubMed] [Google Scholar]
- 11.Zhang HF, Maslov K, Stoica G, Wang LV. Functional photoacoustic microscopy for high-resolution and noninvasive in vivo imaging. Nat Biotechnol. 2006;24(7):848–851. doi: 10.1038/nbt1220. [DOI] [PubMed] [Google Scholar]
- 12.Yao Junjie, Maslov Konstantin I, Shi Yunfei, Taber Larry A, Wang Lihong V. In vivo photoacoustic imaging of transverse blood flow by using Doppler broadening of bandwidth. Opt Lett. 2010;35:1419–1421. doi: 10.1364/OL.35.001419. [DOI] [PMC free article] [PubMed] [Google Scholar]
- 13.Zharov Vladimir P, Galanzha Ekaterina I, Shashkov Evgeny V, Khlebtsov Nicolai G, Tuchin Valery V. In vivo photoacoustic flow cytometry for monitoring of circulating single cancer cells and contrast agents. Opt Lett. 2006;31:3623–3625. doi: 10.1364/ol.31.003623. [DOI] [PubMed] [Google Scholar]
- 14.Zhou Q, Xu X, Gottlieb EJ, Sun L, Cannata JM, Ameri H, Humayun MS, Han P, Shung KK. PMN-PT single crystal, high-frequency ultrasonic needle transducers for pulsed-wave Doppler application. IEEE Trans Ultrason Ferroelectr Freq Control. 2007;54:668–75. doi: 10.1109/tuffc.2007.290. [DOI] [PubMed] [Google Scholar]
- 15.Galanzha EI, Shashkov EV, Spring PM, Suen JY, Zharov VP. In vivo, Noninvasive, Label-Free Detection and Eradication of Circulating Metastatic Melanoma Cells Using Two-Color Photoacoustic Flow Cytometry with a Diode Laser. Cancer Res. 2009;69:7926–7934. doi: 10.1158/0008-5472.CAN-08-4900. [DOI] [PMC free article] [PubMed] [Google Scholar]
Associated Data
This section collects any data citations, data availability statements, or supplementary materials included in this article.