Abstract
Increased arterial stiffness and blood pressure are characteristic of humans and adult mice with reduced elastin levels caused by aging or genetic disease. Direct associations have been shown between increased arterial stiffness and hypertension in humans, but it is not known whether changes in mechanical properties or increased blood pressure occur first. Using genetically modified mice with elastin haploinsufficiency (Eln+/−), we investigated the temporal relationship between arterial mechanical properties and blood pressure throughout postnatal development. Our results show that some mechanical properties are maintained constant regardless of elastin amounts. The peak diameter compliance for both genotypes occurs near the physiologic pressure at each age, which acts to provide maximum pulse dampening. The stress-strain relationships are similar between genotypes and become nonlinear near the systolic pressure for each age, which serves to limit distension under high pressure. Our results also show that some mechanical properties are affected by reduced elastin levels and that these changes occur before measurable changes in blood pressure. Eln+/− mice have decreased aortic diameter and compliance in ex vivo tests that are significant by postnatal day 7 and increased blood pressure that is not significant until postnatal day 14. This temporal relationship suggests that targeting large arteries to increase diameter or compliance may be an effective treatment for human hypertension.
Keywords: extracellular matrix, vasculature, vessels
the conducting arteries in vertebrates are composed of a specialized extracellular matrix (ECM) that is designed to provide elastic recoil that dampens the pulse pressure in distal arteries and reduces the work of the heart. The major ECM components are elastin and collagen, and the ratio of these proteins primarily determines the passive mechanical behavior of the large elastic arteries. Collagen is 100–1,000 times stiffer than elastin; hence, vessels become stiffer and their elastic recoil function is compromised as the ratio of elastin to collagen is decreased (5). Arterial wall stiffness, as measured by pulse wave velocity (PWV), is independently associated with hypertension in humans and is increased even at the very early stages of the disease, suggesting that it may be a causative factor and not a resulting symptom of essential hypertension (18).
Elastin amounts in humans are decreased through elastic fiber fragmentation in normal aging or through genetic mutations that affect elastin synthesis. Genetic mutations that lead to functional elastin haploinsufficiency have been linked to two inherited diseases, supravalvular aortic stenosis and Williams syndrome (7, 19). The cardiovascular phenotypes of these diseases include hypertension, aortic stenosis, increased arterial stiffness, and eventual cardiac failure and death. The link between reduced elastin levels and increased arterial stiffness and hypertension supports the idea that hypertension may be caused by changes in vessel wall composition and the consequent changes in mechanical properties.
Elastin is encoded by a single gene; therefore, the contribution of elastin to arterial stiffness and hypertension can be studied in a controlled manner with genetically modified mice. Adult Eln+/− mice have ∼50% of the normal elastin levels and have increased blood pressure; smaller, thinner arteries; and unique changes in the lamellar wall structure (8, 17). Previous work (11) using adult mice with graded elastin amounts (between 30 and 120%) has shown that arterial stiffness correlates with high blood pressure and is inversely related to elastin amounts.
In adult mice with reduced elastin, both increased stiffness and increased blood pressure are present; therefore, it is not possible to determine which parameter changed first or if they changed simultaneously during postnatal development. In this work, our goal is to examine the temporal relationship between mechanical properties and blood pressure in wild-type (WT) and Eln+/− mice at various ages. For the mechanical properties, we examined the stiffness, or its inverse, compliance, as defined by ex vivo pressure-diameter relationships. We also examined the circumferential stress-stretch relationships, incremental elastic modulus, and PWV. Our hypothesis is that changes in mechanical properties will be significantly different in Eln+/− mice compared with WT earlier in development than changes in blood pressure. While confirming this hypothesis will not show a causal relationship between changes in mechanical properties and increased blood pressure, it will either support or contradict the idea that increased stiffness may be a required precursor to essential hypertension.
MATERIALS AND METHODS
Animals.
Male and female C57BL/6J WT and Eln+/− mice (16) at approximately postnatal days (P) 3, 7, 14, 21, 30, and 60 were used for all studies. The actual ranges after P3 were P7–8, P14–15, P21–24, P30–34, and P60–64. All protocols were approved by the Saint Louis University Institutional Animal Care and Use Committee.
Blood pressure.
Male and female mice were anesthetized with 1.5% isoflurane. Body temperature was maintained with a heat lamp (P3–14) or with a feedback-controlled heating pad and rectal probe (P21–60). For older mice (P21–60), arterial pressure was measured using a solid-state (SS) catheter (1.2F; Scisense). For younger mice (P3–14), the arteries are too small for a SS catheter, so mean left ventricular (LV) pressure was measured using a fluid-filled (FF) catheter (MLT 844; AD Instruments), as previously described (22). The systolic LV pressure was calculated from the mean LV pressure assuming that the LV diastolic pressure was zero. The pressure in P21 mice was measured with both the SS and FF catheters to compare the methods.
Weights and morphology.
Each mouse was killed and weighed, and the chest was opened to image the major arteries. The length of the ascending aorta from the base of the heart to the innominate artery was measured using Image J software (NIH). Small charcoal particles were placed on the left carotid artery, and the length between particles before and after vessel removal was used to determine the in vivo axial stretch ratio. The aorta and carotid were placed in physiologic saline for mechanical testing (males) or used for a separate study (females). The heart was washed, blotted, and weighed. Normalized total heart weight was calculated by dividing the heart weight (mg) by the body weight (g).
Mechanical testing and unloaded dimensions.
Mechanical testing was performed on ascending aortas and left carotid arteries from male mice using a pressure myograph (Danish Myotechnology), as previously described (2, 22). Briefly, each artery was mounted in the test system in physiologic saline, stretched to its approximate in vivo length, and preconditioned. Each artery was then pressurized three times from zero to the maximum pressure for each age in discrete pressure steps. The overall inflation rate was maintained between 1 and 2 mmHg/s for all ages. P3 left carotid artery was not tested because it was too small to mount on the test system. After being tested, the arteries were removed and cut into 2–3 rings, ∼0.2-mm thick. The rings were placed in physiologic saline and imaged to measure the unloaded dimensions. The aorta rings were then cut radially and imaged again to calculate residual strain as measured by the opening angle (3).
Data analysis.
The pressure, outer diameter, and longitudinal force were recorded, and the third cycle was used for data analysis using custom scripts in Matlab software (Mathworks). For calculating the outer diameter at specific pressures, the pressure-diameter curves were fit to:
| (1) |
where dout is the outer diameter, p is the measured pressure, and a-d are constants (9). All curves fit the equation with an R2 ≥ 0.97. The diameter compliance, Cd, was calculated as the derivative of Eq. 1 with respect to pressure (Cd = ∂dout/∂p) and is an inverse measure of artery stiffness. The inner diameter for each artery, din, was calculated from the unloaded dimensions, axial stretch ratio, and loaded outer diameter at each pressure, assuming incompressibility (25). Circumferential strain was determined using the average circumferential stretch ratio, λc:
| (2) |
where Din and Dout are the unloaded inner and outer diameters measured from the cut rings. Average circumferential wall stress, σc, was calculated assuming an incompressible, thin-walled cylinder with no shear stress:
| (3) |
The Hudetz incremental elastic modulus, HM (13), was calculated as an additional measure of artery stiffness:
| (4) |
PWV, which is directly related to the incremental elastic modulus (1), was calculated as a third measure of arterial stiffness:
| (5) |
where A is the internal area of the artery and can be calculated from din assuming a circular cross section, ρb is the density of blood (assumed to be 1 g/ml), and ∂A/∂p can be calculated from Eq. 1 after the appropriate substitutions for the dimensions.
Statistics.
A general linear model (GLM) was used to determine the effects of age, genotype, and sex (when applicable) and all two-way interactions between those factors on the weights, morphology, systolic pressure, and normalized mechanical parameters (i.e., deformed outer diameter at systolic pressure). A GLM was also used to determine the effects of genotype, applied pressure and the interactions between genotype and applied pressure for each age on the mechanical test data (diameter and compliance). R2 and the significant P values for each model are provided in results. Genotype differences are the primary interest of our study; therefore, additional comparisons between genotypes for each age and pressure were performed using two-tailed t-tests assuming unequal variance. Statistically significant t-test results are presented in results. Outliers that were more than 3 SDs from the mean were not included in the statistical analyses. Three mice were eliminated as outliers for low pressure readings. Low pressure readings may be caused by improper placement of the catheter. Two aortas and two carotids were eliminated as outliers from the mechanical test data. Outliers in the mechanical test data may be caused by loose connective tissue that cannot be removed or slow leaks that are not detected during testing. All analyses were performed with SPSS software (IBM). P < 0.05 was considered significant.
RESULTS
Eln+/− mice show differences in large artery morphology in postnatal development.
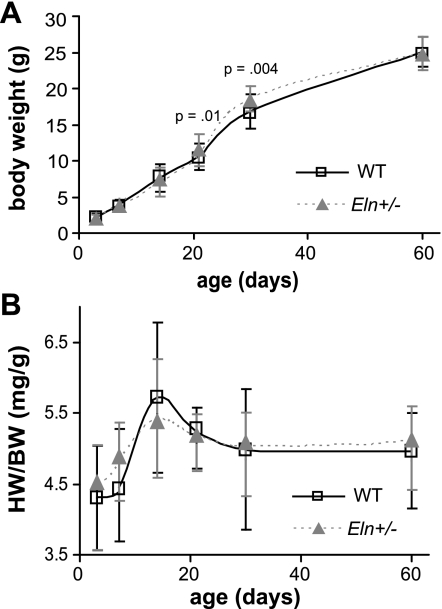
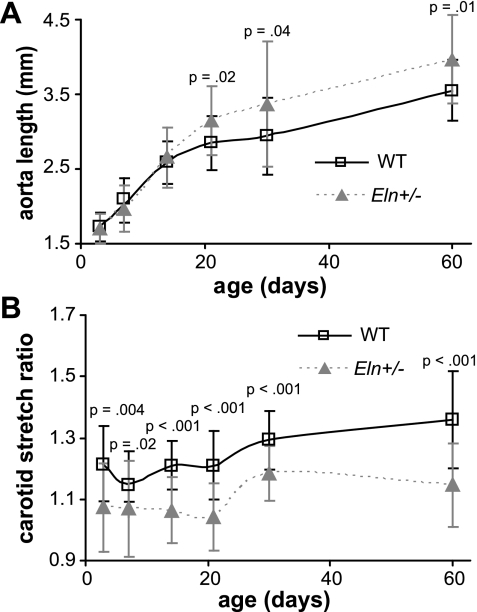
Body weight is significantly affected by age (P < 0.001) and sex (P < 0.001) but not by genotype. The interaction between age and sex is significant (P < 0.001) but not between age and genotype or genotype and sex (R2 = 0.976). At P30 (P < 0.001) and P60 (P < 0.001), males weigh significantly more than females. At P21 and P30, Eln+/− mice weigh more than WT (Fig. 1A), but this is most likely because there were a larger proportion of males (58%) than females (42%) in the Eln+/− groups at these time points. The normalized total heart weight is significantly affected by age (P < 0.001) but not by sex or genotype. There are no significant interactions between factors (R2 = 0.266), and there are no significant differences between genotypes at any age (Fig. 1B). The in vivo length of the ascending aorta is significantly affected by age (P < 0.001) and genotype (P = 0.001) but not by sex. The interaction between age and genotype is significant (P = 0.001), but other interactions are not (R2 = 0.787). By P21, the aortic in vivo length is significantly longer in Eln+/− mice compared with WT (Fig. 2A). The in vivo axial stretch ratio of the left carotid artery is significantly affected by age (P < 0.001) and genotype (P < 0.001) but not by sex, and none of the interactions are significant (R2 = 0.483). At all ages, the carotid in vivo axial stretch ratio is significantly smaller in Eln+/− mice compared with WT (Fig. 2B).
Fig. 1.
Body weight (BW) is significantly different between genotypes at postnatal days (P) P21 and P30 (A). Normalized total heart weight (HW) is not significantly different between genotypes at any age (B). WT, wild-type; n = 14–29/group.
Fig. 2.
In vivo length of the ascending aorta is significantly longer in Eln+/− mice by P21 (A). In vivo carotid stretch ratio is significantly smaller in Eln+/− mice at all ages (B). n = 10–23/group.
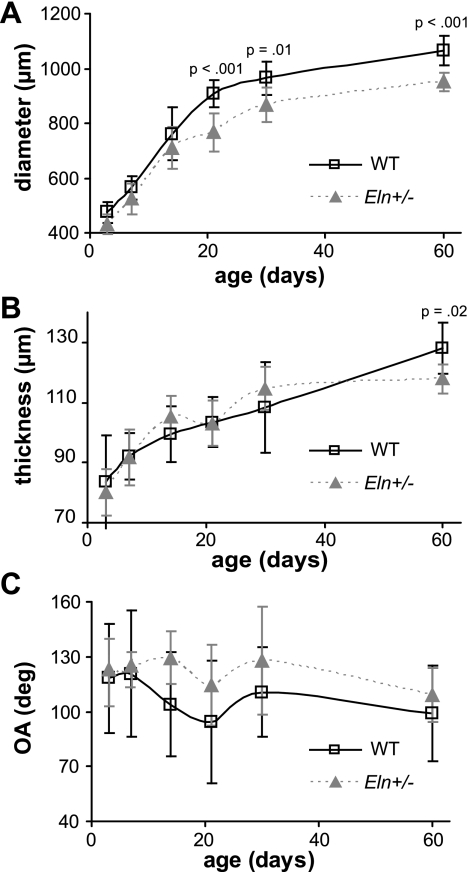
The unloaded outer diameter of the aorta is significantly affected by age (P < 0.001) and genotype (P < 0.001), with no significant interactions between age and genotype (R2 = 0.920). By P21, the unloaded outer diameter is significantly smaller in Eln+/− aorta compared with WT (Fig. 3A). The unloaded thickness of the aorta is significantly affected by age (P < 0.001) but not by genotype, with no significant interactions (R2 = 0.667). However, the unloaded thickness is significantly smaller in Eln+/− aorta compared with WT at P60 (Fig. 3B). The unloaded outer diameter of the left common carotid artery is significantly affected by age (P < 0.001) and genotype (P < 0.001), with significant interactions between age and genotype (P = 0.046; R2 = 0.907). By P21, the unloaded outer diameter is significantly smaller in Eln+/− carotid compared with WT (Supplemental Fig. S1A; Supplemental Material for this article is available online at the Am J Physiol Heart Circ Physiol website). The unloaded thickness of the carotid is significantly affected by age (P < 0.001) but not by genotype, with no significant interactions (R2 = 0.424). The unloaded thickness is not significantly different between Eln+/− carotid and WT at any age (Supplemental Fig. S1B). The residual strain in the aorta, as measured by the opening angle, is not significantly affected by age but is affected by genotype (P = 0.011), with no significant interactions (R2 = 0.161). However, the opening angle is not significantly different between Eln+/− and WT aorta when compared at specific ages (Fig. 3C).
Fig. 3.
Unloaded outer diameter of the ascending aorta is significantly smaller in Eln+/− mice by P21 (A) and the thickness is significantly smaller at P60 (B). There are no significant differences in the opening angle (OA) between genotypes at each age (C). n = 6–11/group.
Blood pressure is significantly higher in Eln+/− mice by P14.
Both SS and FF pressure measurements were performed in P21 mice. The FF system consistently underestimated the systolic blood pressure (FF system = 67 ± 5 mmHg, SS system = 87 ± 9 mmHg for all mice) and was very close to the mean blood pressure measured with the SS catheter (SS means = 65 ± 8 mmHg for all mice). The pressure signal in the FF system is damped as it travels through the fluid in the tubing to the transducer, and this may become even more significant as the magnitude of the LV pressure wave increases with age. We believe that the damping is less significant in younger mice when the pressure magnitudes are smaller, but we cannot compare pressures using the SS system at younger ages. Despite these limitations, the pressure comparisons are valid between genotypes measured with the same methods.
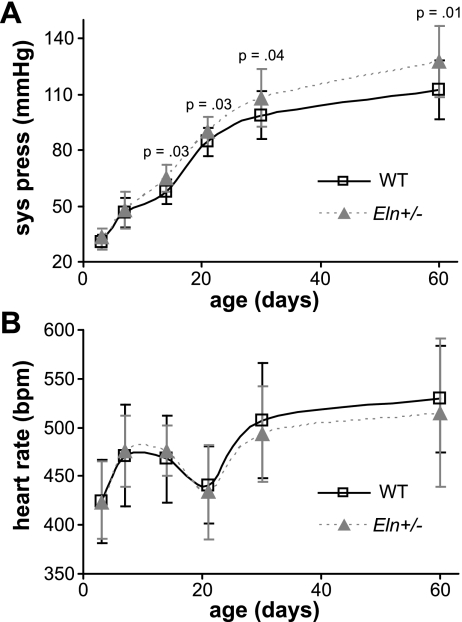
The blood pressure is significantly affected by age (P < 0.001) and by genotype (P < 0.001) but not by sex, with no significant interactions between factors (R2 = 0.899). The systolic blood pressure is significantly higher in Eln+/− mice compared with WT by P14 (Fig. 4A). Heart rate is significantly affected by age (P < 0.001) but not by genotype or sex, with no significant interactions (R2 = 0.379). The heart rate is not significantly different between Eln+/− and WT mice at any age (Fig. 4B). For the older mice (P21–60), the mean pressure is significantly affected by age (P < 0.001) and genotype (P = 0.025) but not by sex, with no significant interactions (R2 = 0.574). The mean pressure is significantly higher in Eln+/− mice at P30 (WT = 79 ± 9 mmHg, Eln+/− = 84 ± 7 mmHg, P = 0.048). For the older mice, the pulse pressure is significantly affected by genotype (P < 0.001) but not by age or sex, with no significant interactions (R2 = 0.237). The pulse pressure is significantly higher in Eln+/− mice compared with WT at P21 (WT = 29 ± 7 mmHg, Eln+/− = 37 ± 15 mmHg, P = 0.030) and P60 (WT = 34 ± 9 mmHg, Eln+/− = 48 ± 14 mmHg, P < 0.001).
Fig. 4.
Systolic pressure (sys press) is significantly higher in Eln+/− mice by P14 (A). There are no significant differences in heart rate between genotypes (B). bpm, Beats/min; n = 12–25/group.
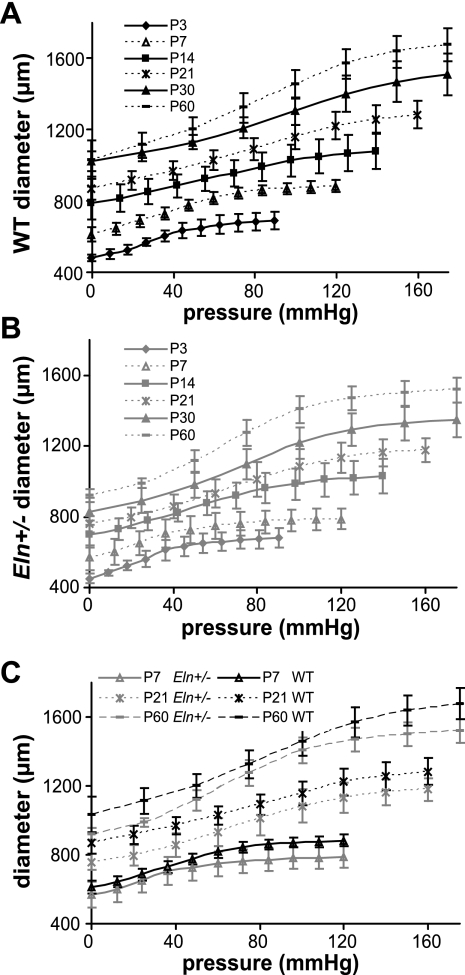
Pressure-diameter and -compliance curves are different in Eln+/− aorta as early as P7.
The pressure-diameter curves for the aorta at all ages are shown in Fig. 5. As expected, the applied pressure has a significant effect on the loaded aortic diameter (P < 0.001 for all ages). After P3, genotype has a significant effect on the diameter (P < 0.001 for P7–60), with no significant interactions between pressure and diameter (P7, R2 = 0.770; P14, R2 = 0.669; P21, R2 = 0.838; P30, R2 = 0.838; P60, R2 = 0.917). The Eln+/− aortic diameter is significantly smaller than WT for at least four pressure steps at all ages above P3 (P values in Supplemental Table S1). The pressure-diameter curves for the carotid at all ages are shown in Supplemental Fig. S2. Pressure and genotype have significant effects on the loaded carotid diameter (P < 0.001, for pressure and genotype for P7–60), with no significant interactions at most ages (P7, R2 = 0.671; P14, R2 = 0.731; P21, R2 = 0.961; P30, R2 = 0.901; P60, R2 = 0.926). At P21, the interaction between pressure and genotype is significant (P < 0.001). The Eln+/− carotid artery is significantly smaller than WT for at least five pressure steps starting at P21 and continuing through P60. At P7, the Eln+/− carotid is significantly smaller at two pressure steps, and there are no significant differences at P14 (P values in Supplemental Table S2).
Fig. 5.
Aortic pressure-outer diameter curves for WT (A), Eln+/− (B), and representative ages for both genotypes (C). Diameter differences between the genotypes are significant for at least 4 pressure steps at P7–60 (Supplemental Table S1); n = 5–10/group.
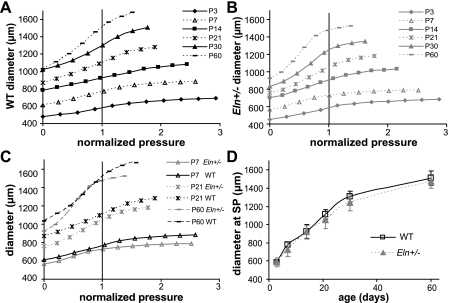
It is difficult to compare the pressure-diameter data between ages because the physiologic pressure increases with age. Hence, the experimental pressures were divided by the systolic pressure measured for each age and genotype and the normalized pressure-diameter curves are shown in Fig. 6 for the aorta and in Supplemental Fig. S3 for the carotid. In the normalized curves, the arteries operate in the linear region and start to increase in stiffness near the systolic pressure for both genotypes at all ages. In the comparison curves for selected ages (Fig. 6C and Supplemental Fig. S3C), the pressure-diameter curves for each genotype meet below the systolic pressure and remain similar for most of the physiologic operating range of the arteries.
Fig. 6.
Aortic normalized pressure-outer diameter curves for WT (A), Eln+/− (B), and representative ages for both genotypes (C). A normalized pressure of 1 indicates the systolic value and the maximum normal physiologic pressure. There are no significant differences between WT and Eln+/− aorta for the calculated outer diameter at the systolic pressure (SP) for each age and genotype (D). Error bars same as Fig. 6 but removed for clarity; n = 5–10/group.
When Eq. 1 is used to calculate the outer diameter at systolic pressure, the aortic outer diameter is significantly affected by age (P < 0.001) and genotype (P = 0.036), with no significant interactions between age and genotype (R2 = 0.950). However, the calculated aortic outer diameter at systolic pressure is not significantly different between genotypes at any age (Fig. 6D). The calculated aortic inner diameter at systolic pressure is significantly affected by age (P < 0.001) but not by genotype, with no significant interactions (R2 = 0.938). The calculated aortic inner diameter is not significantly different between genotypes at any age (not shown). The carotid outer and inner diameters at systolic pressure are significantly affected by age (P < 0.001 and P < 0.001) and by genotype (P = 0.007 and P = 0.033), with no significant interactions (R2 = 0.904 and R2 = 0.894). The calculated carotid outer (Supplemental Fig. S3D) and inner (not shown) diameters at systolic pressure are significantly different between genotypes at P21 only.
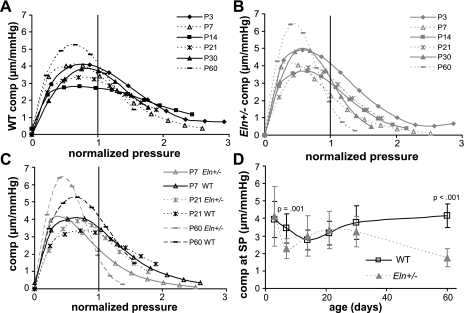
The derivative of Eq. 1 is used to calculate the slope of the pressure-diameter curves, or the compliance of the arteries, which is an inverse measure of the stiffness. Figure 7 and Supplemental Fig. S4 show the diameter compliance vs. the normalized pressure for each age and genotype for the aorta and the carotid, respectively. The compliance vs. pressure curves are obviously nonlinear, so the values were sorted into increasing mean compliance values (instead of increasing applied pressure values) for each age to apply the GLM. As expected, pressure has a significant effect on the compliance (P < 0.001 for all ages). Genotype has a significant effect on the compliance for P7 (P < 0.001) and P60 (P = 0.033) in the aorta and for P21 (P < 0.001) and P30 (P = 0.035) in the carotid. There are significant interactions between pressure and genotype in the aorta for all ages above P3 (P7, P = 0.016, R2 = 0.830; P14, P = 0.004, R2 = 0.650; P21, P = 0.045, R2 = 0.734; P30, P = 0.048, R2 = 0.741; P60, P < 0.005, R2 = 0.830). There are significant interactions between pressure and genotype in the carotid for P21 (P < 0.001, R2 = 0.919) and P30 (P = 0.039, R2 = 0.924). The compliance at nonnormalized pressures and the associated P values are given in Supplemental Tables S3 and S4 for the aorta and the carotid, respectively. The compliance is significantly reduced compared with WT for at least three pressure steps at P7–14 and P30–60 in Eln+/− aorta and at least two pressure steps at P14–30 in Eln+/− carotid arteries.
Fig. 7.
Aortic normalized pressure-compliance (comp) curves for WT (A), Eln+/− (B), and representative ages for both genotypes (C). At the systolic pressure for each age and genotype, the compliance of Eln+/− aorta is significantly lower than WT for P7 and 60 (D). n = 5–10/group.
When the aortic compliance is calculated at systolic pressure, it is significantly affected by age (P = 0.014) and genotype (P = 0.002), with a significant interaction between age and genotype (P < 0.001, R2 = 0.395). The physiologic compliance is significantly lower in Eln+/− aorta compared with WT at P7 and P60 (Fig. 7D). The carotid compliance at systolic pressure is significantly affected by age (P < 0.001) and genotype (P < 0.001), with a significant interaction between factors (P < 0.001, R2 = 0.749). The physiologic compliance is significantly lower in Eln+/− carotid compared with WT at all ages above P7 (Supplemental Fig. 4D).
Stress-stretch behavior is similar between WT and Eln+/− arteries throughout most of postnatal development.
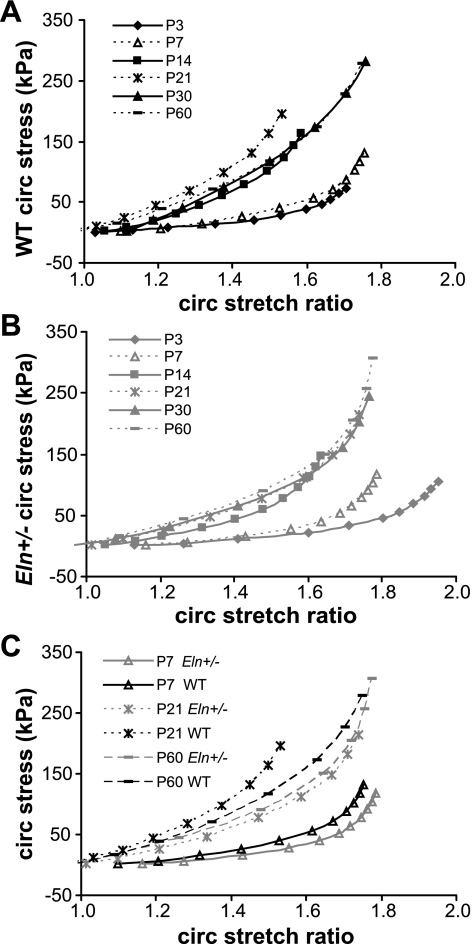
The average stress-stretch ratio curves of the aorta for each age and genotype are shown in Fig. 8. The curves segregate by age for both genotypes; there is one group of similar curves for P3–7 and another for P14–60. The stress-stretch ratio curves for the carotid are shown in Supplemental Fig. S5. For the carotid, the curves group by slightly different ages for both genotypes; there is one group of similar curves for P7–14 and another for P21–60. For the most part, the stress-stretch curves are similar between genotypes at each age for both arteries.
Fig. 8.
Aortic circumferential (circ) stretch ratio-stress curves for WT (A), Eln+/− (B), and representative ages for both genotypes (C). Curves segregate into 2 groups by age but are similar between genotypes for most ages; n = 5–10/group.
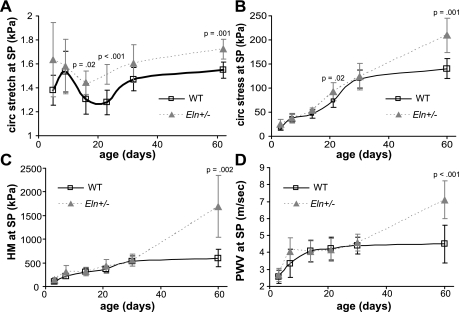
Equations 2–5 are used to calculate the average circumferential stretch ratio, circumferential stress, HM, and PWV for the aorta (Fig. 9) and the carotid (Supplemental Fig. S6) at the systolic pressure for each age and genotype. The physiologic circumferential stretch ratio in both arteries is significantly affected by age (both arteries, P < 0.001) and genotype (aorta, P < 0.001; carotid, P = 0.006), with no significant interactions between age and genotype (aorta, R2 = 0.471; carotid, R2 = 0.532). Eln+/− arteries have significantly higher physiologic circumferential stretch ratios compared with WT at P14, 21, and 60 for the aorta and P60 for the carotid. The physiologic circumferential stress in both arteries is significantly affected by age (both arteries, P < 0.001) and genotype (aorta, P < 0.001; carotid, P = 0.022) in the aorta, with a significant interaction between factors (aorta, P < 0.001; carotid, P = 0.001) (aorta, R2 = 0.915; carotid, R2 = 0.897). The physiologic stress is significantly higher for Eln+/− aorta compared with WT at P21 and P60 and for Eln+/− carotid at P60. The HM in both arteries at the physiologic pressure is significantly affected by age and genotype, with a significant interaction between factors (both arteries, P < 0.001 for all; aorta, R2 = 0.792; carotid, R2 = 0.637). The physiologic HM is significantly larger in Eln+/− aorta at P60 and in Eln+/− carotid at P21–60 compared with WT. The PWV in both arteries at the physiologic pressure is significantly affected by age and genotype (both arteries, P < 0.001 for all), with a significant interaction in the aorta (P < 0.001, R2 = 0.783) but not in the carotid (R2 = 0.485). The physiologic PWV is significantly higher than WT for Eln+/− aorta at P60 and for Eln+/− carotid arteries at P21–60.
Fig. 9.
Aortic circumferential stretch ratio (A), circumferential stress (B), Hudetz elastic modulus (HM; C), and pulse wave velocity (PWV, D) at the systolic pressure for each age and genotype. There are significant differences between genotypes for all parameters by P60; n = 5–10/group.
DISCUSSION
Reduced elastin is associated with increased stiffness and blood pressure in humans (7, 19) and adult mice (8, 11). We investigated how reduced elastin amounts alter the mechanical properties of the arterial wall and the hemodynamic properties of the cardiovascular system during postnatal development in mice. We specifically focused on the temporal relationships between different measures of stiffness and blood pressure to investigate the hypothesis that changes in mechanical properties precede increases in blood pressure in Eln+/− mice.
Elastin amounts and arterial geometry.
Unloaded dimensions are necessary for calculating the stress, stretch ratio, HM, and PWV. They also provide insight into how changes in elastin amounts affect normal arterial growth. The unloaded diameter of Eln+/− aorta is similar to WT in newborn mice (22) and significantly smaller than WT in adult mice (25). In this study, Eln+/− arteries have smaller unloaded diameters than WT by P21. This transition point corresponds with peak gene expression for most ECM proteins (15), indicating that the diameter growth may be linked to the amount of available ECM material. Although Eln+/− arteries are smaller in diameter, the ascending aorta is longer in length by P21. The significant interaction between age and genotype on ascending aortic length indicates that the rate of growth with age is different in WT and Eln+/− mice. The aorta in mice with no elastin (Eln−/−) is significantly longer at birth (22); hence, reduced elastin is associated with lengthening of the aorta that occurs at different rates depending on elastin amounts. Longitudinal growth may be stimulated by increased or decreased axial stretch, increased axial stress caused by increased pressure, or as a secondary response to changes in circumferential mechanical properties (14). The carotid artery has reduced stretch ratios in adult Eln+/− mice (2, 25). We show that decreased stretch ratio is the first measurable change in mechanical behavior of the carotid artery and is significantly different at all ages. This highlights the importance of elastin to the elastic recoil and to arterial remodeling in the longitudinal direction.
Blood pressure and mechanical behavior.
Earlier studies (22) showed Eln+/− mice to have increased blood pressure at P1. Because Eln+/− mice also have reduced compliance in the pulmonary arteries (21), the shifting of blood flow to the pulmonary circulation at birth may enhance pressure differences that are not significant again until 2 wk later. The current study and an aging study in Eln+/− mice (20) suggest that blood pressure begins increasing compared with WT in late postnatal development and continues to increase with aging. The measured blood pressures for WT mice in this study are consistent with previous data (12). Blood pressure is significantly increased in Eln+/− mice at P14, which is later in development than significant reductions in the aortic pressure-diameter and -compliance relationships at P7, supporting our hypothesis that changes in mechanical properties precede changes in blood pressure in these mice. The differences in the mechanical behavior between WT and Eln+/− arteries for P7–60 are similar to those determined in previous studies for adult arteries with reduced elastin levels (8, 11, 25) and with defects in other elastic fiber proteins (2, 6, 26). The combination of changes in mechanical behavior and blood pressure allows WT and Eln+/− aortas to have similar diameters at systolic pressure for all ages, which may be a mechanism to maintain cardiac output and constant shear stress.
As the blood pressure increases during development, the mechanical behavior of the arterial wall is altered to keep the compliance peak in the physiologic pressure range for all ages and genotypes. This provides maximum pulse dampening and suggests that developing smooth muscle cells can rapidly adjust the wall composition and resulting mechanical properties in response to hemodynamic changes. In Eln+/− arteries, the compliance still peaks in the physiologic pressure range at every age, but the curve has a different shape. The significant interaction between pressure and genotype confirms that the pressure-compliance relationship is different in WT and Eln+/− arteries. With a narrower peak, the Eln+/− aorta has significantly reduced compliance at higher pressures, which may have implications for cardiac and cardiovascular function as the mice age and additional pressure increases force the aorta into the less compliant range. The compliance behavior may explain why some humans with elastin haploinsufficiency show progressive worsening of cardiovascular disease with age.
Stress-stretch relationships and elastic modulus.
Like the pressure-compliance behavior, the stress-stretch behavior appears tailored to the physiologic pressure for each age. The curves become nonlinear just beyond the stretch ratio at the systolic pressure for all ages and genotypes, acting to limit distension of the arterial wall under high pressure. The similar stress-stretch curves for WT and Eln+/− arteries are consistent with previous data for adult mice (2, 25) and show the remarkable adaptation of developing arteries. The curves do not depend on the amount of elastin in the wall but may depend on the functionality of the deposited elastin. Electron micrographs of mouse aorta show that most of the elastin layers are complete in the circumferential direction around P7 (4), just as the stress-stretch ratio behavior changes drastically. The largest changes are seen in the low stretch region, which is traditionally attributed to elastin (5).
The physiologic circumferential stretch, circumferential stress, HM, and PWV are similar between WT and Eln+/− arteries at the youngest ages. As has been hypothesized for adult arteries (14, 24), there may be homeostatic or target values for each age that are kept constant, despite reduced elastin amounts. As the mice approach adulthood, differences in these parameters between WT and Eln+/− arteries become significant. The adaptability of Eln+/− arteries to altered hemodynamics and mechanics may depend on SMC plasticity during development that cannot be maintained in adulthood.
At the older ages, the physiologic HM and PWV are significantly higher in Eln+/− arteries compared with WT. This occurs in the carotid artery as early as P21, which is after the time at P14 when blood pressure differences are significant. There is a trend toward higher carotid PWV at even earlier ages, so increased numbers of mice may show that PWV increases occur before or concurrently with increased pressure. An inverse measure of stiffness, the physiologic compliance, is significantly different in Eln+/− carotid as early as P14 and in Eln+/− aorta at P7. Presuming that remodeling to alter the wall stiffness does not occur instantaneously, this suggests that increases in arterial stiffness may occur before increased pressure. Our results show the importance of examining different stiffness measures (i.e., compliance, HM or PWV) and different arteries (i.e., aorta and carotid) in determining the temporal relationships between increased arterial stiffness and blood pressure.
Limitations.
The measured differences in systolic blood pressure for older mice in this study are not as dramatic as previous studies (2, 8, 10, 23, 25). Some discrepancies can be explained by differences in the anesthetic agents and methods, but it is interesting to note that the pressure differences between genotypes have decreased in the last few years in our mouse colony. Studies are ongoing to determine if genetic modifiers are responsible for the phenotype variation over time (B. Kozel, personal communication).
The complex study design necessitates a combination of statistical methods that leave room for interpretation. However, we have been conservative in our conclusions and we feel that multiple comparisons across ages and genotypes provide valuable insight into mechanical remodeling of the developing cardiovascular system. We used a FF system for younger mice that may underestimate blood pressure values and only provides calculated systolic pressure, but the pressure comparisons between genotypes are still valid. We normalized our data by the systolic pressure at all ages because this is related to the work done by the heart to actively eject blood into the arterial circulation. If the calculations are performed using the measured or estimated mean pressure, most of the conclusions remain the same. Our studies show that decreased arterial compliance precedes increased blood pressure but does not confirm a causal relationship. The mechanical tests were performed ex vivo and must be confirmed with in vivo studies. The mechanical results show that the stress-stretch behavior is similar between WT and Eln+/− arteries, but the results cannot be directly linked to individual components without measuring component amounts and developing a microstructurally based mechanical model.
Conclusions.
There are some mechanical properties in developing arteries that are maintained despite reduced elastin amounts. For example, WT and Eln+/− arteries show peak compliance and a transition to nonlinear stress-stretch behavior near the systolic pressure at each age, despite rapidly increasing pressure with postnatal development. Also, the arteries appear to have target physiologic stretch ratios, circumferential stresses, and elastic moduli that are similar in both genotypes at the youngest ages. There are additional mechanical properties that are significantly altered with reduced elastin amounts. Eln+/− mice demonstrate changes in the aortic pressure-diameter and -compliance behavior as early as P7, and these changes precede increases in blood pressure at P14 in these mice. This sequence of events suggests that targeting large arteries to increase diameter and compliance may be a viable treatment option for hypertension in humans.
GRANTS
This work was supported by the National Heart, Lung, and Blood Institute Grants HL-087563 (to J. E. Wagenseil), HL-74138 to (to R. P. Mecham), and HL-105314 (to J. E. Wagenseil and R. P. Mecham).
DISCLOSURES
No conflicts of interest, financial or otherwise, are declared by the author(s).
Supplementary Material
ACKNOWLEDGMENTS
We thank Dean Li at the University of Utah for providing the Eln+/− mice and Hisako Matsuo at Saint Louis University for assistance with the statistics.
REFERENCES
- 1. Bramwell J, Hill A. The velocity of the pulse wave in man. Proc Roy Soc London Ser B 93: 298–306, 1922 [Google Scholar]
- 2. Carta L, Wagenseil JE, Knutsen RH, Mariko B, Faury G, Davis EC, Starcher B, Mecham RP, Ramirez F. Discrete contributions of elastic fiber components to arterial development and mechanical compliance. Arterioscler Thromb Vasc Biol 29: 2083–2089, 2009 [DOI] [PMC free article] [PubMed] [Google Scholar]
- 3. Chuong CJ, Fung YC. On residual stresses in arteries. J Biomech Eng 108: 189–192, 1986 [DOI] [PubMed] [Google Scholar]
- 4. Davis EC. Elastic lamina growth in the developing mouse aorta. J Histochem Cytochem 43: 1115–1123, 1995 [DOI] [PubMed] [Google Scholar]
- 5. Dobrin PB. Physiology and pathophysiology of blood vessels. In: The Basic Science of Vascular Disease, edited by SidawyAN SB, DePalma RG.New York: Futura, 1997, chapt. 3, p. 69–105 [Google Scholar]
- 6. Eberth JF, Taucer AI, Wilson E, Humphrey JD. Mechanics of carotid arteries in a mouse model of Marfan syndrome. Ann Biomed Eng 37: 1093–1104, 2009 [DOI] [PMC free article] [PubMed] [Google Scholar]
- 7. Ewart AK, Morris CA, Ensing GJ, Loker J, Moore C, Leppert M, Keating M. A human vascular disorder, supravalvular aortic stenosis, maps to chromosome 7. Proc Natl Acad Sci USA 90: 3226–3230, 1993 [DOI] [PMC free article] [PubMed] [Google Scholar]
- 8. Faury G, Pezet M, Knutsen RH, Boyle WA, Heximer SP, McLean SE, Minkes RK, Blumer KJ, Kovacs A, Kelly DP, Li DY, Starcher B, Mecham RP. Developmental adaptation of the mouse cardiovascular system to elastin haploinsufficiency. J Clin Invest 112: 1419–1428, 2003 [DOI] [PMC free article] [PubMed] [Google Scholar]
- 9. Fonck E, Prod'hom G, Roy S, Augsburger L, Rufenacht DA, Stergiopulos N. Effect of elastin degradation on carotid wall mechanics as assessed by a constituent-based biomechanical model. Am J Physiol Heart Circ Physiol 292: H2754–H2763, 2007 [DOI] [PubMed] [Google Scholar]
- 10. Goergen CJ, Li HH, Francke U, Taylor CA. Induced chromosome deletion in a Williams-Beuren syndrome mouse model causes cardiovascular abnormalities. J Vasc Res 48: 119–129, 2010 [DOI] [PMC free article] [PubMed] [Google Scholar]
- 11. Hirano E, Knutsen RH, Sugitani H, Ciliberto CH, Mecham RP. Functional rescue of elastin insufficiency in mice by the human elastin gene: implications for mouse models of human disease. Circ Res 101: 523–531, 2007 [DOI] [PubMed] [Google Scholar]
- 12. Huang Y, Guo X, Kassab GS. Axial nonuniformity of geometric and mechanical properties of mouse aorta is increased during postnatal growth. Am J Physiol Heart Circ Physiol 290: H657–H664, 2006 [DOI] [PubMed] [Google Scholar]
- 13. Hudetz AG. Incremental elastic modulus for orthotropic incompressible arteries. J Biomech 12: 651–655, 1979 [DOI] [PubMed] [Google Scholar]
- 14. Humphrey JD, Eberth JF, Dye WW, Gleason RL. Fundamental role of axial stress in compensatory adaptations by arteries. J Biomech 42: 1–8, 2009 [DOI] [PMC free article] [PubMed] [Google Scholar]
- 15. Kelleher CM, McLean SE, Mecham RP. Vascular extracellular matrix and aortic development. Curr Top Dev Biol 62: 153–188, 2004 [DOI] [PubMed] [Google Scholar]
- 16. Li DY, Brooke B, Davis EC, Mecham RP, Sorensen LK, Boak BB, Eichwald E, Keating MT. Elastin is an essential determinant of arterial morphogenesis. Nature 393: 276–280, 1998 [DOI] [PubMed] [Google Scholar]
- 17. Li DY, Faury G, Taylor DG, Davis EC, Boyle WA, Mecham RP, Stenzel P, Boak B, Keating MT. Novel arterial pathology in mice and humans hemizygous for elastin. J Clin Invest 102: 1783–1787, 1998 [DOI] [PMC free article] [PubMed] [Google Scholar]
- 18. Messerli FH, Frohlich ED, Ventura HO. Arterial compliance in essential hypertension. J Cardiovasc Pharmacol 7, Suppl 2: S33–35, 1985 [DOI] [PubMed] [Google Scholar]
- 19. Olson TM, Michels VV, Lindor NM, Pastores GM, Weber JL, Schaid DJ, Driscoll DJ, Feldt RH, Thibodeau SN. Autosomal dominant supravalvular aortic stenosis: localization to chromosome 7. Hum Mol Genet 2: 869–873, 1993 [DOI] [PubMed] [Google Scholar]
- 20. Pezet M, Jacob MP, Escoubet B, Gheduzzi D, Tillet E, Perret P, Huber P, Quaglino D, Vranckx R, Li DY, Starcher B, Boyle WA, Mecham RP, Faury G. Elastin haploinsufficiency induces alternative aging processes in the aorta. Rejuvenation Res 11: 97–112, 2008 [DOI] [PMC free article] [PubMed] [Google Scholar]
- 21. Shifren A, Durmowicz AG, Knutsen RH, Faury G, Mecham RP. Elastin insufficiency predisposes to elevated pulmonary circulatory pressures through changes in elastic artery structure. J Appl Physiol 105: 1610–1619, 2008 [DOI] [PMC free article] [PubMed] [Google Scholar]
- 22. Wagenseil JE, Ciliberto CH, Knutsen RH, Levy MA, Kovacs A, Mecham RP. Reduced vessel elasticity alters cardiovascular structure and function in newborn mice. Circ Res 104: 1217–1224, 2009 [DOI] [PMC free article] [PubMed] [Google Scholar]
- 23. Wagenseil JE, Knutsen RH, Li D, Mecham RP. Elastin insufficient mice show normal cardiovascular remodeling in 2K1C hypertension, despite higher baseline pressure and unique cardiovascular architecture. Am J Physiol Heart Circ Physiol 293: H574–H582, 2007 [DOI] [PubMed] [Google Scholar]
- 24. Wagenseil JE, Mecham RP. Vascular extracellular matrix and arterial mechanics. Physiol Rev 89: 957–989, 2009 [DOI] [PMC free article] [PubMed] [Google Scholar]
- 25. Wagenseil JE, Nerurkar NL, Knutsen RH, Okamoto RJ, Li DY, Mecham RP. Effects of elastin haploinsufficiency on the mechanical behavior of mouse arteries. Am J Physiol Heart Circ Physiol 289: H1209–H1217, 2005 [DOI] [PubMed] [Google Scholar]
- 26. Wan W, Yanagisawa H, Gleason RL., Jr Biomechanical and microstructural properties of common carotid arteries from fibulin-5 null mice. Ann Biomed Eng 38: 3605–3617, 2010 [DOI] [PMC free article] [PubMed] [Google Scholar]
Associated Data
This section collects any data citations, data availability statements, or supplementary materials included in this article.


