Abstract
The heterogeneities of electrophysiological properties of cardiac tissue are the main factors that control both arrhythmia induction and maintenance. Although the local increase of extracellular potassium ([K+]o) due to coronary occlusion is a well-established metabolic response to acute ischemia, the role of local [K+]o heterogeneity in phase 1a arrhythmias has yet to be determined. In this work, we created local [K+]o heterogeneity and investigated its role in fast pacing response and arrhythmia induction. The left marginal vein of a Langendorff-perfused rabbit heart was cannulated and perfused separately with solutions containing 4, 6, 8, 10, and 12 mM of K+. The fluorescence dye was utilized to map the voltage distribution. We tested stimulation rates, starting from 400 ms down to 120 ms, with steps of 5–50 ms. We found that local [K+]o heterogeneity causes action potential (AP) alternans, 2:1 conduction block, and wave breaks. The effect of [K+]o heterogeneity on electrical stability and vulnerability to arrhythmia induction was largest during regional perfusion with 10 mM of K+. We detected three concurrent dynamics: normally propagating activation when excitation waves spread over tissue perfused with normal K+, alternating 2:2 rhythm near the border of [K+]o heterogeneity, and 2:1 aperiodicity when propagation was within the high [K+]o area. [K+]o elevation changed the AP duration (APD) restitution and shifted the restitution curve toward longer diastolic intervals and shorter APD. We conclude that spatial heterogeneity of the APD restitution, created with regional elevation of [K+]o, can lead to AP instability, 2:1 block, and reentry induction.
Keywords: restitution heterogeneity, regional perfusion, optical mapping
the stationary and dynamic heterogeneities of electrophysiological properties of cardiac tissue play a key role in the induction and maintenance of cardiac arrhythmias (1, 10, 16, 59). Cardiac tissue heterogeneities increase drastically when acute regional ischemia occurs. The early stage of acute ischemia is characterized by abrupt metabolic and electrophysiological changes in the affected area (11). Among them, the more prominent are increased extracellular potassium ([K+]o) (25, 26), decreased creatine phosphate (43, 63), elevated intracellular inorganic phosphate (63), acidosis (27, 46), catecholamine release (39), and partial depolarization of transmembrane potential (Vm) (28, 36).
Since an early change in Vm closely relates to [K+]o accumulation (34, 60), the K+ imbalance is considered to be the major factor affecting excitability and is responsible for slow impulse propagation and induction of reentry (51). The elevation of [K+]o displays a triphasic time course and can be affected by an acceleration of pacing rate (35, 58). The first phase starts immediately after occlusion, lasts 5–10 min, and ends when [K+]o rises up to 14 mM (12, 25). The second phase represents a plateau and continues 5–20 min (25, 57). The third phase is characterized by secondary slower increase of [K+]o (57). The regional ischemia causes a very inhomogeneous [K+]o distribution, with the highest level of [K+]o at the center of the ischemic area and a sharply decreased level at the border zone (17, 30). This heterogeneity, developing during the first phase of [K+]o accumulation, can be a source of wave fragmentation and underlie 1a arrhythmias.
Although numerous studies have been devoted to investigation of both metabolic and electrophysiological events accompanying the early stage of ischemia, there is a lack of systematic examination of the particular role of K+ heterogeneity in arrhythmogenesis during suddenly increased heart rate, due to the rapidity of electrophysiological changes after coronary artery occlusion and the complexity of the regional changes in metabolic substrate during ischemia. We address these limitations with a study that has the goals of 1) creating well-defined K+ heterogeneities by means of regional perfusion (RP) with solution containing different concentrations of K+; and 2) investigating the role of K+ heterogeneities in the response of cardiac tissue to rapid pacing and arrhythmia induction.
METHODS
Experimental preparation.
All experiments conformed to the Guide for the Care and Use of Laboratory Animals published by the US National Institutes of Health and were approved in advance by the Vanderbilt Institutional Animal Care and Use Committee.
New Zealand White rabbits (N = 17) of either sex, weighing 2.7–3.1 kg, were used in the experiments. The detailed description of the heart preparation has been published previously (52–54). The animals were preanesthetized with ketamine (50 mg/kg), heparinized (1,000 units), and anesthetized with pentobarbital sodium (60 mg/kg). After a midsternal incision, the heart was quickly removed from the chest and mounted on a Langendorff apparatus for retrograde perfusion with oxygenated Tyrode's solution of the following composition (in mM): 133 NaCl, 4 KCl, 2 CaCl2, 1 MgCl2, 1.5 NaH2PO4, 20 NaHCO3, and 10 d-glucose, buffered with 95% O2 and 5% CO2 (pH = 7.35 at 37°C). The excitation-contraction uncoupler 2,3-butanedione monoxime (BDM) (Fluka, St. Louis, MO) was added to the perfusate (15 mM) to eliminate contractile optical artifacts. The coronary perfusion pressure was adjusted to 50 mmHg, and the flow rate was 44–49 ml/min.
After an equilibration time of 20 min, the heart was stained with 200 μM of di-4-ANEPPS (AnaSpec, San Jose, CA) stock solution (0.5 mg/ml DMSO), gradually administered via an injection port above the aortic cannula. To create a local gradient of [K+]o, the left marginal vein was cannulated with a custom-made polyethylene catheter and perfused separately with Tyrode's solution containing K+ concentrations of 4, 6, 8, 10, and 12 mM. The concentration of Na+ was decreased proportionally to maintain constant osmolarity. The hearts were exposed to air during the experiments. The experimental setup was located in a light-tight Faraday shield, and the temperature inside was kept at 37 ± 0.5°C by a precision heater controller (Air-Therm, World Precision Instruments, Sarasota, FL). At the end of the experiment, an additional amount of di-4-ANEPPS was infused via the polyethylene catheter to visualize the area of RP.
Imaging system and data acquisition.
The fluorescence was excited by a diode-pumped, solid-state laser (Verdi, Coherent, Santa Clara, CA) at a wavelength of 532 nm. The illumination was delivered to the heart with bundles of optical fibers (Schott North America). The emitted light was passed through a cutoff filter (607 nm, Tiffen) and imaged with a DALSA charge-coupled device camera (DS-12–16K5H, 128 × 128 pixels, 490 fps, Dalsa, Waterloo, ON, Canada). The digitized pixel intensity was transferred to a Bitflow R3 frame grabber board (Bitflow, Boston, MA), installed in a Dell 650 Pentium IV/3 GHz Precision Workstation. Custom-developed C-based software controlled data acquisition, camera synchronization, external stimulation, and laser illumination. The magnification was adjusted to focus on a square area of 18–28 mm.
Stimulation protocols.
The stimulation protocols included baseline stimulation at a cycle length of 300 ms, a dynamic pacing protocol when the pacing interval (PI) was gradually reduced to 120 ms with steps of 5–50 ms, and a burst pacing protocol. The stimulating current was delivered via a bipolar glass-coated platinum electrode (0.25-mm wire diameter; 1-mm electrode separation) located on the anterior surface at the right ventricle near the septum. The stimulus was 4 ms in duration, with strength adjusted to between three and four times the diastolic threshold of excitation.
After cannulation of the left marginal vein, the local area of the left ventricle was perfused separately by constant flow at a flow rate of 10–12 ml/min with regular solution for 30 min. During this period, the heart was stimulated at the basic cycle length. Thereafter, if no ischemic changes in the shape of the optical action potential (AP) were detected, the dynamic pacing protocol was implemented. After each increase in stimulation rate, the heart was continuously paced for 2 min before data acquisition. Once the fast pacing protocol was completed, the stimulation was switched back to the basic PI of 300 ms, and the supply system for the RP was exchanged for one with a solution with 6 mM of K+. After 15 min of perfusion at the normal rate, the fast pacing protocol was executed again. This algorithm of stimulation was repeated for each subsequent elevation of [K+]o.
The burst pacing protocol was implemented in RP experiments (N = 6) to assess vulnerability to arrhythmia induction at different concentrations of regional [K+]o. In this protocol, the basic pacing was interrupted with a pulse train consisting of 10 successive stimuli, each of which was 10 times the threshold in amplitude and 10 ms in duration. The PI was progressively shortened in 5- to 20-ms steps, starting from 200 ms down to the effective refractory period.
To estimate the effect of [K+]o on AP duration (APD) and conduction velocity (CV) restitution, [K+]o was increased globally. In those experiments (N = 4), the stimulation current was delivered by means of a 10-mm-long linear wire electrode. The electrode was placed gently against the epicardium on the upper left corner of the image area close to septum and oriented perpendicularly to the fibers to allow steady propagation along the fiber direction. The hearts were paced at a basic cycle length of 400 ms. Similar to the RP experiments, dynamic pacing protocol was applied to test each level of [K+]o.
Data processing and statistical analysis.
The fluorescence data were filtered by an 8 × 8 Gaussian spatial filter and five-point mean temporal filter. To create a phase plot, the filtered data were normalized pixel by pixel, according to fluorescence change during normal pacing rate. To detect the time of activation and repolarization, the data were additionally preprocessed by applying a 5 × 5 Gaussian filter and five-point mean temporal filter. For phase singularity (PS) analysis, data were filtered using the fourth-order low-pass Bessel filter.
The activation time (AT) was computed as the time elapsed between the end of the stimulus and the time at which optical AP reached an activation level equal to 50% of AP amplitude. The repolarization time (RT) was measured at 70% repolarization. The diastolic interval (DI) was computed as the time interval between RTn and ATn+1, and APD was computed as a difference between ATn and RTn.
To assess statistically the alternans of AP amplitude, AT, and APD, the relative standard deviations (RSD = standard/mean × 100) of AP amplitude, AT, and APD were computed for every location and then mapped. To construct the dominant frequency (DF) map, a fast Fourier transform was utilized for trace at each pixel, and the maxima of power spectra were considered as the DF for that pixel.
To create the restitution curve, APD was measured within two different spots (each of 5 × 5 pixels) and then averaged to obtain mean values for odd and even waves. In total, 50 traces were analyzed to attain the APD for each pacing rate. An exponential curve was fit to a restitution relationship by means of the equation (OriginLab):
where units of t, a, and b are in milliseconds. The slopes of the restitution curves were obtained by computing the derivative of these curves. To create the CV restitution curve, the CV was measured along the fiber direction transverse to the propagating planar wave and then averaged to attain mean CV for odd and even waves.
To estimate arrhythmia susceptibility, each pulse train was applied six times, and episodes of arrhythmias and extrasystoles were counted. Then the probability of arrhythmia induction was calculated. We discriminated extrasystolic from arrhythmic activities based on their duration. If extra beats stopped within 1 s after termination of the last pacing pulse, those were considered as extrasystoles. Usually, the number of extrasystoles did not exceed four beats.
Data are presented as means ± SD. Statistical analysis was accomplished using the unpaired t-test. Differences were considered significant if P < 0.05.
PS detection.
To find the PSs, the Vm traces were translated into phase space, where amplitude cycles in the time domain correspond to the loops in phase domain, rotating around a single origin (7, 8). To identify the origin, the median line connecting the middle points of amplitude was determined by data detrending. During this procedure, all local minima and maxima of signal amplitude are detected, and middle points are connected with interpolation using linear piecewise polynomials. After median line subtraction and data normalization, the phase plot was generated for each pixel using time-lag embedding (32). Each period was depicted as a 2π circle, resulting in a series of closed loops. The phase angle, θ(t), was calculated using
where Vm (t + τ) is the Vm shifted with the time-lag τ, is the origin, and arctan is a four-quadrant inverse tangent such that θ(t) is in the range [−π, π]. Given θ(t), the spatial phase maps can be created, and PSs can be identified. The PS is the spatial point at which all phase values converge (62) and may be localized by means of topological charge calculation (9, 24), defined as (23, 44),
where the line integral is taken over a closed curve c surrounding the singularity, and nt is an integer value whose sign depends on the chirality of phase surrounding the singularity. If the line of integration does not enclose the PS, the result is 0; if it does enclose the PS, the result of integration is an integer number, different from zero.
RESULTS
AP amplitude alternans and conduction block at the boundary of [K+]o heterogeneity.
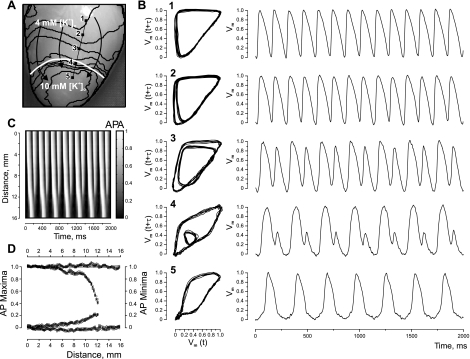
Figure 1 demonstrates the analysis of tissue response to fast pacing (PI = 145 ms) when the heterogeneity was created by means of RP with Tyrode's solution containing 10 mM of K+. The heart image with superimposed isochrones is illustrated in Fig. 1A. Figure 1B presents phase plots and corresponding optical traces extracted from the five pixels marked by black squares in panel A and positioned on the line segment intersecting the boundary of the heterogeneity. The alternans, which occurs as a beat-to-beat change in AP amplitude, starts to develop near the [K+]o heterogeneity. In phase plots, these irregularities appear as smaller inner loops that shrink as the observation point approaches the RP area and finally vanish, indicating transition to a new rhythm. The transition from normal to 2:1 rhythm is also evident in the time-space plot constructed along the line segment linking pixels 1 and 5 (Fig. 1C). Figure 1D includes AP maxima and minima of all pixels of the line segment and illustrates the alternans dynamics as a function of distance.
Fig. 1.
Alternans of action potential (AP) amplitude (APA) and 2:1 conduction block induced by fast pacing at the border of a K+ heterogeneity. The heterogeneity was created by regional perfusion (RP) with 10 mM of K+. A: image of the heart with superimposed isochrones (black lines). The white curve outlines the upper boundary of the RP zone. Black arrows indicate the direction of wave-front propagation. The stimulation electrode is located above the top of the image, at the right ventricle near the septum. The stimulation interval is 145 ms. B: phase-space trajectories and corresponding optical traces for the pixel locations marked with solid squares in A. The phase encoding time lag is 16 ms. C: time-space plot along the straight black line linking pixels 1 and 5 in A, showing clearly the period doubling within the RP zone. Pixel 1 is at 0 mm. D: AP maxima and minima changes as a function of distance between pixels 1 and 5 in A. [K+]o, extracellular K+ concentration; Vm, transmembrane potential; t, time; τ, time lag.
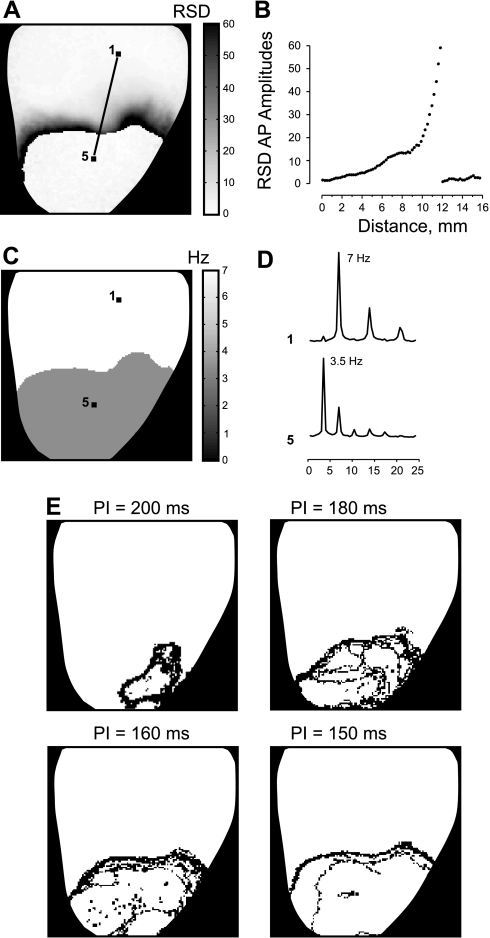
To assess the spatial distribution of the alternans, the RSD of the AP amplitude was calculated for each time trace and presented as a RSD map in Fig. 2A. The darker areas in the RSD map correspond to the larger alternans, which precede the conduction block. Figure 2B shows the profile of the RSD map extracted from the line segment between pixels 1 and 5 in Fig. 2A. The RSD profile slowly rises up, indicating an increase of AP amplitude variability, and then sharply falls down when crossing the line of block. The DF map in Fig. 2, C and D, illustrates two times decrease in frequency within RP area (3.5 Hz) compared with tissue perfused with normal [K+]o (7 Hz).
Fig. 2.
AP dynamics resulting from RP with 10 mM [K+]o and fast pacing. A: the map of the spatial distribution of the relative standard deviations of the APA (RSD). B: the profile of the RSD map along the line linking pixels 1 and 5 in A. C: the spatial distribution of dominant frequency. D: the power spectra of two individual signals at the labeled pixels. E: the phase singularity maps created for pacing intervals (PI) of 200, 180, 160, and 150 ms.
The effect of K+ heterogeneity on the tissue response dynamics is very prominent in the PS maps presented in Fig. 2E. The PSs start to precipitate in the RP area when PI is decreased from 300 to 200 ms. The distribution of PSs signifies the area of unstable electrical activity, which expands with increasing pacing rate. The similar dynamics of AP alternans and PSs were observed in five experiments. In two experiments, we did not observe 2:1 aperiodicity during RP with 10 mM of K+ at as short a PI as 140 ms, although alternans was very prominent, and the unstable area also enlarged with acceleration of pacing rate.
Effect of [K+]o heterogeneity on distribution of ATs.
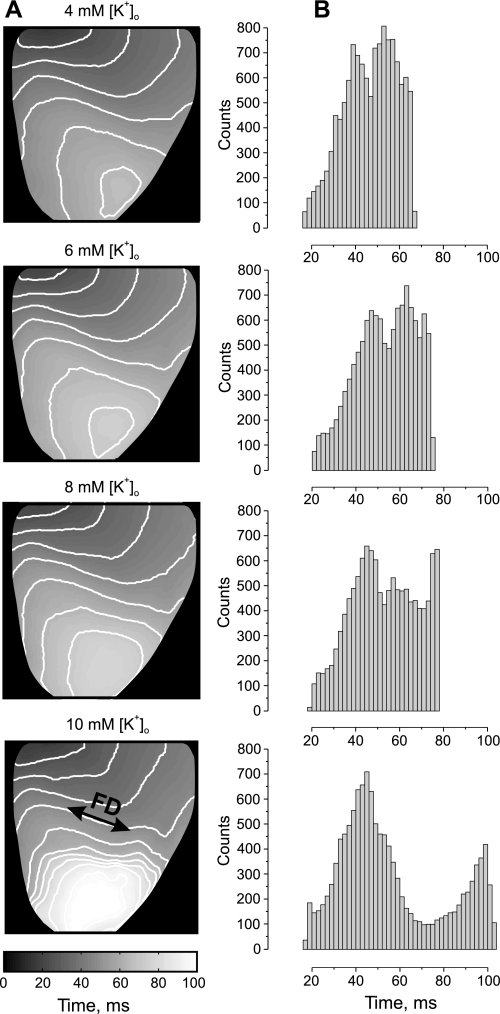
Figure 3 shows mean AT maps in conjunction with histograms created from data obtained during RP with different levels of [K+]o at the basic pacing rate (PI = 300 ms). The activation is most homogeneous when the heart was regionally perfused with a solution containing a normal level of K+ (4 mM). The elevation of the regional [K+]o up to 10 mM progressively slows down conduction and causes ample AT delay in the apical part of the heart. The delay is most prominent transverse to the fiber direction close to the boundary of the RP area. However, no AP alternans was observed at the basic stimulation rate. The related histogram of AT mean values becomes broader and then splits, revealing a bimodal distribution for RP with 10 mM of K+. The two separate peaks with local maxima at 44 and 98 ms correspond to activation of normal tissue and tissue perfused with high K+. Further elevation of K+ in perfusate to 12 mM led to complete depression of excitability of the RP area in five of the seven analyzed experiments. In two experiments, the RP tissue became unexcitable when the local [K+]o was elevated to 14 mM.
Fig. 3.
Effect of [K+]o heterogeneity on the activation time (AT) distribution. A: the spatial distribution of mean AT (MAT) as a function of regional [K+]o elevation. B: the corresponding MAT histograms.
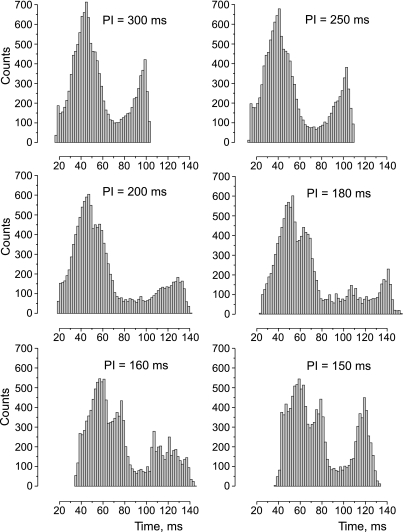
The change in the AT histogram as a result of acceleration of the pacing rate is illustrated in Fig. 4. The shortening PI from 300 to 250 ms increases the delay between two maxima from 54 to 65 ms. When PI is decreased to 200 ms, the first hump starts to divide into two peaks, wherein the second peak reflects increasing delay of activation of the transitional zone between tissue with normal and high elevated [K+]o. At the same pacing rate, the right hump, which signifies the activation of the high [K+]o area, becomes broader and lessens in amplitude, with the maximum shifted to 130 ms from 98 ms at PI of 300 ms. The AT histogram reveals very slow and heterogeneous propagation when PI is 180 ms. The shortening of the PI to 150 ms leads to a different behavior of the AT distribution of normal compared with high [K+]o regions. In particular, compared with PI of 160 ms, the first and second humps at PI of 150 ms move slightly toward a longer time interval, whereas the activation of the RP area (third hump) becomes markedly more homogeneous, with a peak at 120 ms. Such unexpected “improvement” of the activation of the high [K+]o area occurs due to the transition to steady 2:1 rhythm with PI shortening to 150 ms.
Fig. 4.
Effect of [K+]o heterogeneity and stimulation rate on the histogram of MAT. The regional [K+]o is 10 mM.
Effect of elevated [K+]o on restitution properties.
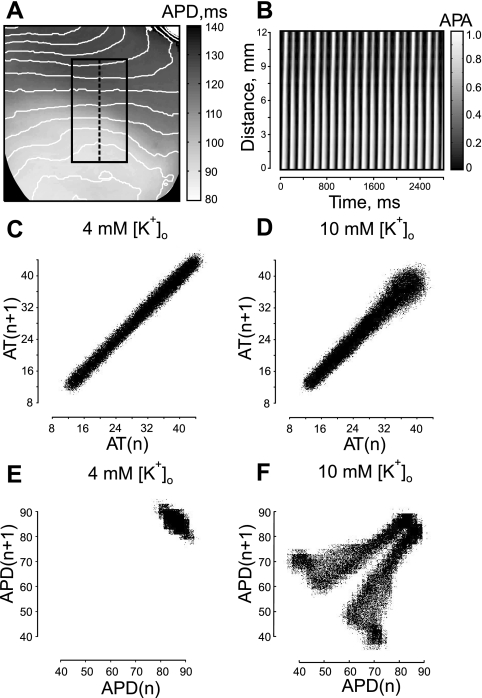
To elucidate the mechanism of induction of AP alternans by high [K+]o, we examined AT along with APD variations at short PI when alternans was most prominent. Figure 5 presents a comparative data analysis of RP experiments when the apical part of the heart was perfused separately with Tyrode's solution containing different levels of K+. The stimulation protocol was the same as described above. In this case, decreasing PI to 140 ms produced substantial AP alternans, but did not exhibit 2:1 conduction block at RP with 10 mM of K+. The high K+ induced considerable shortening of APD, as is evident in the lower part of the preparation at basic pacing rate (Fig. 5A). The vigorous AP alternans develop during fast pacing when excitation propagates from the normal to the high [K+]o area. It is clearly seen in the time-space plot (Fig. 5B) constructed along the dashed line transverse to the wave front in Fig. 5A.
Fig. 5.
Dynamics of AT and AP duration (APD) revealed in Poincaré plots during RP with 4 and 10 mM of [K+]o. A: high local [K+]o induced heterogeneity of APD distribution with superimposed isochrones. PI is 300 ms. The black rectangle outlines the area for Poincaré analysis. B: time space plot along dashed line in A. PI is 140 ms. C: AT Poincaré plot during RP with 4 mM of K+. D: AT Poincaré plot during RP with 10 mM of K+. E: APD Poincaré plot for 4 mM of regional [K+]o. F: APD Poincaré plot for 10 mM of local [K+]o.
To assess the propagation alternans, which could potentially cause the local electrical instability at the high [K+]o region, we examined ATs along with APDs in a Poincaré plot, which is the generally accepted way to investigate the cardiac cycle beat-to-beat variability (31, 42). Figure 5, C and D, illustrates the Poincaré plot generated by plotting AT of wave n (ATn) vs. AT of the wave n+1 (ATn+1) for 4 and 10 mM of regional [K+]o during fast pacing (PI = 140 ms). The time traces for analysis were from the black rectangle in Fig. 5A, which includes both normal and high [K+]o areas. Visual inspection of the shape of the Poincaré plot reveals a very uniform and narrow distribution across the line of identity (y = x) for RP with 4 mM of K+ (Fig. 5C) and for the most part of the distribution for RP with 10 mM of K+ (Fig. 5D). The AT distribution becomes slightly broader at the end for ATs more than 32 ms. Such broadening implies some increase in beat-to-beat variability of conduction when the wave propagates over a high [K+]o region. A Poincaré plot built as APDn vs. APDn+1 demonstrates a drastic disparity in AP dynamics for 10 mM of regional [K+]o (Fig. 5F) compared with 4 mM of local [K+]o (Fig. 5E). When RP is performed with 4 mM of K+, APD distribution is very clustered in the top right corner. The symmetry with respect to the identity line indicates some APD alternans. A Poincaré plot created for 10 mM of regional [K+]o also has a clustered region in the top right corner, which relates to the area with normal [K+]o. However, it splits into two symmetrical branches, implying progressive increase of APD alternans in the high [K+]o zone.
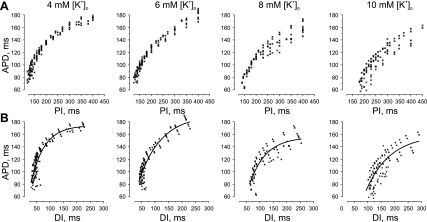
To test the hypothesis that spatial heterogeneity of APD restitution due to high regional [K+]o can result in AP instability and reentry induction, we conducted additional experiments to investigate the effect of elevated [K+]o on APD restitution characteristics. In those experiments (N = 4), [K+]o was increased globally, and a dynamic pacing protocol was applied to reconstruct the restitution relationship for different levels of [K+]o. Figure 6 illustrates the APD restitution relationships resulting from perfusion with Tyrode's solution containing 4, 6, 8, and 10 mM of K+. The elevation of [K+]o up to 10 mM shortened APD at fast pacing rate from 84.3 ± 6.1 ms (PI = 125 ms) to 69.6 ± 8.7 ms (PI = 185 ms) and at slow stimulation from 175.4 ± 2.4 ms (PI = 400 ms) to 141.4 ± 10.8 ms (PI = 400 ms). However, DI increased during fast pacing from 39.9 ± 5.2 ms (PI = 125 ms) to 112.9 ± 7.4 ms (PI = 185). At the same PI of 185 ms, the DI for 10 mM of [K+]o was significantly longer (P < 0.01) than for 4 mM of [K+]o.
Fig. 6.
Effect of whole heart [K+]o elevation on APD restitution. A: relationship between APD and PI. B: relationship between APD and diastolic interval (DI) as a function of different levels of [K+]o.
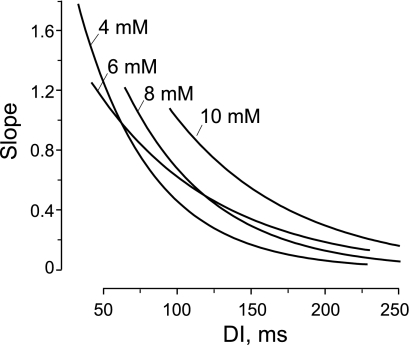
Figure 7 demonstrates the slopes of restitution curve fits shown in Fig. 6B. It is clearly seen that elevation of [K+]o flattens the restitution relationship, but the region of steep slope (>1) persists for all levels of [K+]o at short DI. The slope is >1 for DI <100 ms for 10 mM of K+ and DI <76 ms for 8 mM of K+. The derivative of the restitution curves for 4 and 6 mM of K+ have a point of intersection at slope = 1, such that, for both curves, the slope >1 is for DI <62 ms.
Fig. 7.
Effect of whole heart [K+]o elevation on slope of APD restitution curve. The slopes of the APD restitution curves were computed as derivatives of the restitution relationship fits shown in Fig. 6.
As expected, the increase of [K+]o affected the refractory period. The [K+]o elevation from 4 to 6 mM slightly extended refractoriness from 125 ± 5.8 to 126.3 ± 4.8 ms, respectively. The further increase of [K+]o to 8 mM lengthened the refractory period to 143 ± 7.5 ms. The perfusion with solution containing 10 mM of [K+]o significantly prolonged refractoriness to 185 ± 10 ms compared with 4, 6, and 8 mM of [K+]o (N = 4, P < 0.05).
The effect of [K+]o elevation on the CV restitution is illustrated in Fig. 8. Perfusion with solution containing 10 mM of KCl decreased CV at slow stimulations (PI = 300 ÷ 350 ms) from 57.2 ± 5 cm/s (N = 14) to 19.6 ± 1.7 cm/s (N = 20) and at the fastest pacing rates from 40.8 ± 4.9 cm/s (PI = 120 ÷ 135 ms, N = 8) to 13.7 ± 0.7 cm/s (PI = 190 ÷ 210 ms, N = 8). The maximum slope of the CV restitution curve reduced from 0.354 to 0.086 cm/s2. The increase of [K+]o significantly lessened the maximum CV alternans from 4.6 ± 1.7 cm/s (N = 4) to 0.3 ± 0.3 cm/s (N = 4) (Fig. 8C).
Fig. 8.
Effect of whole-heart [K+]o elevation on conduction velocity (CV) restitution. CV was measured along the fiber direction. A: relationship between CV and PI for 4 and 10 mM [K+]o (N = 4). B: CV restitution exhibits CV alternans (arrow) at 4 mM of [K+]o, but not at 10 mM. C: maximum alternans detected at 4 mM and at 10 mM of [K+]o. Δ, Change.
Effect of [K+]o heterogeneity on arrhythmia induction and susceptibility.
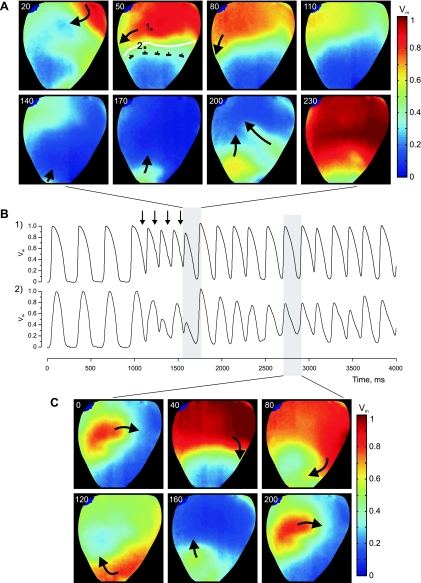
Figure 9 shows the role of K+ heterogeneity in arrhythmia induction by burst pacing (PI = 140 ms). The K+ heterogeneity was created by RP with a solution containing 10 mM of K+. In this case, the reentrant arrhythmia was initiated after application of four S2 pulses. The excitation wave propagates through the upper basal part of the heart, but is blocked in the downward direction at the upper border of the high-K+ region, travels around the RP area along the boundary, and finally reenters the high-K+ region from the apical side (Fig. 9A). The AP alternans during burst pacing can be clearly observed in the optical traces presented in Fig. 9B. The top and bottom traces were extracted from two pixels located at tissue perfused with a normal level of K+ and at sites close to the boundary (white line in Fig. 9A), respectively. The Vm maps in Fig. 9C demonstrate one complete cycle of reentry during the course of the arrhythmia.
Fig. 9.
Example of reentry initiation with burst pacing (PI = 140 ms). The heart was regionally perfused with a solution containing 10 mM of K+. A: Vm maps of the first reentry cycle. The numbers at the top left in each image represent the elapsed time (ms) since the last S2 termination. The white curving line delineates the boundary between normal and high K+ areas. B: Vm traces corresponding to the two pixel locations marked with black squares in A. Black vertical arrows point to times of S2 application. C: Vm maps of one cycle of reentry rotation during sustained arrhythmia.
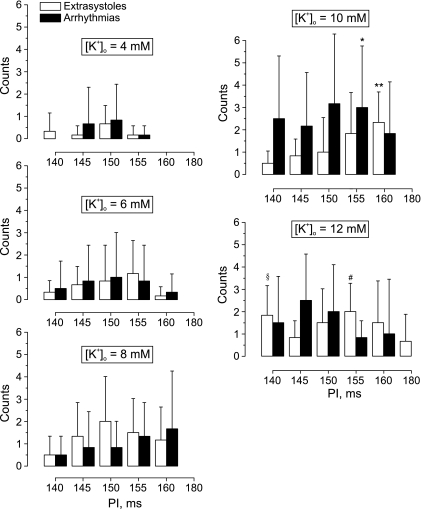
To quantify the relationship between K+ heterogeneity and vulnerability to ventricular arrhythmias, we conducted six separate experiments, wherein a burst of 10 successive stimuli at shorter PIs was tested. Figure 10 demonstrates how the rate of arrhythmia induction depends on local [K+]o and PI during burst pacing. The elevation of the local [K+]o from 4 mM up to 6 mM extends the vulnerable interval from 10 to 20 ms. Subsequent augmentation of the regional [K+]o up to 8 mM substantially increases the probability of extrasystole occurrence in the interval of stimulation periods between 140 and 160 ms and also accelerates the arrhythmia incidence. The RP with 10 mM of K+ is associated with the highest rate of arrhythmia induction with a maximum at PI of 150 ms. The following elevation of the local [K+]o to 12 mM decreases the probability of arrhythmia induction for all except 145-ms stimulation intervals. However, the rate of extrasystole incidence increases for 140-, 150-, and 180-ms stimulation intervals and decreases for PIs of 145, 155, and 160 ms.
Fig. 10.
Effect of [K+]o heterogeneity on arrhythmia susceptibility as measured by the occurrence of either extrasystoles or arrhythmias at different values of the PI. The [K+]o heterogeneities were created by RP with Tyrode's solution containing 4, 6, 8, 10, and 12 mM of K+. The data were acquired in six separate experiments. Values are means ± SD. *P < 0.05 compared with arrhythmias induced at 4 mM of [K+]o, PI = 155 ms. **P < 0.01 compared with extrasystoles induced at 6 mM of [K+]o, PI = 160 ms. §P < 0.05 compared with extrasystoles induced at 6 mM of [K+]o, PI = 140 ms. #P < 0.01 compared with extrasystoles induced at 4 mM of [K+]o, PI = 155 ms.
DISCUSSION
AP alternans in amplitude and duration are frequently observed at the onset of ischemia (21, 45) and during rapid pacing (15, 48). It was demonstrated that elevation of [K+]o can also cause AP alternans (19, 38). In isolated preparations of canine endocardial muscle, the fast pacing, along with a global increase in [K+]o from 8 to 12 mM, enhanced the magnitude of APD alternans (38). The combination of 12 mM [K+]o and 120-ms PI led to 2:1 conduction block (38). In a theoretical study, Arce et al. (2) observed AP alternans in a modified Luo-Rudy ionic model (41) of one-dimensional normal myocardium strand with an embedded area of elevated [K+]o. In their work, alternans was detected in a narrow range of elevated [K+]o around 13.19 mM under a fixed pacing cycle length of 400 ms. As [K+]o was increased, a transition from 1:1 rhythm to 2:2 alternating rhythm and then from 2:2 rhythm to 2:1 block was observed. Despite an evident relationship between increased [K+]o and occurrence of alternans on the one hand and between macroscopic local [K+]o heterogeneity, which takes place during the first minutes after coronary occlusion, and phase 1a arrhythmias on the other hand, studies linking these important issues are lacking.
In this work, we investigated experimentally the effect of an artificially created stable local K+ heterogeneity on the propagation pattern and demonstrated three dynamics: regular 1:1 sequence, alternating 2:2 rhythm, and 2:1 aperiodicity during fast pacing. These dynamics existed concurrently and were associated with tissue, as affected by different levels of [K+]o that ranged between 4 and 10 mM. The size of the area of alternating AP was not stable; it depended on the PI and expanded with acceleration of pacing rate. The local AP alternans appeared when PI decreased to 200–180 ms. When the PI was shortened to 150–140 ms, the area of unstable 2:2 rhythm relocated from the central zone to the border of K+ heterogeneity, whereas the central RP area exhibited 2:1 rhythm. The activation of this locally perfused area became more homogeneous due to the longer DI, resulting from 2:1 rhythm.
Two basic mechanisms of alternans have been considered. The first one is related to the dynamics of Vm and is attributed to the restitution properties of tissue. The second mechanism is linked to Ca2+ cycling instability (20, 49). Because Vm and intracellular Ca2+ ([Ca2+]i) are bidirectionally coupled, usually these two mechanisms coexist. Since the elevation of [K+]o causes APD shortening and depression of excitability, and creates post-repolarization refractoriness, the traditional view is that it changes the character of interaction of the front and tail of subsequent waves during fast pacing and thereby creates CV alternans, which, in turn, lead to APD alternans and conduction block. In our work, we tested the alternative hypothesis that local elevation of [K+]o creates the spatial heterogeneity of the APD restitution and thereby forms a substrate for AP alternans and reentry induction. We found that successive elevation of [K+]o 1) flattens APD restitution; 2) shifts the restitution relationship towards shorter APD and a longer DI; and 3) preserves the steep slope of the restitution curve. The maximum slope of the APD restitution curve decreased from 1.8 for 4 mM to 1.1 for 10 mM of [K+]o, which signifies a shortening of the region of PIs where alternans could appear. The displacement of the restitution relationship to longer DI is evidence of post-repolarization refractoriness. In theory, the sustained APD alternans can occur in tissue if an APD restitution relationship has a maximum slope >1 (18, 47). Due to post-repolarization refractoriness and maintenance of the steep slope of the restitution curve in the high-K+ perfused tissue, this region cannot accommodate the fast pacing. When stimulation rate progressively increases, it starts to generate alternans and then develops 2:1 aperiodicity, whereas most of the tissue is still able to support normal 1:1 rhythm.
The elevation of the [K+]o also affected the CV restitution relationship. It slowed down propagation and flattened the restitution curve and thereby precluded occurrence of CV alternans (Fig. 8). Note that CV alternans at 4 mM of [K+]o started to develop at PI ≤ 140 ms, whereas AP alternans in the high-K+ region appeared when the PI was decreased to 200–180 ms, and 2:1 aperiodicity was detected at PI ≤ 150 ms. This excludes the contribution of alternating conduction originated at tissue perfused with normal K+ in formation of AP alternans observed in the high-K+ area. Does the propagation instability at the high-K+ area cause AP alternans? Based on our analysis of CV restitution relationship and lack of CV alternans at 10 mM of [K+]o, we conclude that the spatial heterogeneity of APD restitution is mainly responsible for the occurrence of AP alternans, conduction block, and reentry.
Our restitution results are consistent with the data of Koller et al. (38), where the authors observed analogous behavior of the APD restitution relationship, although in a preparation of isolated sections of canine myocardium. In particular, the increase in [K+]o from 2.7 to 10 mM decreased the slope of APD restitution ratio at long, but not short, DI and decreased the range of DI where the slope was >1. Our findings are also comparable to results of the theoretical study of Bernus et al. (5), where the authors used the Luo-Rudy model to simulate the three main components of ischemia at cellular level: hyperkalemia, acidosis, and anoxia. When pacing rate was increased, they observed a 2:1 conduction block on the periphery of the border zone and complete conduction block at the edge of the ischemic area. They found that hyperkalemia alone (14.5 mM of K+) is sufficient to induce such complex dynamics, and that voltage-dependent gating of Ca2+ current is an ionic mechanism for alternating conduction block. We observed similar AP dynamics at close [K+]o level. As already mentioned, due to tight Vm-[Ca2+]i bidirectional coupling, [Ca2+]i dynamics can play a substantial role in causing AP alternans and block in conditions of elevated [K+]o. Studies with concurrent Vm and [Ca2+]i registrations would be very valuable in addressing this issue.
Several factors determine the reentry inducibility in the regionally perfused rabbit heart preparation. The most important are the stimulation rate, the dimensions of the RP area, the location of stimulation, and the extent of excitability depression due to different levels of [K+]o. In our data, arrhythmia susceptibility predictably increased with rising [K+]o from 4 to 10 mM. However, further [K+]o elevation to 12 mM decreased arrhythmogenicity at most of the stimulation cycle lengths. During RP with 10 mM of K+, the activation of the RP area occurred with a significant delay (Fig. 4), which increases with PI shortening and thereby promotes occurrence of the wave breaks at the border zone and facilitates reentry induction. Increasing [K+]o to 12 mM elevates the resting membrane potential to about −65 mV (50, 51). At such a level of Vm, the sodium inactivation gates are closing (4), and tissue becomes unexcitable (55). As a result, the contribution of [K+]o heterogeneity to wave fragmentation is reduced, and this region plays a role mainly as an obstacle to anchor the reentry.
It has been postulated that “injury” currents flowing through the ischemic border are related to occurrence of ectopic beats and initiation of reentry (29, 36). In our work, we did not detect any focal ectopic activity at the border zone. One possible reason is that the maximum level of local [K+]o was still too low to create a sufficient gradient in resting Vm and meet sink-source requirements for excitation. The inability to form a sharp transition from high to low [K+]o could also prevent reexcitation. On the other hand, high cell-to-cell coupling also contributes to the preclusion of an abrupt gradient in resting Vm.
In conclusion, the stable K+ concentrations that we used to create a myocardial heterogeneity correspond to the levels of [K+]o detected during the first 10 min after coronary occlusion (58, 61). This early period of acute ischemia is characterized by a maximum rate of incidence of ventricular arrhythmias (13, 33), and the phenomenon described in this work can be one of the scenarios for reentry induction in phase 1a arrhythmias. The power of our preparation and analysis lies with our ability to control the severity of the regional heterogeneity and quantify the resulting changes in AP dynamics, conduction, and increases in arrhythmogenicity, which play important roles in the electrophysiological disturbances associated with acute myocardial ischemia.
Limitations.
To abolish the motion artifact from recorded data, the optical mapping techniques require the use of excitation-contraction uncouplers. In the present study, we utilized BDM, which is known to change several membrane conductances (6, 56) and thereby causes some electrophysiological effects (14, 37, 40), including flattening the APD restitution curve (3). To examine the potential effect of BDM on the dynamics of cardiac response, we conducted two additional experiments using a new excitation-contraction uncoupling agent, blebbistatin, which is considered to have no effects on the AP morphology in rabbit cardiac tissue (22). Similar to our experiments using BDM, we observed three concurrent dynamics, normal, 2:2, and 2:1 rhythm, when [K+]o was regionally elevated and PI was shortened to 140 ms. Hence we concluded that the effects we observed were not dependent on the use of BDM.
GRANTS
This work was supported by the American Heart Association (0635037N), and by the National Institutes of Health (R01 HL58241-11) through the American Recovery and Reinvestment Act of 2009.
DISCLOSURES
No conflicts of interest, financial or otherwise, are declared by the author(s).
ACKNOWLEDGMENTS
The authors thank Bradley J. Roth for comments and suggestions and Allison Price for assistance with the preparation of this manuscript.
REFERENCES
- 1. Antzelevitch C, Shimizu W, Yan GX, Sicouri S, Weissenburger J, Nesterenko VV, Burashnikov A, Di Diego J, Saffitz J, Thomas GP. The M cell: its contribution to the ECG and to normal and abnormal electrical function of the heart. J Cardiovasc Electrophysiol 10: 1124–1152, 1999 [DOI] [PubMed] [Google Scholar]
- 2. Arce H, Lopez A, Guevara MR. Triggered alternans in an ionic model of ischemic cardiac ventricular muscle. Chaos 12: 807–818, 2002 [DOI] [PubMed] [Google Scholar]
- 3. Banville I, Gray RA. Effect of action potential duration and conduction velocity restitution and their spatial dispersion on alternans and the stability of arrhythmias. J Cardiovasc Electrophysiol 13: 1141–1149, 2002 [DOI] [PubMed] [Google Scholar]
- 4. Beeler GW, Reuter H. Reconstruction of the action potential of ventricular myocardial fibres. J Physiol 268: 177–210, 1977 [DOI] [PMC free article] [PubMed] [Google Scholar]
- 5. Bernus O, Zemlin CW, Zaritsky RM, Mironov SF, Pertsov AM. Alternating conduction in the ischaemic border zone as precursor of reentrant arrhythmias: a simulation study. Europace 7, Suppl 2: 93–104, 2005 [DOI] [PubMed] [Google Scholar]
- 6. Biermann M, Rubart M, Moreno A, Wu J, Josiah-Durant A, Zipes DP. Differential effects of cytochalasin D and 2,3 butanedione monoxime on isometric twitch force and transmembrane action potential in isolated ventricular muscle: implications for optical measurements of cardiac repolarization. J Cardiovasc Electrophysiol 9: 1348–1357, 1998 [DOI] [PubMed] [Google Scholar]
- 7. Bray MA, Lin SF, Aliev RR, Roth BJ, Wikswo JP., Jr Experimental and theoretical analysis of phase singularity dynamics in cardiac tissue. J Cardiovasc Electrophysiol 12: 716–722, 2001 [DOI] [PubMed] [Google Scholar]
- 8. Bray MA, Lin SF, Wikswo J. Three-dimensional visualization of phase singularities on the isolated rabbit heart. J Cardiovasc Electrophysiol 13: 1311, 2002 [DOI] [PubMed] [Google Scholar]
- 9. Bray MA, Wikswo JP. Use of topological charge to determine filament location and dynamics in a numerical model of scroll wave activity. IEEE Trans Biomed Eng 49: 1086–1093, 2002 [DOI] [PubMed] [Google Scholar]
- 10. Cao JM, Qu ZL, Kim YH, Wu TJ, Garfinkel A, Weiss JN, Karagueuzian HS, Chen PS. Spatiotemporal heterogeneity in the induction of ventricular fibrillation by rapid pacing importance of cardiac restitution properties. Circ Res 84: 1318–1331, 1999 [DOI] [PubMed] [Google Scholar]
- 11. Carmeliet E. Cardiac ionic currents and acute ischemia: from channels to arrhythmias. Physiol Rev 79: 917–1017, 1999 [DOI] [PubMed] [Google Scholar]
- 12. Cascio WE, Yan GX, Kleber AG. Early changes in extracellular potassium in ischemic rabbit myocardium. The role of extracellular carbon dioxide accumulation and diffusion. Circ Res 70: 409–422, 1992 [DOI] [PubMed] [Google Scholar]
- 13. Cascio WE, Yang H, Muller-Borer BJ, Johnson TA. Ischemia-induced arrhythmia: the role of connexins, gap junctions, and attendant changes in impulse propagation. J Electrocardiol 38: 55–59, 2005 [DOI] [PubMed] [Google Scholar]
- 14. Cheng Y, Li L, Nikolski V, Wallick DW, Efimov IR. Shock-induced arrhythmogenesis is enhanced by 2,3-butanedione monoxime compared with cytochalasin D. Am J Physiol Heart Circ Physiol 286: H310–H318, 2004 [DOI] [PubMed] [Google Scholar]
- 15. Chialvo DR, Gilmour RF, Jr, Jalife J. Low dimensional chaos in cardiac tissue. Nature 343: 653–657, 1990 [DOI] [PubMed] [Google Scholar]
- 16. Choi BR, Liu T, Salama G. The distribution of refractory periods influences the dynamics of ventricular fibrillation. Circ Res 88: e49–e58, 2001 [DOI] [PubMed] [Google Scholar]
- 17. Coronel R, Fiolet JW, Wilms-Schopman FJ, Schaapherder AF, Johnson TA, Gettes LS, Janse MJ. Distribution of extracellular potassium and its relation to electrophysiologic changes during acute myocardial ischemia in the isolated perfused porcine heart. Circulation 77: 1125–1138, 1988 [DOI] [PubMed] [Google Scholar]
- 18. Courtemanche M. Complex spiral wave dynamics in a spatially distributed ionic model of cardiac electrical activity. Chaos 6: 579–600, 1996 [DOI] [PubMed] [Google Scholar]
- 19. Cranefield PF, Klein HO, Hoffman BF. Conduction of the cardiac impulse. 1. Delay, block, and one-way block in depressed Purkinje fibers. Circ Res 28: 199–219, 1971 [DOI] [PubMed] [Google Scholar]
- 20. Diaz ME, O'Neill SC, Eisner DA. Sarcoplasmic reticulum calcium content fluctuation is the key to cardiac alternans. Circ Res 94: 650–656, 2004 [DOI] [PubMed] [Google Scholar]
- 21. Dilly SG, Lab MJ. Electrophysiological alternans and restitution during acute regional ischaemia in myocardium of anaesthetized pig. J Physiol 402: 315–333, 1988 [DOI] [PMC free article] [PubMed] [Google Scholar]
- 22. Fedorov VV, Lozinsky IT, Sosunov EA, Anyukhovsky EP, Rosen MR, Balke CW, Efimov IR. Application of blebbistatin as an excitation-contraction uncoupler for electrophysiologic study of rat and rabbit hearts. Heart Rhythm 4: 619–626, 2007 [DOI] [PubMed] [Google Scholar]
- 23. Goryachev A, Kapral R. Spiral waves in chaotic systems. Phys Rev Lett 76: 1619–1622, 1996 [DOI] [PubMed] [Google Scholar]
- 24. Gray RA, Pertsov AM, Jalife J. Spatial and temporal organization during cardiac fibrillation. Nature 392: 75–78, 1998 [DOI] [PubMed] [Google Scholar]
- 25. Hill JL, Gettes LS. Effect of acute coronary artery occlusion on local myocardial extracellular K+ activity in swine. Circulation 61: 768–778, 1980 [DOI] [PubMed] [Google Scholar]
- 26. Hirche H, Franz C, Bos L, Bissig R, Lang R, Schramm M. Myocardial extracellular K+ and H+ increase and noradrenaline release as possible cause of early arrhythmias following acute coronary artery occlusion in pigs. J Mol Cell Cardiol 12: 579–593, 1980 [DOI] [PubMed] [Google Scholar]
- 27. Jacobus WE, Pores IH, Lucas SK, Weisfeldt ML, Flaherty JT. Intracellular acidosis and contractility in the normal and ischemic heart as examined by 31P NMR. J Mol Cell Cardiol 14, Suppl 3: 13–20, 1982 [DOI] [PubMed] [Google Scholar]
- 28. Janse MJ, Kleber AG. Electrophysiological changes and ventricular arrhythmias in the early phase of regional myocardial ischemia. Circ Res 49: 1069–1081, 1981 [DOI] [PubMed] [Google Scholar]
- 29. Janse MJ, van Capelle FJ, Morsink H, Kleber AG, Wilms-Schopman F, Cardinal R, d'Alnoncourt CN, Durrer D. Flow of “injury” current and patterns of excitation during early ventricular arrhythmias in acute regional myocardial ischemia in isolated porcine and canine hearts. Evidence for two different arrhythmogenic mechanisms. Circ Res 47: 151–165, 1980 [DOI] [PubMed] [Google Scholar]
- 30. Johnson TA, Engle CL, Boyd LM, Koch GG, Gwinn M, Gettes LS. Magnitude and time course of extracellular potassium inhomogeneities during acute ischemia in pigs. Effect of verapamil. Circulation 83: 622–634, 1991 [DOI] [PubMed] [Google Scholar]
- 31. Kamen PW, Krum H, Tonkin AM. Poincare plot of heart rate variability allows quantitative display of parasympathetic nervous activity in humans. Clin Sci (Lond) 91: 201–208, 1996 [DOI] [PubMed] [Google Scholar]
- 32. Kaplan D, Glass L. Time-series analysis. In: Understanding Nonlinear Dynamics. New York: Springer-Verlag, 1995, p. 308–314 [Google Scholar]
- 33. Kaplinsky E, Ogawa S, Balke CW, Dreifus LS. Two periods of early ventricular arrhythmia in the canine acute myocardial infarction model. Circulation 60: 397–403, 1979 [DOI] [PubMed] [Google Scholar]
- 34. Kleber AG. Resting membrane potential, extracellular potassium activity, and intracellular sodium activity during acute global ischemia in isolated perfused guinea pig hearts. Circ Res 52: 442–450, 1983 [DOI] [PubMed] [Google Scholar]
- 35. Kleber AG. Extracellular potassium accumulation in acute myocardial ischemia. J Mol Cell Cardiol 16: 389–394, 1984 [DOI] [PubMed] [Google Scholar]
- 36. Kleber AG, Janse MJ, van Capelle FJ, Durrer D. Mechanism and time course of S-T and T-Q segment changes during acute regional myocardial ischemia in the pig heart determined by extracellular and intracellular recordings. Circ Res 42: 603–613, 1978 [DOI] [PubMed] [Google Scholar]
- 37. Knisley SB, Hill BC. Effects of bipolar point and line stimulation in anisotropic rabbit epicardium: assessment of the critical radius of curvature for longitudinal block. IEEE Trans Biomed Eng 42: 957–966, 1995 [DOI] [PubMed] [Google Scholar]
- 38. Koller ML, Riccio ML, Gilmour RF., Jr Effects of [K+]o on electrical restitution and activation dynamics during ventricular fibrillation. Am J Physiol Heart Circ Physiol 279: H2665–H2672, 2000 [DOI] [PubMed] [Google Scholar]
- 39. Lameris TW, de Zeeuw S, Alberts G, Boomsma F, Duncker DJ, Verdouw PD, in't Veld AJM, van den Meiracker AH. Time course and mechanism of myocardial catecholamine release during transient ischemia in vivo. Circulation 101: 2645–2650, 2000 [DOI] [PubMed] [Google Scholar]
- 40. Liu Y, Cabo C, Salomonsz R, Delmar M, Davidenko J, Jalife J. Effects of diacetyl monoxime on the electrical properties of sheep and guinea pig ventricular muscle. Cardiovasc Res 27: 1991–1997, 1993 [DOI] [PubMed] [Google Scholar]
- 41. Luo CH, Rudy Y. A model of the ventricular cardiac action potential. Depolarization, repolarization, and their interaction. Circ Res 68: 1501–1526, 1991 [DOI] [PubMed] [Google Scholar]
- 42. Makikallio TH, Seppanen T, Airaksinen KE, Koistinen J, Tulppo MP, Peng CK, Goldberger AL, Huikuri HV. Dynamic analysis of heart rate may predict subsequent ventricular tachycardia after myocardial infarction. Am J Cardiol 80: 779–783, 1997 [DOI] [PubMed] [Google Scholar]
- 43. Marban E, Kitakaze M, Koretsune Y, Yue DT, Chacko VP, Pike MM. Quantification of [Ca2+]i in perfused hearts. Critical evaluation of the 5F-BAPTA and nuclear magnetic resonance method as applied to the study of ischemia and reperfusion. Circ Res 66: 1255–1267, 1990 [DOI] [PubMed] [Google Scholar]
- 44. Mermin ND. Topological theory of defects in ordered media. Rev Mod Phys 51: 591–648, 1979 [Google Scholar]
- 45. Mohabir R, Franz MR, Clusin WT. In vivo electrophysiological detection of myocardial ischemia through monophasic action potential recording. Prog Cardiovasc Dis 34: 15–28, 1991 [DOI] [PubMed] [Google Scholar]
- 46. Mohabir R, Lee HC, Kurz RW, Clusin WT. Effects of ischemia and hypercarbic acidosis on myocyte calcium transients, contraction, and pHi in perfused rabbit hearts. Circ Res 69: 1525–1537, 1991 [DOI] [PubMed] [Google Scholar]
- 47. Nolasco JB, Dahlen RW. A graphic method for the study of alternation in cardiac action potentials. J Appl Physiol 25: 191–196, 1968 [DOI] [PubMed] [Google Scholar]
- 48. Pastore JM, Girouard SD, Laurita KR, Akar FG, Rosenbaum DS. Mechanism linking T-wave alternans to the genesis of cardiac fibrillation. Circulation 99: 1385–1394, 1999 [DOI] [PubMed] [Google Scholar]
- 49. Pruvot EJ, Katra RP, Rosenbaum DS, Laurita KR. Role of calcium cycling vs. restitution in the mechanism of repolarization alternans. Circ Res 94: 1083–1090, 2004 [DOI] [PubMed] [Google Scholar]
- 50. Roth BJ, Patel SG. Effects of elevated extracellular potassium ion concentration on anodal excitation of cardiac tissue. J Cardiovasc Electrophysiol 14: 1351–1355, 2003 [DOI] [PubMed] [Google Scholar]
- 51. Shaw RM, Rudy Y. Electrophysiologic effects of acute myocardial ischemia. A mechanistic investigation of action potential conduction and conduction failure. Circ Res 80: 124–138, 1997 [DOI] [PubMed] [Google Scholar]
- 52. Sidorov VY, Holcomb MR, Woods MC, Gray RA, Wikswo JP. Effects of unipolar stimulation on voltage and calcium distributions in the isolated rabbit heart. Basic Res Cardiol 103: 537–551, 2008 [DOI] [PMC free article] [PubMed] [Google Scholar]
- 53. Sidorov VY, Woods MC, Baudenbacher F. Cathodal stimulation in the recovery phase of a propagating planar wave in the rabbit heart reveals four stimulation mechanisms. J Physiol 583: 237–250, 2007 [DOI] [PMC free article] [PubMed] [Google Scholar]
- 54. Sidorov VY, Woods MC, Baudenbacher P, Baudenbacher F. Examination of stimulation mechanism and strength-interval curve in cardiac tissue. Am J Physiol Heart Circ Physiol 289: H2602–H2615, 2005 [DOI] [PubMed] [Google Scholar]
- 55. Sidorov VY, Woods MC, Wikswo JP. Effects of elevated extracellular potassium on the stimulation mechanism of diastolic cardiac tissue. Biophys J 84: 3470–3479, 2003 [DOI] [PMC free article] [PubMed] [Google Scholar]
- 56. Watanabe Y, Iwamoto T, Matsuoka I, Ohkubo S, Ono T, Watano T, Shigekawa M, Kimura J. Inhibitory effect of 2,3-butanedione monoxime (BDM) on Na(+)/Ca(2+) exchange current in guinea-pig cardiac ventricular myocytes. Br J Pharmacol 132: 1317–1325, 2001 [DOI] [PMC free article] [PubMed] [Google Scholar]
- 57. Weiss J, Shine KI. Extracellular K+ accumulation during myocardial ischemia in isolated rabbit heart. Am J Physiol Heart Circ Physiol 242: H619–H628, 1982 [DOI] [PubMed] [Google Scholar]
- 58. Weiss J, Shine KI. [K+]o accumulation and electrophysiological alterations during early myocardial ischemia. Am J Physiol Heart Circ Physiol 243: H318–H327, 1982 [DOI] [PubMed] [Google Scholar]
- 59. Wiegerinck RF, van Veen TAB, Befterman CN, Schumacher CA, Noorman M, de Bakker JMT, Coronel R. Transmural dispersion of refractoriness and conduction velocity is associated with heterogeneously reduced connexin43 in a rabbit model of heart failure. Heart Rhythm 5: 1178–1185, 2008 [DOI] [PubMed] [Google Scholar]
- 60. Wilde AA, Aksnes G. Myocardial potassium loss and cell depolarisation in ischaemia and hypoxia. Cardiovasc Res 29: 1–15, 1995 [PubMed] [Google Scholar]
- 61. Wilde AA, Escande D, Schumacher CA, Thuringer D, Mestre M, Fiolet JW, Janse MJ. Potassium accumulation in the globally ischemic mammalian heart. A role for the ATP-sensitive potassium channel. Circ Res 67: 835–843, 1990 [DOI] [PubMed] [Google Scholar]
- 62. Winfree AT. When Time Breaks Down. Princeton, NJ: Prinston University Press, 1987 [Google Scholar]
- 63. Wu F, Zhang EY, Zhang JY, Bache RJ, Beard DA. Phosphate metabolite concentrations and ATP hydrolysis potential in normal and ischaemic hearts. J Physiol 586: 4193–4208, 2008 [DOI] [PMC free article] [PubMed] [Google Scholar]


