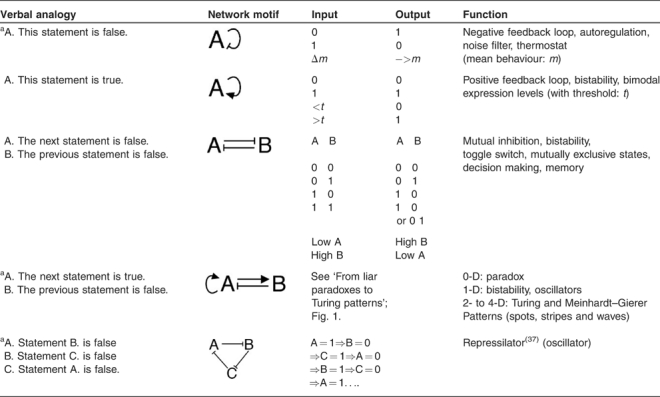
Table 1.
Liar paradoxes and analogous gene network motifs
 |
Only some networks are paradoxes (Marked:a). Others are self consistent if the history of the system is measured. Pointed arrows imply an activation interaction; blocked lines imply repression. For emphasis, networks are shown with all-or-nothing digital forms, with 1 and 0 for active or inactive states. Modelling the same network motif or ‘topology’ in different dimensions can give very different results: the penultimate example can go from paradox (dimensionless: 0-D), to oscillator (1-D), to stripe pattern (up to 4-D).
