Abstract
Amplification by polymerase chain reaction is often used in the preparation of template DNA molecules for next-generation sequencing. Amplification increases the number of available molecules for sequencing but changes the representation of the template molecules in the amplified product and introduces random errors. Such changes in representation hinder applications requiring accurate quantification of template molecules, such as allele calling or estimation of microbial diversity. We present a simple method to count the number of template molecules using degenerate bases and show that it improves genotyping accuracy and removes noise from PCR amplification. This method can be easily added to existing DNA library preparation techniques and can improve the accuracy of variant calling.
INTRODUCTION
Amplification by PCR during library preparation for next-generation sequencing (NGS) complicates genotyping because PCR introduces sequence error and duplicates template molecules (1). These problems are exacerbated when amplifying a small number of template molecules because DNA polymerase errors can generate spurious variant calls if a high proportion of sequence reads derive from a molecule with a mutation that arose in the early cycles of PCR. Alternatively, a heterozygous variant can be missed if a high proportion of sequence reads derive from one allele compared to the alternate allele, due to imbalanced amplification. Despite these concerns, PCR is widely used in NGS library preparation (2,3) in addition to workflows in which the mass of available DNA is limiting, such as hybridization capture (4), ChIP-Seq (5) or samples with a high background of non-specific DNA (6,7). One solution is to remove PCR duplicates based on the read start position and orientation (8) but this approach may discard useful data and is not applicable to amplicon sequencing, where all reads for a given amplicon share the same start position.
Here, we describe an alternative approach to identify PCR duplicates that is applicable to shotgun and amplicon sequencing. We use a molecular counter to estimate the number of template molecules in the PCR associated with each variant. The counter is a degenerate base region (DBR) that is ligated to all fragments during library preparation. After ligation, each fragment in the library incorporates a particular sequence chosen from all the possible DBR sequences. The total number of possible sequences is controlled by the base composition of the counter (9) specified during oligonucleotide synthesis. For example, a single N specified in an oligo would allow for four different possible counters, one for each base. Longer DBR specifications can produce higher numbers of counters.
The counter can be used to determine whether a putative variant is associated with a single template molecule or, alternatively, multiple template molecules and hence the probability that it derives from a polymerase error or true variant. In addition, we show that the number of different DBR sequences associated with one allele, compared to the alternate allele, is a more direct measure of initial template molecules than read numbers. The DBR provides a better estimate of the number of molecules sequenced, increasing our ability to avoid false negative calls.
THEORETICAL ANALYSIS
To estimate the number of molecules that were sequenced, we can use the observed number of reads and counters. Trivially, the lower bound on the number of molecules sequenced is equal to the number of observed counters, since counter sequences are ligated to the template. However, the possibility of ‘collisions’ mean that we cannot use the number of counters alone to give an upper bound on the number of molecules sequenced. Collisions occur where two molecules receive the same counter sequence by chance and are more likely as the number of reads increases. At high read depths, we would expect to observe all possible counter sequences and the counter would be ‘saturated’.
The number of molecules (m) is estimated by Bayes' theorem using the observed number of counters (k) and the (fixed) total number of counter sequences (n) by multiplying the likelihood of k by the prior distribution for m:
| (1) |
To estimate P(m), we first observe the number of reads, r, and note that
| (2) |
Since we have observed the number or reads, P(r) = 1 and we know that, in the absence of any other data, the number of molecules sequenced is between 1 and the total number of reads
| (3) |
To calculate the likelihood of k, we use the ‘occupancy distribution’ (10)
| (4) |
Where  and S(m, k) is the Stirling number of the second kind.
For the simple case where we have only one possible counter sequence, equivalent to not using a counter at all, we can use the identity S(m, 1) = 1 and set n = 1 in (4) and substitute into (1) to show that
| (5) |
that is the prior distribution for m. As expected, with no counter our estimation of the number of molecules sequenced is the same as that using read numbers alone.
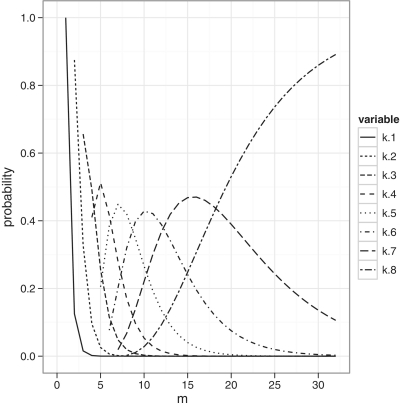
With a degenerate counter (n > 1), the number of template molecules that can be counted is dependent on n. To illustrate how k and n affect our estimate of m, we calculated the occupancy probabilities of a counter with eight available sequences (n = 8). This is shown in Figure 1. With k = 1, 2 observed counters, the likelihood distribution is mostly on m = k, indicating that the number of molecules is equal to the number of counters. However, for higher values of k the likelihoods are spread over a large range of values and not just the maximum likelihood estimate. For k = 8 observed counter sequences, the counter is fully saturated and the likelihood increases with m suggesting r as the best estimate of m. A saturated counter, therefore, suggests the observed number of reads as the most likely estimate of the number of molecules.
Figure 1.
Likelihood of observing k counters from m molecules for a counter with eight possible DBRs. If we know m, we can look at this point on the x-axis to see the probability of observing k counter sequences. Alternatively, if we know k we can follow the individual curve to check which value of m maximizes the likelihood of k, i.e. the MLE of m. The curves for k = 1, 2, 3 all peak at m = k and show that if we observe 1, 2 or 3 counter sequences, we are most likely to have sequenced 1, 2 or 3 molecules, respectively.
The event that no collision occurs is an example of the ‘generalised birthday problem’ (11): how many days in a year would you need to ensure that a room full of people do not share a birthday? The probability that no collision (C′) occurs is approximately
| (6) |
Therefore, when there is a 50% probability of a collision (P(C′) = 0.5)
| (7) |
Since  , it is a reasonable approximation that a counter will behave linearly when the number of molecules is less than or equal to the square root of the number of DBRs. Nevertheless, the quantification of template molecules is more important if few molecules are sequenced. For example, quantifying the difference between 55 and 51 molecules of a novel variant has less practical utility than quantifying the difference between 5 and 1 molecules.
Polymerase error or heterozygote?
The occupancy distribution in Figure 1 shows that, under the uniform prior, observing only one DBR means that the reads are most likely to have come from a single template molecule. If we observe a putative variant associated with one counter sequence, we could therefore infer that it has come from a single molecule, potentially indicating a polymerase error.
However, rather than computing the likelihood under the uniform prior, we might wish to explicitly compare two models M1 that m = 1, a polymerase error arising in molecules amplified from a single template molecule, with M2 that m = B(N, 1/2), a binomial model of a heterozygous site where all the molecules from the novel variant collided. Computing the probability of a single counter under both models,
| (8) |
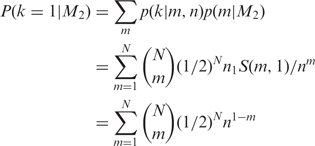 |
(9) |
For large n, higher order terms (m > 1) are negligible and we have
| (10) |
that is M2 is dominated by the term which corresponds to the probability of sequencing a single allele at a heterozygous site—a risk present whether or not a counter is used. Using a Bayes factor for model comparison, a polymerase error is always the favoured model for a variant associated with a single DBR, and this preference becomes highly significant once N > 8. As described in the results below, this approach can be very useful in eliminating errors from PCR amplification.
MATERIALS AND METHODS
DNA preparation and amplification
Adaptors oligonucleotides were 5′ phosphorylated (Phos) and HPLC purified. Adaptors consisted of YSnv 5′-CCTATCCCCTGTGTGCCTTGGCAGTCTCAGTAGAATGTG-3′ and either YSvA 5′-Phos-ATGCACATTCTATGTVBDHVRYCTGAGTCGGAGACACGCAGGGATGAGATGG-3′ or YSvG 5′-Phos-ATGCACATTCTACGTVBDHVRYCTGAGTCGGAGACACGCAGGGATGAGATGG-3′. Oligonucleotides were annealed in 1x NEBuffer 2 (NEB), by heating to 95°C for 5 min and cooling from 95°C to 20°C at a rate of 1°C min. Human genomic DNA (Promega) was digested with FatI (NEB), filled-in with dCTP and ligated to either YSvG-YSnv or YSvA-YSnv adaptors. The two different adaptor libraries were then pooled in equal volumes and concentrated by AMPure XP beads (Agencourt Bioscience, Beverley, MA, USA) before sequencing.
For PCR analyses, we generated libraries by ligating adaptors YSvA2-YSnv and YSvG2-YSnv to FatI digested, dCTP filled-in human genomic DNA. YSvA2 has sequence 5′-Phos-AGTGAGTCGHNNTGTVBDHVRYCTGAGTCGGAGACACGCAGGGATGAGATGGCACATTCTA-3′, YSvG2 5′-Phos-AGTGAGTCGHNNCGTVBDHVRYCTGAGTCGGAGACACGCAGGGATGAGATGGCACATTCTA-3′ and YSnv2 5′-Phos-ATGTAGAATGTGTCTCCCTAT-3′. After adaptor ligation, the libraries were pooled in equal volumes and concentrated using AMPure XP beads. The pooled DNA library was then diluted to 50 ng/μl in 1x Taq DNA ligase buffer (NEB) with 1.5 μM oligonucleotide splint (5′-CGACTCACTATAGGGAGA-3′) and 40 U of Taq DNA ligase (NEB) in a 50 μl reaction. The reaction was heated to 95°C for 5 min before incubation at 45°C for 90 min. After ligation, different volumes of the circularization reaction were added to individual iPCR reactions (corresponding to 50, 100, and 250 ng library). iPCR reactions contained 0.3 μM each forward 5′-CCTATCCCCTGTGTGCCTTGGCA GTCTCAGAAAGGCAGTGCGGTAAATGCA-3′ and reverse 5′-GTGTGTAGTACCAGCAGAGGGGG-3′ primer, 1x Colorless GoTaq Flexi Buffer (Promega), 2.5 mM MgCl2, 0.2 mM each dNTP and 1.25 U of GoTaq Hot Start Polymerase (Promega). Cycling was carried out at 95°C for 2 min followed by 31 cycles at 95°C for 30 s, 62°C for 30 s and 72°C for 2 min 30 s and a final extension at 72°C for 10 min. PCR products were purified by AMPure XP beads before sequencing.
Template for sequencing was quantified by PicoGreen and Bioanalyzer DNA 1000 Lab-Chip (Agilent), and diluted to 1 × 10⁷ molecules/μl. Libraries were emulsion PCR amplified using the GS Titanium emPCR kit (Lib-L) (454, Roche, Basel) using the manufacturer's recommendations, except that the input library consisted of double-stranded DNA. Each sample was sequenced on 1/16th of a single PicoTitrePlate using the GS FLX Titanium Sequencing kit XLR70 (454, Roche, Basel) according to the manufacturer's recommendations. Signal processing was performed using the standard 454 shotgun data analysis pipeline.
Data processing
Reads were processed and mapped using the Roche Newbler mapper. Custom scripts were used to process the data using Python. Plots were produced using ggplot2 in R (12,13).
RESULTS
DBR composition
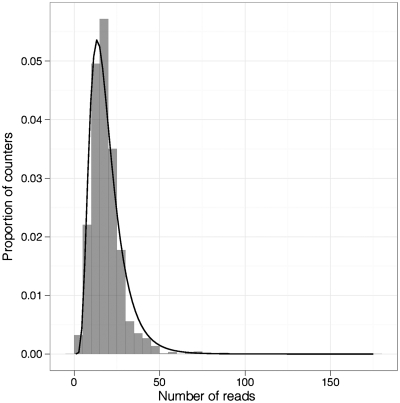
To investigate potential biases during oligonucleotide synthesis of DBRs, we generated libraries by restriction endonuclease digestion of human genomic DNA and ligation of adaptors. Two different partially complementary or Y-stem adaptor sequences were used that both contained a DBR but differed at a single base (5′-RYBDHVBACG-3′ and 5′-RYBDHVBACA-3′; the single base difference is underlined in each sequence). After adaptor ligation, the libraries were equimolar pooled, denatured and rendered double stranded by a single cycle of primer extension. The library was then sequenced on the Roche 454 platform and the distribution of MID sequences analyzed. There were 1944 (972 × 2) possible counters of which 1941 were observed. The reads follow a log normal distribution (mean 2.85, SD 0.49), which would be expected as random variation in base composition at each base, during synthesis, has a multiplicative effect on the number of tagged molecules with a particular DBR (Figure 2). In addition, different log-normalized counter sequences were evenly distributed (P = 1, chi-squared test). These data suggest that large biases between different counters did not exist during oligonucleotide synthesis.
Figure 2.
Histogram of the number of reads of different counters from an unamplified library. Line shows log normal fit.
Identification of PCR duplicates using the DBR
To identify PCR duplicates, we generated libraries using adaptors with DBR sequences that have greater degeneracy (5′-RYBDHVBACGNND-3′ and 5′-RYBDHVBACANND-3′). After adaptor ligation, the libraries were pooled, denatured, circularized on an oligonucleotide splint and a single target was extracted by inverse PCR (iPCR). To investigate the effect of input template mass on PCR sequence error and duplication, different masses of the circularization reaction were added to individual iPCR reactions (50, 100 and 250 ng library). Each iPCR reaction was sequenced on the Roche 454 platform.
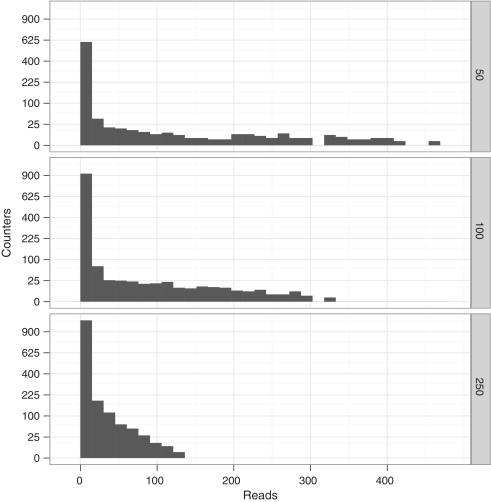
We calculated the percentage of uniquely aligned reads that had a valid DBR and mapped to the expected amplicon sequence. In total, 46 656 sequences are specified by each DBR sequence yielding a total of 93 312 possible DBR sequences across both alleles. Across all three sequencing reactions, 95 741 reads passed 454 quality filters, of which 81 806 (93.1%) had an expected DBR and mapped to the predicted amplicon sequence. We examined the number of reads and DBR sequences associated with each input mass. The input mass was not correlated with the total number of reads (linear fit R2 = −0.20, P = 0.72) but there was a relationship between input mass and the number of observed DBRs (linear fit R2 = 0.78, P = 0.01). These data suggest that the counter was sensitive to the initial iPCR input mass but read numbers were not. For each input mass, most DBRs were associated with one read but a small number was associated with high read numbers. The upper range of read numbers decreased as input mass increased (455 for 50 ng, 323 for 100 ng and 123 for 250 ng). These data indicate that imbalanced amplification is more severe at lower input mass (Figure 3).
Figure 3.
Histogram of reads of counters of amplified libraries with different input masses (top to bottom). Y scale has been scaled with the square root so that low numbers of counters are visible.
Improved genotyping accuracy with a counter
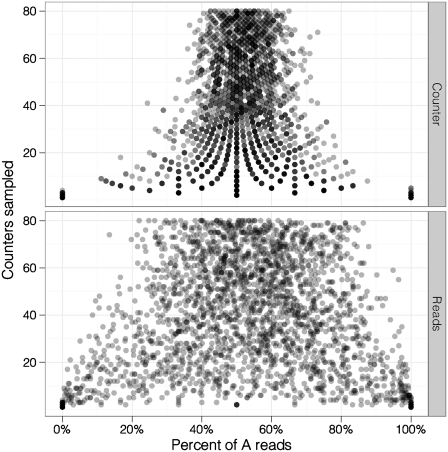
To compare allele calling accuracy using counters to allele calling accuracy using reads, we used the 250 ng data set after first verifying that the two alleles were approximately even in the pooled library (reads A, 13 911; G, 13 968: counters, A, 5816; G, 5693). We then sampled reads associated with a given number of counters from the total population and calculated the proportion of counters and reads associated with each allele. We repeated the test 1000 times for different numbers of counters. Consistent with the binomial distribution, the proportion of counters and reads associated with each allele converged towards 50% as more counters were sampled. Because counters eliminate many PCR duplicates, the convergence is more pronounced for counters than read numbers (Figure 4). These data suggest that counters are able to predict allele frequency more accurately than reads.
Figure 4.
Allelic bias for random samples using counter numbers (top) and read numbers (bottom). Y-axis shows the number of counters sampled. Points are slightly transparent to show overplotting.
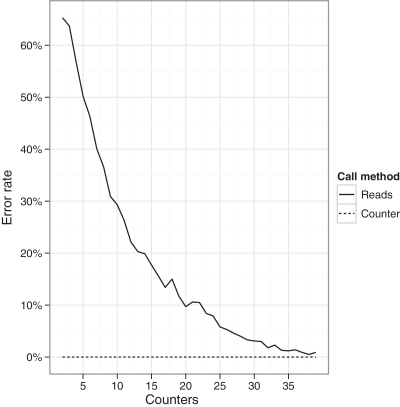
PCR duplicates that contain polymerase errors can give rise to false positive allele calls. We again sampled reads associated with a given numbers of counters from the total population using the 250 ng dataset. To estimate error rates using reads, we aligned sampled reads and called errors as non-reference positions that occurred in at least 10% of reads. To estimate error rates using counters, we derived a consensus sequence for each counter and called errors as non-reference positions that were associated with at least 10% of counters or, if fewer than 10 counters were sampled, positions where more than one counter had the same non-reference sequence. The test was repeated 1000 times for different numbers of counters and the percentage of samplings that had at least one error was calculated (Figure 5). Overall, the error rate using reads was high when a low number of counters were sequenced (for example, if 10 counters were sequenced the error rate was approximately 30%). These data are consistent with the presence of ‘clonal’ polymerase errors derived from single template molecules. In contrast, the counter was highly effective at eliminating errors, suggesting that counters are able to reduce miscalling of polymerase errors.
Figure 5.
Proportion of samples showing errors (error rate) when called using counter consensus sequences or read numbers alone. X-axis shows the number of counters sampled.
DISCUSSION
PCR is used in many NGS workflows but has the potential to increase false positive and false negative allele calls. False positive allele calls result from nucleotide misincorporations that occur during the early cycles of PCR. False negative allele calls result from unequal amplification of two alleles. This situation is exacerbated by low template concentration.
We found that different input masses into an iPCR reaction resulted in similar numbers of reads. This result is an artefact of the Roche 454 library preparation because samples are added to emulsion PCR reactions at different concentrations to maximize the number of reads (GS FLX Titanium emPCR Method Manual). Despite this limitation, counters were sensitive to input copy number and the number of returned counters had a linear relationship with the input mass. Since the generation and ligation of DBRs is random, we had to use probabilistic methods to infer the actual number of molecules sequenced. This analysis shows that the number of observed counters is most likely equal to the number of input molecules when it is lower than the square root of the number of possible counters. At this point, the probability of two molecules being tagged with the same DBR is sufficient to make the relationship non-linear. A maximum likelihood estimate of the number of input molecules can be inferred until the counters are saturated, at which point all counter sequences are observed. To eliminate the effects of saturation, the degeneracy and number of bases included in the DBR can be altered to provide a greater number of potential counter sequences. This approach can, partially at least, overcome the problem of collisions when the number of molecules input into a PCR reaction of the same type is high. However, for many applications it is only necessary to quantify low numbers of template molecules where miscalls can occur, in which case the number of DBRs can be set appropriately.
Given sufficient sequencing depth, there is a good correlation between allele frequency in a sample and its estimated allele frequency [this study and (14)]. However, counters improve the estimates of input molecules into the iPCR particularly at lower sequencing depths. This improves genotyping accuracy, allows us to assign statistical confidence to variant sites and reduces overall sequencing costs. In addition, the counters improve detection of polymerase or sequencing errors and hence reduce false positive variants. For example, simulations based on sequencing sampling 10 counters from the data show an error rate of 30% when SNP calling using read numbers but using counter numbers instead reduces this error rate to 0%. The reduction of false positive calls is important because previous studies have not been able to distinguish particular classes of variation, such as insertion or deletion polymorphisms, from sequencing errors (14).
NGS sample preparation kits from major manufacturers including Illumina, Life Technologies and Roche 454 all require adaptor ligation (2,15,16). Adaptors that include counter sequences can, therefore, be incorporated into existing protocols at no extra cost in time and little extra cost in adaptors. However, counter sequences can potentially increase the cost of sequencing since the counter sequence itself must be read along with the genomic insert. This is an important issue for short read platforms but can be mitigated by additional index, or barcode, sequencing reads (for example, using Illumina's TruSeq DNA Sample Prep Kits or Life Technologies' SOLiD System barcodes).
The counter sequence presented here is incorporated in the adaptor sequence and is therefore present in the template for PCR amplification. In an alternative approach, a counter sequence could be incorporated in the 5′ tail of a PCR primer sequence. However, at each PCR cycle new counters would be randomly associated with each newly synthesized molecule, thus obfuscating the number of template molecules. Instead, a two-step PCR reaction, analogous to multiplex PCR (17,18), that consists of limited cycles of priming with a counter containing primer followed by cycles of universal priming could allow accurate counting during PCR.
Mulitplex identifiers are commonly designed with error-correcting codes (19). For example, a minimum edit distance of two allows detection of MIDs with a single error. However, the counters described here do not have a minimum edit distance because each base is degenerate. This means that a single polymerase or read error within a DBR can associate a single genomic sequence with different counter sequences, and therefore increase the probability of a false positive allele call. However, this effect can be minimized by careful design of the DBR to remove sequences, such as homopolymers, that are prone to sequencing errors and by discarding DBRs with incorrect base positions (for example, an A at a B position).
Because counters are effective at identifying relative biases, such as allelic bias, they may also prove useful in detecting representational bias of different molecules within a sample. For example, counters could help correct biases caused by GC composition in standard library preparations (1) or copy number variation (20). In addition, a counter attached to molecules by RNA ligation, or first- or second-strand cDNA synthesis (21) could be used to quantify the relative levels of different transcripts or transcript isoforms, such as those derived from alternative splicing (22–24). Further applications include sequencing of heterogeneous populations such as, multiplexed samples (manuscript submitted), viral quasispecies (25), pathogen populations (26), environmental samples (27); and tumour samples where rare sequence variants, present in a subpopulation of cells, must be distinguished from true variants (28).
FUNDING
This work was supported by initial funding from The Wellcome Trust and presents independent research commissioned by the National Institute for Health Research (NIHR) under its Invention for Innovation (i4i) Programme (Grant Reference Number II-3A-0809-10009). The views expressed are those of the author(s) and not necessarily those of the NHS, the NIHR or the Department of Health. Funding for open access charge: Population Genetics Technologies Ltd.
Conflict of interest statement. All authors are employed by Population Genetics Technologies Ltd., a privately financed company that develops and markets systems for genetic analysis.
ACKNOWLEDGEMENTS
Thanks to Professor Richard Nichols for checking the theoretical analysis and useful suggestions on clarity.
REFERENCES
- 1.Kozarewa I, Ning Z, Quail MA, Sanders MJ, Berriman M, Turner DJ. Amplification-free Illumina sequencing-library preparation facilitates improved mapping and assembly of (G+C)-biased genomes. Nat. Methods. 2009;6:291–295. doi: 10.1038/nmeth.1311. [DOI] [PMC free article] [PubMed] [Google Scholar]
- 2.Bentley DR, Balasubramanian S, Swerdlow HP, Smith GP, Milton J, Brown CG, Hall KP, Evers DJ, Barnes CL, Bignell HR, et al. Accurate whole human genome sequencing using reversible terminator chemistry. Nature. 2008;456:53–59. doi: 10.1038/nature07517. [DOI] [PMC free article] [PubMed] [Google Scholar]
- 3.Korbel JO, Urban AE, Affourtit JP, Godwin B, Grubert F, Simons JF, Kim PM, Palejev D, Carriero NJ, Du L, et al. Paired-end mapping reveals extensive structural variation in the human genome. Science. 2007;318:420–426. doi: 10.1126/science.1149504. [DOI] [PMC free article] [PubMed] [Google Scholar]
- 4.Gnirke A, Melnikov A, Maguire J, Rogov P, LeProust EM, Brockman W, Fennell T, Giannoukos G, Fisher S, Russ C, et al. Solution hybrid selection with ultra-long oligonucleotides for massively parallel targeted sequencing. Nat. Biotechnol. 2009;27:182–189. doi: 10.1038/nbt.1523. [DOI] [PMC free article] [PubMed] [Google Scholar]
- 5.Johnson DS, Mortazavi A, Myers RM, Wold B. Genome-wide mapping of in vivo protein-DNA interactions. Science. 2007;316:1497–1502. doi: 10.1126/science.1141319. [DOI] [PubMed] [Google Scholar]
- 6.Chiu RW, Chan KC, Gao Y, Lau VY, Zheng W, Leung TY, Foo CH, Xie B, Tsui NB, Lun FM, et al. Noninvasive prenatal diagnosis of fetal chromosomal aneuploidy by massively parallel genomic sequencing of DNA in maternal plasma. Proc. Natl Acad. Sci. USA. 2008;105:20458–20463. doi: 10.1073/pnas.0810641105. [DOI] [PMC free article] [PubMed] [Google Scholar]
- 7.Fan HC, Blumenfeld YJ, Chitkara U, Hudgins L, Quake SR. Noninvasive diagnosis of fetal aneuploidy by shotgun sequencing DNA from maternal blood. Proc. Natl Acad. Sci. USA. 2008;105:16266–16271. doi: 10.1073/pnas.0808319105. [DOI] [PMC free article] [PubMed] [Google Scholar]
- 8.Bainbridge MN, Wang M, Burgess DL, Kovar C, Rodesch MJ, D'Ascenzo M, Kitzman J, Wu YQ, Newsham I, Richmond TA, et al. Whole exome capture in solution with 3 Gbp of data. Genome Biol. 2010;11:R62. doi: 10.1186/gb-2010-11-6-r62. [DOI] [PMC free article] [PubMed] [Google Scholar]
- 9.Cornish-Bowden A. Nomenclature for incompletely specified bases in nucleic acid sequences: recommendations 1984. Nucleic Acids Res. 1985;13:3021–3030. doi: 10.1093/nar/13.9.3021. [DOI] [PMC free article] [PubMed] [Google Scholar]
- 10.Charalambides CA, Charalambides CA. Combinatorial Methods in Discrete Distributions. John Wiley and Sons; 2005. [Google Scholar]
- 11.McKinney EH. Generalized Birthday Problem. Am. Math. Monthly. 1966;73:385–387. [Google Scholar]
- 12.R Development Core Team. R: A Language and Environment for Statistical Computing. Vienna, Austria: R Foundation for Statistical Computing; 2008. [Google Scholar]
- 13.Wickham H. ggplot2: Elegant Graphics for Data Analysis. New York: Springer; 2009. [Google Scholar]
- 14.Nejentsev S, Walker N, Riches D, Egholm M, Todd JA. Rare variants of IFIH1, a gene implicated in antiviral responses, protect against type 1 diabetes. Science. 2009;324:387–389. doi: 10.1126/science.1167728. [DOI] [PMC free article] [PubMed] [Google Scholar]
- 15.Valouev A, Ichikawa J, Tonthat T, Stuart J, Ranade S, Peckham H, Zeng K, Malek JA, Costa G, McKernan K, et al. A high-resolution, nucleosome position map of C. elegans reveals a lack of universal sequence-dictated positioning. Genome Res. 2008;18:1051–1063. doi: 10.1101/gr.076463.108. [DOI] [PMC free article] [PubMed] [Google Scholar]
- 16.Margulies M, Egholm M, Altman WE, Attiya S, Bader JS, Bemben LA, Berka J, Braverman MS, Chen YJ, Chen Z, et al. Genome sequencing in microfabricated high-density picolitre reactors. Nature. 2005;437:376–380. doi: 10.1038/nature03959. [DOI] [PMC free article] [PubMed] [Google Scholar]
- 17.Lin Z, Cui X, Li H. Multiplex genotype determination at a large number of gene loci. Proc. Natl Acad. Sci. USA. 1996;93:2582–2587. doi: 10.1073/pnas.93.6.2582. [DOI] [PMC free article] [PubMed] [Google Scholar]
- 18.Brownie J, Shawcross S, Theaker J, Whitcombe D, Ferrie R, Newton C, Little S. The elimination of primer-dimer accumulation in PCR. Nucleic Acids Res. 1997;25:3235–3241. doi: 10.1093/nar/25.16.3235. [DOI] [PMC free article] [PubMed] [Google Scholar]
- 19.Hamady M, Walker JJ, Harris JK, Gold NJ, Knight R. Error-correcting barcoded primers for pyrosequencing hundreds of samples in multiplex. Nat. Methods. 2008;5:235–237. doi: 10.1038/nmeth.1184. [DOI] [PMC free article] [PubMed] [Google Scholar]
- 20.Chiang DY, Getz G, Jaffe DB, O'Kelly MJ, Zhao X, Carter SL, Russ C, Nusbaum C, Meyerson M, Lander ES. High-resolution mapping of copy-number alterations with massively parallel sequencing. Nat. Methods. 2009;6:99–103. doi: 10.1038/nmeth.1276. [DOI] [PMC free article] [PubMed] [Google Scholar]
- 21.Levin JZ, Yassour M, Adiconis X, Nusbaum C, Thompson DA, Friedman N, Gnirke A, Regev A. Comprehensive comparative analysis of strand-specific RNA sequencing methods. Nat. Methods. 2010;7:709–715. doi: 10.1038/nmeth.1491. [DOI] [PMC free article] [PubMed] [Google Scholar]
- 22.Wilhelm BT, Marguerat S, Watt S, Schubert F, Wood V, Goodhead I, Penkett CJ, Rogers J, Bahler J. Dynamic repertoire of a eukaryotic transcriptome surveyed at single-nucleotide resolution. Nature. 2008;453:1239–1243. doi: 10.1038/nature07002. [DOI] [PubMed] [Google Scholar]
- 23.Mortazavi A, Williams BA, McCue K, Schaeffer L, Wold B. Mapping and quantifying mammalian transcriptomes by RNA-Seq. Nat. Methods. 2008;5:621–628. doi: 10.1038/nmeth.1226. [DOI] [PubMed] [Google Scholar]
- 24.Sultan M, Schulz MH, Richard H, Magen A, Klingenhoff A, Scherf M, Seifert M, Borodina T, Soldatov A, Parkhomchuk D, et al. A global view of gene activity and alternative splicing by deep sequencing of the human transcriptome. Science. 2008;321:956–960. doi: 10.1126/science.1160342. [DOI] [PubMed] [Google Scholar]
- 25.Zagordi O, Klein R, Daumer M, Beerenwinkel N. Error correction of next-generation sequencing data and reliable estimation of HIV quasispecies. Nucleic Acids Res. 2010;38:7400–7409. doi: 10.1093/nar/gkq655. [DOI] [PMC free article] [PubMed] [Google Scholar]
- 26.Hanage WP, Fraser C, Tang J, Connor TR, Corander J. Hyper-recombination, diversity, and antibiotic resistance in pneumococcus. Science. 2009;324:1454–1457. doi: 10.1126/science.1171908. [DOI] [PubMed] [Google Scholar]
- 27.Yooseph S, Sutton G, Rusch DB, Halpern AL, Williamson SJ, Remington K, Eisen JA, Heidelberg KB, Manning G, Li W, et al. The Sorcerer II Global Ocean Sampling expedition: expanding the universe of protein families. PLoS Biol. 2007;5:e16. doi: 10.1371/journal.pbio.0050016. [DOI] [PMC free article] [PubMed] [Google Scholar]
- 28.Ley TJ, Mardis ER, Ding L, Fulton B, McLellan MD, Chen K, Dooling D, Dunford-Shore BH, McGrath S, Hickenbotham M, et al. DNA sequencing of a cytogenetically normal acute myeloid leukaemia genome. Nature. 2008;456:66–72. doi: 10.1038/nature07485. [DOI] [PMC free article] [PubMed] [Google Scholar]


