

Abstract
Control schemes for powered ankle–foot prostheses would benefit greatly from a means to make them inherently adaptive to different walking speeds. Towards this goal, one may attempt to emulate the intact human ankle, as it is capable of seamless adaptation. Human locomotion is governed by the interplay among legged dynamics, morphology and neural control including spinal reflexes. It has been suggested that reflexes contribute to the changes in ankle joint dynamics that correspond to walking at different speeds. Here, we use a data-driven muscle–tendon model that produces estimates of the activation, force, length and velocity of the major muscles spanning the ankle to derive local feedback loops that may be critical in the control of those muscles during walking. This purely reflexive approach ignores sources of non-reflexive neural drive and does not necessarily reflect the biological control scheme, yet can still closely reproduce the muscle dynamics estimated from biological data. The resulting neuromuscular model was applied to control a powered ankle–foot prosthesis and tested by an amputee walking at three speeds. The controller produced speed-adaptive behaviour; net ankle work increased with walking speed, highlighting the benefits of applying neuromuscular principles in the control of adaptive prosthetic limbs.
Keywords: neuromuscular model, powered prosthesis, prosthesis control, speed adaptation
1. Introduction
The human ankle generates net positive mechanical work during gait at moderate to fast walking speeds [1]. During stance phase, commercially available ankle–foot prostheses can only store and release elastic strain energy and thus cannot generate net ankle work. To restore biological ankle function, self-contained powered prostheses have recently been developed with the capability to reproduce physiological levels of net mechanical work [2–4]. While these prostheses can reduce the metabolic cost of the wearer [5], many control challenges remain in realizing the potential of these devices for walking under diverse conditions, such as varying terrains and speeds. Toward this end, here we focus on the advancement of a speed-adaptive control strategy for a powered ankle–foot prosthesis.
To develop a speed-adaptive controller, we consider the biomechanical changes in human ankle behaviour across speed. A change in walking speed corresponds to a change in the relationship between ankle joint state (angle and derivatives) and joint torque. One way to encode these speed-adaptive variations in a prosthetic control scheme is to programme the prosthesis with fixed mathematical functions defined by parameters that vary across speed [4]. However, this strategy requires supervisory controllers to explicitly vary function parameters as walking speed changes [4]. An alternative is a method described in Holgate et al. [6], which uses tibia global angular position and angular velocity to measure gait cycle location regardless of stride length, thus enabling speed adaptation. This has the advantage of not requiring walking speed measurements from the device, preventing measurement errors and latency in parameter changes from affecting performance. We propose another method to achieve inherent speed adaptability by implicitly encoding speed-correlated torque-state variations in a biophysically inspired function. This method also does not require an explicit measurement of walking speed and may provide more potential for adaptability over a broader range of conditions.
Such a function can be developed by emulating muscle reflexes, i.e. muscle behaviours that are mediated by neural circuits that are confined to the spinal cord [7]. It has been suggested [8] that afferent feedback is important in enabling walking speed-dependent biomechanical changes. Reflexes offer a dynamic means to rapidly communicate mechanical changes to the neuromuscular system, and so may enable joint power generation to be appropriately timed across speed [8]. Thus, reflexes may provide a biophysical basis for closed-loop feedback control of ankle dynamics across speed.
Human motor control is believed to be composed of both a feed-forward neural drive and a reflexive feedback component [7,8]. Nonetheless, models controlled with only local reflexive feedback loops are able to produce walking simulations that qualitatively agree with human gait dynamics and muscle activations [9]. This purely feedback-based approach has been applied to a powered ankle–foot prosthesis to control it as if it were driven by a human muscle with a local force feedback reflex [10]. This system exhibited slope-adaptive behaviour but the use of a force-feedback reflex alone, without parameter interventions, did not result in the biological trend of increasing net ankle work across speed [11]. Empirical studies such as Klint et al. [12] have established the existence of length-based as well as force-based afferent feedback to the plantar flexors during stance in walking. Hence, other reflexes may be required in tandem with force feedback to produce speed-adaptive functionality, although the specific reflex pathways required and the quantitative details of their contributions are not yet known.
Here we propose that a neuromuscular modelling framework, when duly considering the interplay between musculoskeletal dynamics and neural control, can provide insight into reflex pathways contributing to ankle function in walking gait. Specifically, we hypothesize that a neuromuscular model composed of length, velocity and force feedback in the posterior leg muscles, when used to control a powered ankle–foot prosthesis, can exhibit speed-adaptive behaviour by producing a trend of increasing ankle joint net work with increasing walking speed. To evaluate this hypothesis, we first developed the proposed modelling framework based on kinematic, kinetic and electromyographic (EMG) gait data from an intact-limbed subject. We then used the resulting neuromuscular model to control a powered ankle–foot prosthesis worn by a transtibial amputee walking at three distinct speeds.
2. Methods
(a). Modelling
Reflexes, among other neural pathways, dynamically link muscle force and state to muscle activation [7]. To specify a reflex-based controller, one would require profiles of muscle force, state and activation, all of which are difficult to access. Muscle state has a nonlinear dependence on tendon action and joint mechanics. Activation cannot be known in silico without quantifying the neural control pathways involved, which are unknown a priori and are what we set out to find in the first place. As a resolution to this difficulty, we chose to estimate activations from EMG data of healthy walking subjects, as the data already incorporate the dynamic effects of neural control within the subject. With the activations (effective control commands) and ankle angles from gait data, we actuated a dynamical model of the plant (consisting of ankle muscle–tendon units) and estimated muscle state profiles. The estimates of muscle state and activations were used to derive a reflex architecture which may contribute significantly to walking, as well as to quantify reflex parameters that are consistent with the muscle–tendon dynamics. This overall framework, shown in figure 1, emphasizes the interplay of legged dynamics with neural control.
Figure 1.

(a) Musculoskeletal model applied in prosthesis controller. The two plantar flexors are modelled as muscle–tendon complexes while the dorsiflexor is modelled as a unidirectional rotary spring-damper. (b) Block diagram describing an individual reflex-based controller. The input is composed of joint angles θ (ankle and knee for gastrocnemius (GAS); just ankle for soleus (SOL)) and the output is the muscle contribution T to ankle torque. The four blocks represent the geometrical mapping from angle to lmtc and ankle moment arm (geom), the reflex structure (reflex), the stimulation-to-activation dynamics (equation (2.3), block stim-act) and the Hill-type muscle model (Hill) [9,10].
The biological data forming the basis of the above modelling scheme were composed of kinematic, kinetic and EMG measurements. Data were collected with approval from the MIT Committee on the Use of Humans as Experimental Subjects at an instrumented motion analysis facility in the MIT Computer Science and Artificial Intelligence Laboratory. After obtaining informed consent, a healthy male participant was asked to walk barefoot at self-selected speed (1.25 m s−1). Standard motion capture techniques (described in [13]) were employed to collect the kinematic and kinetic data. Surface EMG recordings were obtained from the soleus, medial gastrocnemius, lateral gastrocnemius and tibialis anterior (TA) muscles of one randomly chosen leg in the presence of a physician. A total of 25 walking trials within 5 per cent of self-selected speed were collected. The walking trials were repeated on multiple days (with consistent calibrations) to test the robustness of modelling and estimation techniques to day-to-day differences.
Muscle activations were estimated from EMG data using a technique reported in Krishnaswamy et al. [13]. Standard preprocessing techniques [14] were applied to the signal before applying a causal, recursive and vectorized implementation of the Bayesian algorithm described in Sanger [15]. This algorithm models muscle activation as a slow diffusion process driven by calcium sourcing and sinking jump processes and produces an output, x(t). This output does not take into account the difference in activation and deactivation rates, which is critical to the timing of activation build-up. Consequently, x(t) was passed through the calcium-activation dynamics described by Zajac [16]:
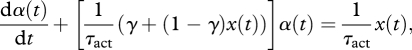 |
2.1 |
where 0 < γ = (τact/τdeact) < 1. The activation time constant τact was set to be 9–10 ms with the deactivation time constant set to 45–50 ms [17].
All steady-state walking data and resulting estimates therefrom were split into gait cycles, time-normalized to per cent gait cycle (%GC) coordinates and ensemble averaged for modelling and analysis. Ankle joint angles and muscle contributions to ankle torques were obtained by processing the motion capture data in SIMM (Software for Interactive Musculoskeletal Modeling, MusculoGraphics Inc., Evanston, IL, USA) [18].
The muscle activations, joint angles and joint torques were used to estimate individual muscle force and state profiles in walking, using a muscle–tendon model and a method from Krishnaswamy et al. [13] as described below.
The dynamics of the primary leg muscle–tendon units contributing to ankle function in normal walking were modelled. The anatomical correlates of the model (shown in figure 1) include the large muscle–tendon units actuating ankle rotation in the sagittal plane—namely the soleus and gastrocnemius (with medial and lateral heads represented as one effective muscle) plantar flexors with the Achilles tendon split among them—and the TA dorsiflexor. All three muscle–tendon units1 were modelled using (i) Hill-type muscle dynamics [9,10] and (ii) a common nonlinear tendon model [19]. Each muscle and tendon were dynamically connected in series at a fixed pennation angle with each other.
The morphological parameters (muscle maximum isometric force, tendon shape factor, reference strain and slack length) defining the model were chosen as those that most efficiently relate the muscle activations and biological joint angles with the biological joint torques [13]:
| 2.2 |
where the model M is actuated with muscle activations α(t) and joint angles θ(t) from the biological gait data, and muscle–tendon parameters m are obtained as those that minimize metabolic consumption C, subject to the constraint of matching the output torque τ(t) to the biological ankle torque. C was computed using empirical measures of muscle metabolic power as a function of contractile element velocity [20,21]. Bounds on the morphological parameters were chosen to ensure consistency with values reported in the literature [16,17]. Because of errors starting up the model, the cost C was counted starting at 4 per cent of the gait cycle and ran until the end of stance (as the swing cost was small and relatively flat in the parameter space). The errors starting up the model came from two sources. First, as impact dynamics are highly variable and thus the input data show increased variability immediately following heel strike, it is difficult to fit the model torque to the experimental average during this phase of gait. Secondly, the model has state (muscle fascicle length and velocity) and as there is no input data before heel strike (the model is only trained on stance) there is a brief interval required for the model to converge to the correct fascicle state. Note that the plantar flexors that are the dominant torque sources in the ankle [22] are inactive during the omitted period. Using the values of m thus obtained and the inputs α(t) and θ(t), estimates of muscle force and state profiles were calculated by numerically solving the muscle–tendon model in Matlab Simulink [13].
As noted in the study of Krishnaswamy et al. [13], the resulting model provides empirically inaccessible estimates of individual muscle force. It also results in muscle–tendon morphologies that can be used to predict empirically realistic individual muscle states [13]. As the morphological features link joint level leg dynamics with neural activations, it is a scheme well-suited towards identifying the reflexes that facilitate the interplay of legged dynamics with neural control [13].
Reflexes respond to changes in muscle force and state (relayed by the spindle and golgi tendon sensors in muscles) to contribute to neural stimulation of the muscle and in turn muscle activation [7]. Therefore, trends in the muscle force, state and activation profiles may be used to identify feedback control pathways that contribute to the observed state changes. If one ignores the effects of non-reflexive neural drive, a purely feedback-based control structure may be derived. In reality, feedback does not fully characterize the neural contributions to muscle activation in human gait; for instance, central pattern generators (CPG) may also play a role [23,24]. Nonetheless, researchers have suggested that distal muscle–tendon units (such as those spanning the ankle) are likely to be primarily influenced by feedback pathways as they have greater proprioceptive feedback and are more influenced by contact forces [9,25]. With this in mind, we use the observed trends in the estimated muscle variables to motivate a feedback-based control model and evaluate its performance.
Figure 2 shows vertically aligned plots of the estimated gastrocnemius muscle activation, force, length and velocity. It is apparent that there is an early stance period of muscle stretch and low activation, followed by a coincident rise in activation and near-isometric operation in mid-stance. This sequence of events points to a possible contribution from the stretch reflex among contributions from other reflex pathways. A notable feature in the mid-stance profiles is the similarity in shapes of force and activation profiles. This positive correlation between force and activation could be facilitated by positive force feedback. The primary characteristic seen in late stance is that of muscle shortening and a coincident fall in activation. It is possible that the change from isometric operation to concentric operation (shortening) drives the fall in activation via length and velocity feedback pathways. Similar trends were observed in the soleus muscle. From here on, we focus only on the soleus and gastrocnemius muscles as these provide the dominant contribution to ankle torque during stance phase in walking [22].
Figure 2.
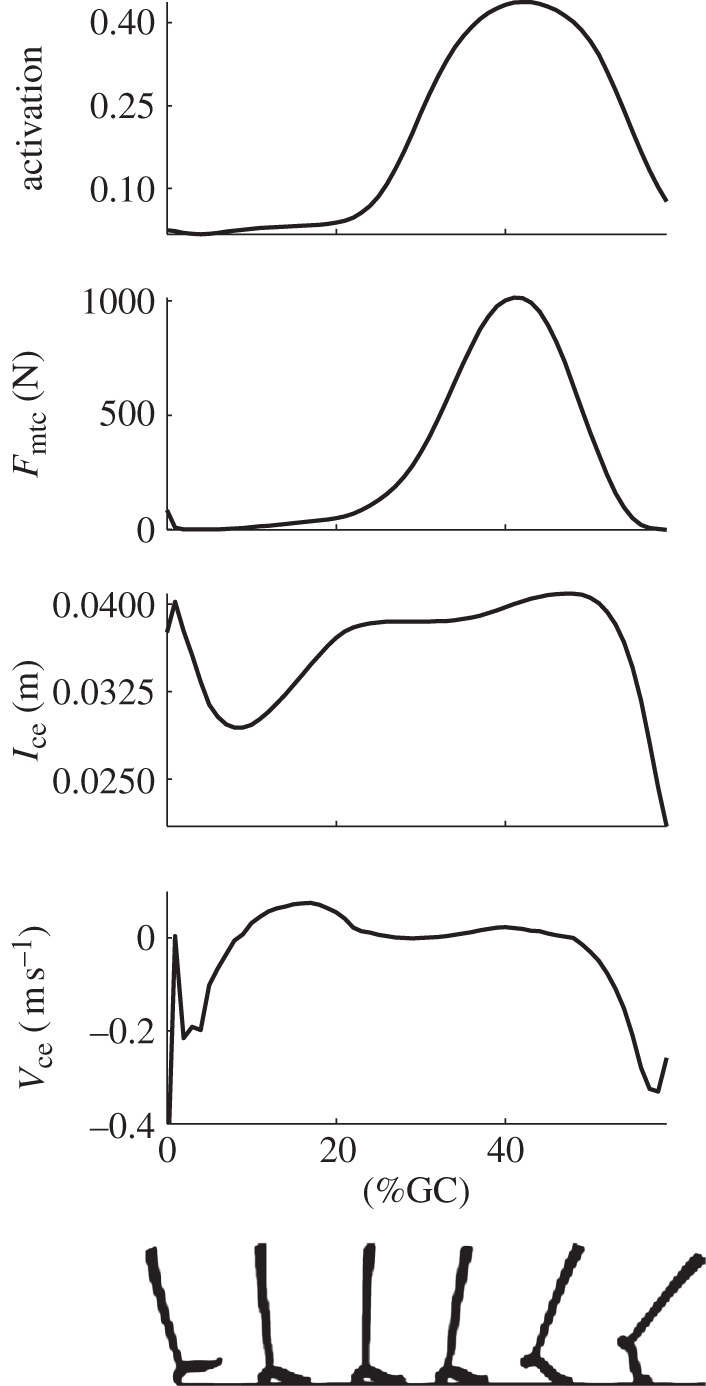
Gastrocnemius activation, force, contractile element length and contractile element velocity estimated by the data-driven muscle–tendon model. Only stance phase is shown, with 0% gait cycle (GC) representing heel strike (as is the case in subsequent figures); walking speed 1.25 m s−1.
While the analysis above motivates our purely feedback-based control architecture, it does not quantify the mathematical form of the reflexes or the control parameters defining the feedback functions. Here we specify a simple linear feedback structure similar to that used by Geyer & Herr [9] for both plantar flexor muscles, wherein changes in muscle length, velocity and force are communicated to the spinal cord (with a delay) and are amplified by a gain to collectively generate neural stimulation to the muscle. The stimulation x(t) of an individual muscle is given by
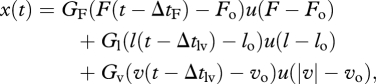 |
2.3 |
where GF, Gl and Gv are the gains and ΔtF, Δtl and Δtv are the time delays for the force, muscle length and muscle velocity terms, respectively. The functions u(F − Fo), u(l − lo) and u(|v|− vo) are unit step functions which ensure that the feedback terms are only enabled when the threshold values of Fo, lo and vo (all positive) are exceeded. The time delays represent the path length from muscle to spinal cord, and spinal cord back to the neuromuscular junction. Each delay was taken to be 20 ms [26–28]. The stimulation defined in equation (2.3) translates to muscle activation α(t) via the dynamics of cross-bridge formation as specified in equation (2.1).
The free parameters governing the relation between muscle force and states F(t), l(t) and v(t) and neural stimulation S(t) are the gains GF, Gl and Gv and thresholds Fo, lo and vo. Although a static inspection of trends in the muscle activation, force and state profiles was used above to motivate the reflex architecture, the unknown parameters were identified with a fitting scheme that included the dynamical muscle–tendon model. This was done so as to account for effects of the Hill-type muscle dynamics and the tendon action in a self-consistent manner. The six parameters were chosen so as to minimize the mean-squared error between the feedback-driven activation and the muscle activation estimated from EMG data. The fit was implemented using a genetic algorithm followed by gradient descent in an effort to avoid the numerous local minima that occurred in the mean-squared error. The muscle–tendon parameters were taken to be fixed to their optimal values (determined via (2.2)) while fitting the reflex parameters, with each muscle being treated separately. The enforced bounds for each parameter were determined using the force, length and velocity profiles given by the muscle–tendon model driven by biological data. Specifically, the reflex gains were allowed to range from zero to a gain that would dominate the net muscle activation, given these nominal force, length and velocity profiles. The threshold on the length term was allowed to range from the minimum to maximum contractile element length in stance, while the velocity threshold was allowed to vary from zero to the maximum absolute value of velocity observed in stance. The boundaries on the force threshold were chosen to ensure that positive force feedback was engaged sufficiently early to make a large contribution, as expected from Geyer & Herr [9].
(b). Application to prosthesis control
This neuromuscular model was then applied to produce an entirely feedback-based controller for a powered ankle–foot prosthesis. The ankle controller took ankle angle, knee angle and walking state (stance or swing phase) as input and produced plantar flexor torque based on the neuromuscular models of the soleus and gastrocnemius. The start of the gait cycle in the hardware controller was defined to be consistent with the biological data. Dorsiflexion torque was provided using a unidirectional rotary spring-damper to model the contribution of the TA dorsiflexor. The dorsiflexor choice was made for simplicity and justified by the comparably small amount of torque produced by the dorsiflexors during stance [22], which could adequately be represented by a spring engaged in early stance [29]. Details are described below.
To evaluate the viability of our model for controlling a prosthesis across speed, the model was used to control a prosthetic apparatus comprising a powered ankle–foot prosthesis and an instrumented actuated knee brace worn by an amputee. The ankle and knee joint states of the apparatus were measured and used to provide realtime input to the neuromuscular model simulated by an on-board microcontroller. The resulting torque command from the neuromuscular model was used to produce ankle torque while a knee controller adjusted the torque produced by the knee brace. This configuration, shown in figure 3, was set up to enable the prosthetic apparatus to behave as if it were a human lower-leg with reflex-controlled muscles acting at the ankle.
Figure 3.

Labelled photograph of the prosthetic apparatus and associated labelled schematic and control architecture. The rotary elements in the ankle–foot prosthesis are shown as linear equivalents in the model schematic for clarity. In the control schematic, the parallel spring contribution to prosthesis ankle torque, τp, was subtracted from the desired ankle torque command from the neuromuscular model, τd, to obtain the desired SEA torque τd,SEA. A motor current command imot was obtained by multiplying by the motor torque-constant Kt and produced using a custom motor controller (not shown). The knee clutch was engaged via the solenoid depending on knee state as obtained from the knee potentiometer.
(c). Powered ankle-foot prosthesis
As in Eilenberg et al. [10], this study made use of a powered ankle–foot prosthesis (iWalk, LLC, Cambridge, MA, http://www.iwalkpro.com) having a size and weight (1.8 kg) similar to the intact biological ankle–foot complex. The prosthesis included a brushless motor, ballscrew transmission and Kevlar leaf-spring that together comprised a series-elastic actuator (SEA) [30]. The specifications of this drivetrain are listed in table 1. The SEA was capable of producing torque about the revolute ankle joint, analogous to the torque produced by the plantar flexor and dorsiflexor muscles about the human biological ankle joint. The robotic ankle's theoretical torque capability exceeded 300 Nm. A unidirectional parallel spring engaged when the ankle was dorsiflexed and thereby assisted the SEA during walking [2]. A compliant carbon-fibre leaf-spring attached to the base of the prosthesis acted as a foot.
Table 1.
Specifications for the ankle–foot prosthesis. The ankle transmission ratio took its minimum value at maximum (17°) dorsiflexion and maximum value at maximum (24°) plantar flexion. The series spring stiffness is direction-dependent. The reported spring constants are nominal values. In practice, they vary with angle and applied torque as governed by the geometry of the linkage and series spring design. However, these variations were experimentally evaluated and subsequently calibrated out.
| parameter | units | value |
|---|---|---|
| series spring: plantar torque | Nm deg−1 | 8.38 |
| series spring: dorsiflexilon torque | Nm deg−1 | 27.23 |
| parallel spring | Nm deg−1 | 14.66 |
| ankle transmission ratio | — | 175–205 |
(d). Knee clutch
As the gastrocnemius acts at both the ankle and knee, a spring-clutch was mounted at the knee brace to provide the knee flexion action of the gastrocnemius. The mechanism consisted of a toothed clutch at the free end of a coil spring (spring stiffness of 66 500 Nm−1), which acted as a knee flexor on a polycentric knee brace. The brace was integrated into a prosthetic socket connected to the ankle–foot prosthesis. When the clutch was engaged via solenoid action, the free end of the spring locked with respect to the socket and the spring stretched as the knee straightened. The force developed by the spring produced a flexion torque at the knee joint. Conversely, when the clutch disengaged, no torque was applied at the knee joint. The spring acted on the knee joint with a moment arm that varied between 0.02 and 0.03 m as a function of knee angle. This moment–arm function was designed so that the apparent knee stiffness matched that of the biological knee during level-ground walking [31,32].
(e). Angle measurements
The ankle angle and knee angle of the prosthetic apparatus provided the primary control inputs to the neuromuscular model. To measure joint angle, an AM8192B sensor from Renishaw (Gloucestershire, UK (www.renishaw.comiwalk)) was used to measure the field angle of a magnet mounted at the joint. As the foot had some inherent compliance, its deflection during walking contributed to the overall ankle angle. Therefore, the measured ankle torque and estimated forefoot spring constant of 22.72 Nm deg−1 were used to estimate foot deflection from forefoot loading. This deflection was added to the joint angle measurement for input to the plantar flexors in the neuromuscular model and for data analysis. A potentiometer at the knee provided an estimate of knee joint angle.
Once measured, the ankle and knee angles were passed to lookup tables that estimated the muscle–tendon unit lengths and ankle moment arms of the modelled plantar flexors. These lookup tables were based on the musculoskeletal geometry of the intact subject, as determined by SIMM. The output muscle–tendon unit lengths and moment arms were then used by the neuromuscular model to compute commanded torque.
(f). Electronics
A Microchip Technology Incorporated PIC32MX575F512H, a single-chip, 32-bit, DSP-oriented microcontroller running at 500 Hz was used to run the neuromuscular model in real-time using the angle and torque sensor data from the hardware as input. Sensor and internal states could be sent to a data-collection computer via an onboard IEEE 802.11g wireless radio.
(g). Control
For control purposes, the gait cycle was divided into stance and swing phases. The phases of gait were determined using the state transitions described by Eilenberg et al. [10]. These transitions were triggered using moment estimates from strain gauges embedded in the prosthetic pyramid on the powered ankle–foot prosthesis. During stance phase, the neuromuscular model provided the primary torque command to the ankle. Since in biology the plantar flexor muscles dominate ankle torque during the stance phase of walking [22], neuromuscular models were used to represent them. However, as the action of the TA and other dorsiflexors resembles that of a linear spring early in the stance phase [29], when the torque contribution of the plantar flexors is small [22], the TA was modelled, for simplicity, as a unidirectional virtual rotary spring-damper of the form:
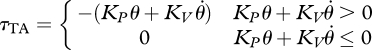 |
2.4 |
where τTA is the TA ankle torque contribution, KP is the spring constant, KV is the damping constant, θ is the ankle angle and  is the ankle angular velocity. KP was fit to best match the ankle torque–angle relation of the intact-limbed subject early in the stance phase (3.04 Nm deg−1) and KV was experimentally set to 0.0524 Nm s deg−1 to prevent prosthesis foot oscillations at foot-flat. To prevent the TA from fighting the plantar flexors during late stance, once the magnitude of τTA dropped to 0 during a given stance phase, τTA was suppressed to 0 for the remainder of stance (as in [10]). During the swing phase, the plantar flexors were turned off by reducing the reflex stimulations to their baseline values and the TA was made to be bidirectional to enable full control of the ankle joint. The TA impedance was also increased during the swing phase (experimentally tuned to KP = 3.84 Nm deg−1, KV = 0.122 Nm s deg−1) for achieving early ground clearance. When well into the swing phase, the impedance of the TA was reset to the stance phase setting in preparation for heel strike. The knee clutch was engaged shortly after maximum knee flexion in stance phase, as the clutch passively locked once under load. Once the knee angle returned to the engagement angle later in the stance phase, the clutch released automatically.
(h). Torque generation and measurement
Physical torque at the ankle joint was generated by both the motorized drive train and the parallel spring. The ankle angle sensor and known parallel spring stiffness were used to estimate the parallel spring torque contribution and the remaining desired torque was commanded to the motor (figure 3). The motor current was enforced using closed-loop current control with a custom motor controller comprising an H-bridge driven with pulse width modulation.
The total ankle torque was computed by adding the SEA torque contribution to the parallel spring torque estimate. The SEA torque contribution was estimated using the series spring deflection and the calibrated stiffness of the series spring. The deflection, in turn, was computed by comparing ankle angle to motor angle (measured with an optical shaft encoder). The knee torque was estimated using a linear potentiometer at the coil spring for spring force along with a moment arm function relating linear force to knee torque.
(i). Clinical experiments
Clinical experiments were approved by MIT's Committee on the Use of Humans as Experimental Subjects (COUHES). After giving informed consent, a healthy active bilateral transtibial amputee participant, height and weight matched to the intact-limbed subject, was fitted with the prosthetic apparatus. The participant donned the actuated prosthetic apparatus on his right leg and wore a conventional passive transtibial ankle–foot prosthesis on his left leg. Following initial walking trials for natural adjustment, the subject was asked to walk at three different speeds (0.75, 1.0 and 1.25 m s−1) across a 5.3 m long path. For each walking trial, the participant began walking approximately 3 m from the beginning of the pathway and stopped walking approximately 3 m past the end of the path. The beginning and end of the 5.3 m path were labelled with markers on the ground. A stopwatch was used to verify the average walking speed for each trial by noting when the subject's centre of mass passed over each of the markers. A total of 39 trials were captured.
(j). Data processing
Only steady-state gait cycles within 10 per cent of the three target speeds were used for analysis. All gait cycles were re-sampled to span 1000 points. The net work was calculated for each individual gait cycle by numerically integrating ankle torque over ankle angle from heel strike to toe-off. An ensemble average net work across gait cycles was then calculated for each trial.
3. Results
(a). Modelling
The optimized muscle–tendon parameters and fit reflex parameters for the dominant ankle plantar flexors (soleus and gastrocnemius) are shown in table 2. The reflex parameter fit was seen to converge within tolerance, with the objective function having a negligible slope/curvature ratio for each parameter at the minimum. The fit was conducted 10 times on each muscle starting with differing initial populations in the genetic algorithm with little effect on the final parameters.
Table 2.
Boundaries and fit values for plantar flexor muscle–tendon and reflex parameters. The muscle–tendon parameters were determined as described in Krishnaswamy et al. [13] and fixed during reflex parameter fitting. GAS, gastrocnemius; SOL, soleus.
| parameter | units | min. val. | max. val. | fit val. |
|---|---|---|---|---|
| GAS Fmax | N | 1398 | 6990 | 1759 |
| GAS lslack | m | 0.282 | 0.460 | 0.399 |
| GAS Ksh | — | 1 | 5 | 2.81 |
| GAS λref | — | 0.02 | 0.09 | 0.042 |
| GAS GF | N−1 | 0 | 5e − 4 | 1.45e − 4 |
| GAS Fo | N | 0 | 203 | 78.3 |
| GAS Gl | m−1 | 0 | 10 | 3.66 |
| GAS lo | m | 3.05e − 2 | 4.25e − 2 | 3.09e − 2 |
| GAS Gv | s m−1 | 0 | 2 | 0.167 |
| GAS vo | m s−1 | 0 | 0.278 | 2.23e − 4 |
| SOL Fmax | N | 3650 | 18251 | 7142 |
| SOL lslack | m | 0.175 | 0.293 | 0.250 |
| SOL Ksh | — | 1 | 5 | 2.25 |
| SOL λref | — | 0.02 | 0.09 | 0.083 |
| SOL GF | N−1 | 0 | 1e − 4 | 2.62e − 5 |
| SOL Fo | N | 0 | 543 | 10.5 |
| SOL Gl | m−1 | 0 | 10 | 2.44 |
| SOL lo | m | 0.015 | 2.87e − 2 | 1.75e − 2 |
| SOL Gv | s m−1 | 0 | 2 | 5.65e − 2 |
| SOL vo | m s−1 | 0 | 0.196 | 1.29e − 3 |
Figure 4 shows the fit to soleus activation and the resulting muscle dynamics. The r2 values for the activation, force and length fits were 0.83, 0.92 and 0.95, respectively. The r2 values for these fits in the gastrocnemius were 0.90, 0.94 and 0.94, respectively. The figure also shows the contributions of the different reflexes to follow the sequence described above. It was found that the positive force feedback term dominated the fit but was reliant on the length feedback term to time and scale its buildup. These contributions were roughly maintained when the neuromuscular model was applied to biological ankle angles at different walking speeds, as evidenced by figure 5. Very similar profiles and relative reflex contributions were seen in both plantar flexors.
Figure 4.
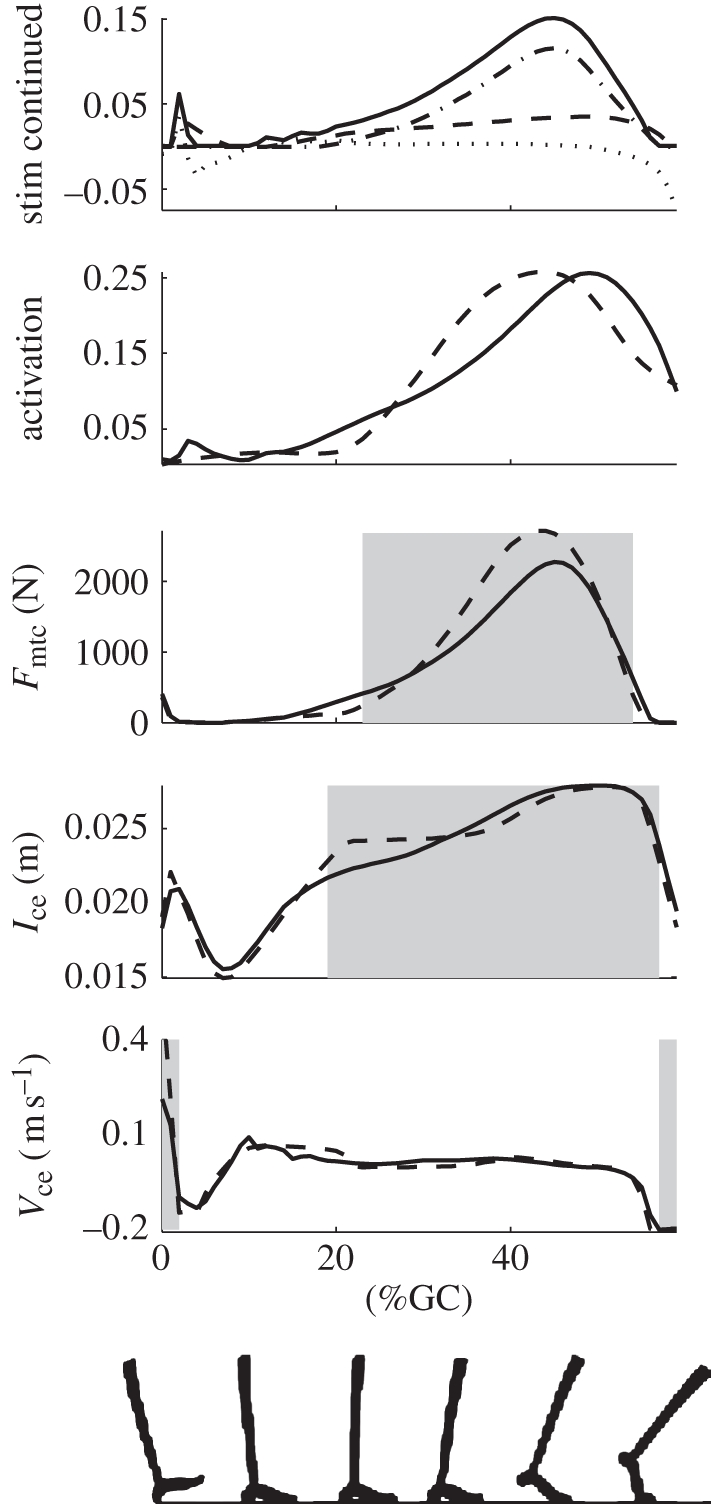
Comparison of the soleus muscle dynamics produced by EMG versus those produced by reflex feedback to the muscle–tendon model. The top plot shows the contributions from the force, length and velocity terms to the stimulation. Here, the stimulation is the solid line, the force term is the dashed-dot line (largest contributor), the length is the dashed line and the velocity term (which goes negative) is the dotted line. In the rest of the plots, the dashed curves are the model outputs given EMG-based activation, while the solid curves are the corresponding variables when the model activation is determined by the reflex structure in equation (2.3). The shaded regions indicate the times where the force, length and velocity feedback terms contribute at least 0.01 to the stimulation. All plots used biological angles for walking trials at 1.25 m s−1.
Figure 5.
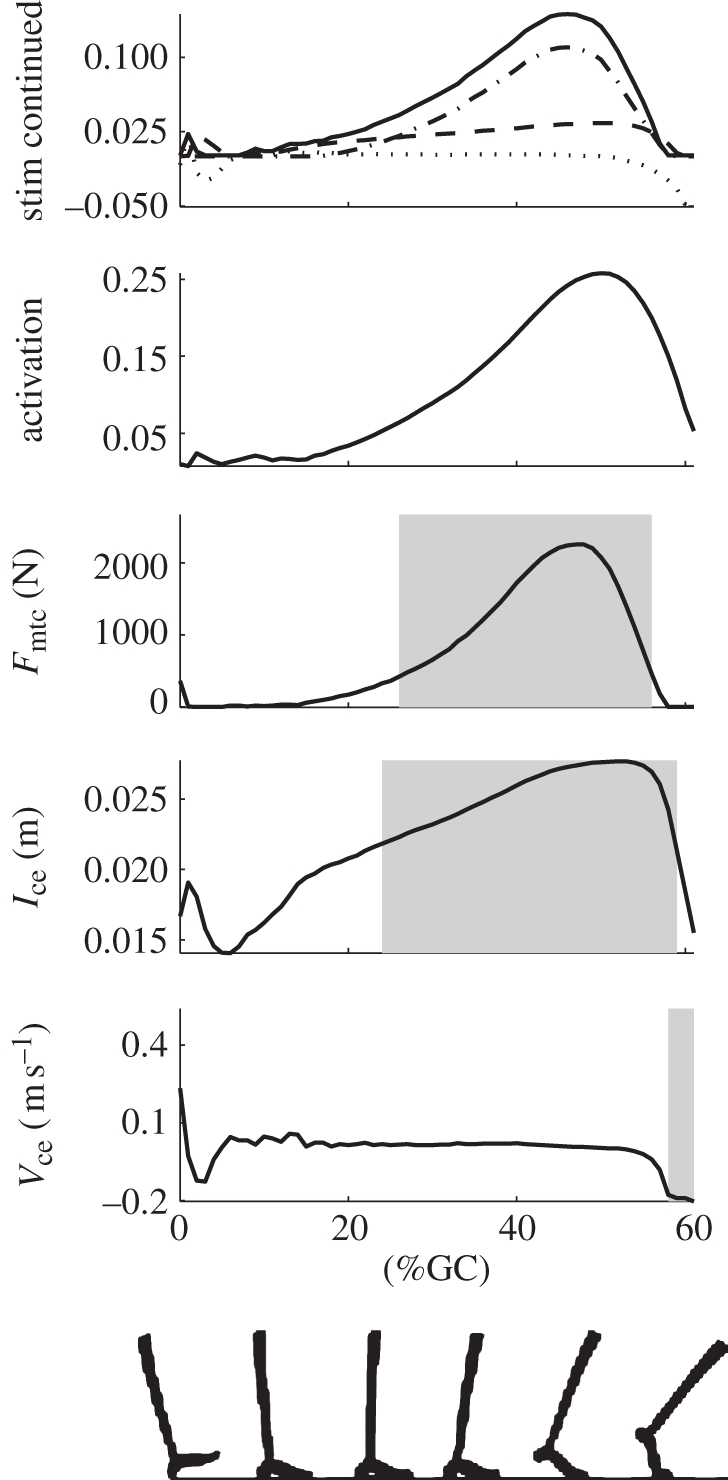
Plot of soleus muscle dynamics produced by the reflex-based stimulation (equation (2.3)) for input ankle angles from walking trials at 0.75 m s−1. The top plot shows the contributions to the stimulation (solid line) from the force (dashed-dot line), length (dashed line) and velocity terms (dotted line). The remaining plots (from top to bottom) show the total activation, muscle force, contractile element length and contractile element velocity. The shaded regions indicate the times where the force, length and velocity feedback terms contribute at least 0.01 to the stimulation.
(b). Clinical trials
The results of the clinical trials are summarized in figures 6–8. Figure 6 shows the mean angle and torque profiles for the ankle–foot prosthesis and knee joint during the 1.25 m s−1 clinical walking trials. The biological gastrocnemius component of knee torque was estimated for this plot by feeding joint kinematics and EMG from the intact-limbed subject into the model from Krishnaswamy et al. [13]. The resulting gastrocnemius force was multiplied by the moment arm of this muscle as estimated with SIMM. There is a qualitative agreement in angle and torque profiles between the prosthetic apparatus and those of the intact-limbed subject. However, the ankle angle of the prosthetic apparatus deflected less than the intact biological ankle, resulting in smaller peak torque. The torque produced by the knee clutch was also seen to be smaller than the biological counterpart, implying that the spring in the knee clutch mechanism was too soft.
Figure 6.

Comparison of prosthesis ankle and knee angles and torques during the clinical trials (measured) with those from a height- and weight-matched subject with intact limbs (biological). Torque that plantar flexes the ankle is defined to be positive and moves the angle in the positive direction. Similarly, torque that flexes the knee is positive and increases the knee angle. The biological values are the thick solid lines (with shaded errors) in each plot while the dashed lines are the values measured on the prosthesis. In the ankle torque plot the commanded torque is shown as a thinner solid line, again with shaded error bars. The knee torque plot compares the torque provided by the clutch-spring mechanism to that provided by the natural gastrocnemius in simulation. The vertical line indicates toe off in each plot.
Figure 8.

Energy output of the ankle across gait speed. Shown are biological data, net work as commanded by the ankle–foot prosthesis during clinical trials and measured net work during the clinical trials. Inverted triangles, biological; crosses, commanded clinical trials; circles, measured clinical trials; continuous line, biological trend; dashed lines, command trend; dotted lines, measured trend.
The ankle–foot prosthesis angle and commanded torque for the three target walking speeds are plotted in figure 7. The magnitudes of both peak angular deflection and peak torque are seen to increase with walking speed, with both variables aligning in per cent gait cycle across speed. The third pane in figure 7 shows an increase in commanded positive ankle work across speed, a trend that is also observed in intact-limbed individuals [29]. As can be seen from figure 8, this trend is also reflected in the measured net ankle work.
Figure 7.

Commanded ankle angles, torques and work loops for three speeds in clinical walking trials. Shown are data for three speeds: 0.75 m s−1 (solid line), 1.0 m s−1 (dashed line) and 1.25 m s−1 (dotted line). In the torque versus angle plot, heel strike is indicated using a circle.
4. Discussion
The reflex-based controller developed in this study produced a trend of increasing net work with walking speed during clinical trials. Looking at the kinematics and dynamics of the prosthetic ankle joint (figure 7), this trend can be attributed to at least two effects. First, both the peak ankle angle and peak torque increase at faster walking speeds. The angle increase is produced by a combination of kinematic and dynamic changes associated with higher walking speeds, such as increased stride length and higher dynamic loading of the ankle joint. Although the angle and torque are inter-related through the dynamics of the amputee subject, an increase in angle tends to produce correspondingly higher torques.2 The angle and torque remain aligned in the gait cycle across speed; so increasing both peak values results in a larger work loop and hence more positive net work. The second effect producing the trend in net work is the increased ankle plantar flexion in terminal stance at faster walking speeds. When combined with a torque profile that increases with increasing speed, this further contributes to the trend in net work.
Although the subject is able to influence the ankle behaviour by changing walking speed, tracking a desired angle trajectory at will is not possible. The subject is not an infinite impedance position source and is thus reliant on the controller to produce torques that, when interacting with the human dynamics, produce reasonable angles. The observed trend in net work therefore implies that the controller is able to effectively modulate ankle joint quasi-static impedance (slope of joint torque versus state) across speed.
The behaviour of the controller can be further understood through simulations that provide the neuromuscular model with biological ankle angles at different speeds. This is possible because the muscle states seen in the controller during clinical trials (with angle input from the prosthesis) are qualitatively similar to those obtained from simulations (with angle input from the intact-limbed subject). It was evident in both simulations and clinical tests that the stimulation profiles provided to the muscles vary little with speed when normalized to per cent gait cycle (figures 4 and 5). This similarity is a result of the consistent timing of the force, length and velocity reflex contributions throughout stance. The sequence is preserved across speed by the length feedback term, which governs the timing and magnitude of force buildup. The importance of timing is consistent with the findings of Winter [8], who suggested that walking speed is governed by gains and maintains its timing as a result of afferent feedback.
One may compare the results of our study with those of previous works. The positive force feedback term that dominates force production in our model was based on the studies of Geyer & Herr [9] and Prochazka et al. [33]. The length term in equation (2.3) represents the stretch reflex, while the velocity term represents negative feedback controlling the rate of muscle contraction. If the muscle is lengthening too rapidly, the velocity term will increase the activation; if it is shortening too quickly, the velocity term will reduce activation. Several empirical studies [12,34–38] have demonstrated the presence of afferent feedback in the plantar flexors during stance. These studies record the changes in muscle EMG signals when the gait of a subject is perturbed either by changing the inclination of the walking surface or by forcing muscle–tendon length changes using an orthosis. Notably, Klint et al. [12] isolated the contributions of force-based and length-based afferent feedback during different intervals of stance at self-selected walking speed. They found that force feedback was dominant in late stance but contributed little during midstance perturbations, where spindle-based feedback probably dominates. This sequence is similar to that seen in our plantar flexor reflexes, although our modelling was done without perturbations. One further study that would specifically address the role of reflexes in speed adaptation would be a direct comparison of plantar flexor EMG signals during walking at different speeds between a normal and a de-afferented subject. If reflexes are dominant in speed adaptation, as postulated in this study, one should see a sluggishness in the adaptation to different speeds of the de-afferented subject.
This study extends the work of Eilenberg et al. [10] by considering the structural morphology of the ankle plantar flexors and including length and velocity feedback terms. Speed adaptation is enabled through these changes. It appears that inclusion of the stretch reflex in both plantar flexors was critical for timing and scaling force buildup, thereby enabling an increase in positive net work across speed.
Despite the speed adaptation exhibited by our approach, some limitations are evident. First, the chosen reflex structure does not necessarily reflect the true biological control scheme. The ability to reproduce this scheme would rely on knowledge of the non-reflexive neural drive provided to muscles as well as the true structure of the reflexive feedback. Despite the absence of this knowledge, our scheme provides functional results. A second limitation of our approach was the simple impedance approximation used for the ankle dorsiflexor model. This approximation reduced the quality of the ankle torque fit in early stance; the fit may be improved by including a dorsiflexor muscle model similar to those used for the plantar flexors.
Despite these limitations, this work may serve as a starting point for several natural extensions. Different reflex structures may be explored and the effect of non-reflexive neural drive examined. The interaction of the neuromuscular model with mechanical effects (human dynamics, ground contact forces, etc.) may be better understood by conducting a forward dynamic simulation similar to that of Geyer & Herr [9]. Our overall approach may be extended to include muscles further up the leg, possibly leading to speed-adaptive control schemes for multiple prosthetic joints. Finally, the generality of the approach could be tested by studying the behaviour of the reflex-based controller when applied to tasks other than level ground walking. In the design of adaptive prosthetic limbs, we believe that the application of neuromechanical principles is of critical importance.
Acknowledgements
Conceived and designed the study: H.H., P.K.; developed neuromuscular modelling framework and deduced feedback control architecture: P.K.; determined reflex parameters: J.M.; developed knee brace: K.E.; interfaced hardware sensing with muscle-reflex model: J.M., M.E.; developed electronics and core firmware: C.B.; performed prosthetic apparatus system identification and control: M.E.; conducted clinical experiments: M.E.; analysed data and wrote the paper: J.M., M.E., P.K.; oversaw and guided the work: H.H. This research was sponsored in part by the Department of Veterans Affairs, Center for Restorative and Regenerative Medicine, Providence VA Medical Center, RI, USA.
Endnotes
One contribution of 15 to a Theme Issue ‘Integration of muscle function for producing and controlling movement’.
The tibialis anterior was modelled in the same way as the plantar flexors here but replaced with a rotary spring-damper in the prosthesis controller described later.
This observation was verified in simulation by scaling the biological ankle angle trajectory in magnitude and observing an increased peak torque from the model.
References
- 1.Gates D. 2004. Characterizing ankle function during stair ascent, descent, and level walking for ankle prosthesis and orthosis design. Masters Thesis, Boston University, Boston, MA [Google Scholar]
- 2.Au S. K., Weber J., Herr H. 2009. Powered ankle-foot prosthesis improves walking metabolic economy. IEEE Trans. Robot. 25, 51–66 10.1109/TRO.2008.2008747 (doi:10.1109/TRO.2008.2008747) [DOI] [Google Scholar]
- 3.Hitt J. K., Sugar T. G., Holgate M., Bellman R. 2010. An active foot-ankle prosthesis with biomechanical energy regeneration. J. Med. Devices 4, 011003. 10.1115/1.4001139 (doi:10.1115/1.4001139) [DOI] [Google Scholar]
- 4.Sup F., Varol H. A., Mitchell J., Withrow T. J., Goldfarb M. 2009. Self-contained powered knee and ankle prosthesis: initial evaluation on a transfemoral amputee. In IEEE Int. Conf. Rehabil. Robot., 23 June 2009. pp. 638–644 IEEE 10.1109/ICORR.2009.5209625 (doi:10.1109/ICORR.2009.5209625) [DOI] [PMC free article] [PubMed] [Google Scholar]
- 5.Au S., Weber J., Herr H. 2009. Powered ankle-foot prosthesis improves walking metabolic economy. IEEE Trans. Robot. 25, 51–66 10.1109/TRO.2008.2008747 (doi:10.1109/TRO.2008.2008747) [DOI] [Google Scholar]
- 6.Holgate M. A., Bohler A. W., Sugar T. G. 2008. Control algorithms for ankle robots: a reflection on the state of the art and presentation of two novel algorithms. In Proc. of the 2nd Biennial IEEE/RAS-EMBS Int. Conf. on Biomed Robots and Biomechatronics, Scottsdale, AZ, 19–22 October 2008. pp. 97–102 IEEE 10.1109/BIOROB.2008.4762859 (doi:10.1109/BIOROB.2008.4762859) [DOI] [Google Scholar]
- 7.Kandel E. R., Schwartz J. H., Jessell T. M. 2000. Principles of neural science, 4th ed. Columbus, OH: McGraw-Hill [Google Scholar]
- 8.Winter D. A. 1983. Biomechanical motor patterns in normal walking. J. Motor Behav. 15, 302–330 [DOI] [PubMed] [Google Scholar]
- 9.Geyer H., Herr H. M. 2010. A muscle-reflex model that encodes principles of legged mechanics produces human walking dynamics and muscle activities. IEEE Trans. Neural Syst. Rehabil. Eng. 18, 263–273 10.1109/TNSRE.2010.2047592 (doi:10.1109/TNSRE.2010.2047592) [DOI] [PubMed] [Google Scholar]
- 10.Eilenberg M. F., Geyer H., Herr H. 2010. Control of a powered ankle-foot prosthesis based on a neuromuscular model. IEEE Trans. Neural Syst. Rehabil. Eng. 18, 164–173 10.1109/TNSRE.2009.2039620 (doi:10.1109/TNSRE.2009.2039620) [DOI] [PubMed] [Google Scholar]
- 11.Eilenberg M. F. 2009. A neuromuscular-model based control strategy for powered ankle-foot prostheses. M.S. Thesis, Massachusetts Institute of Technology, Cambridge, MA [DOI] [PubMed] [Google Scholar]
- 12.Klint R., Nielsen J. B., Sinkjaer T., Grey M. 2009. Sudden drop in ground support produces force related unload response in human over-ground walking. J. Neurophysiol. 101, 1705–1712 10.1152/jn.91175.2008 (doi:10.1152/jn.91175.2008) [DOI] [PubMed] [Google Scholar]
- 13.Krishnaswamy P., Brown E., Herr H. M. 2011. Human leg model predicts ankle muscle-tendon morphology, state, roles and energetics in walking. PLOS Comput. Biol. 7, e1001107. 10.1371/journal.pcbi.1001107 (doi:10.1371/journal.pcbi.1001107) [DOI] [PMC free article] [PubMed] [Google Scholar]
- 14.Clancy E. A., Morin E. L., Merletti R. 2002. Sampling, noise-reduction and amplitude estimation issues in surface electromyography. J. Electromyogr. Kinesiol. 12, 1–16 10.1016/S1050-6411(01)00033-5 (doi:10.1016/S1050-6411(01)00033-5) [DOI] [PubMed] [Google Scholar]
- 15.Sanger T. D. 2007. Bayesian filtering of myoelectric signals. J. Neurophysiol. 97, 1839–1845 10.1152/jn.00936.2006 (doi:10.1152/jn.00936.2006) [DOI] [PubMed] [Google Scholar]
- 16.Zajac F. E. 1989. Muscle and tendon: properties, models, scaling, and application to biomechanics and motor control. Crit. Rev. Biomed. Eng. 17, 359–411 [PubMed] [Google Scholar]
- 17.Winters J. M., Woo S. L. Y. (eds) 1990. Multiple muscle systems: biomechanics and movement organization. New York, NY: Springer [Google Scholar]
- 18.Delp S. L., Loan J. P. 1995. A graphics-based software system to develop and analyze models of musculoskeletal structures. Comput. Biol. Med. 25, 21–34 10.1016/0010-4825(95)98882-E (doi:10.1016/0010-4825(95)98882-E) [DOI] [PubMed] [Google Scholar]
- 19.McMahon T. A. 1984. Muscles, reflexes, and locomotion. Princeton, NJ: Princeton University Press [Google Scholar]
- 20.Hill A. V. 1938. The heat of shortening and the dynamic constants of muscle. Proc. R. Soc. Lond. B 126, 136–195 10.1098/rspb.1938.0050 (doi:10.1098/rspb.1938.0050) [DOI] [Google Scholar]
- 21.Ma S. P., Zahalak G. I. 1991. A distribution-moment model for energetics in skeletal muscle. J. Biomech. 24, 21–35 10.1016/0021-9290(91)90323-F (doi:10.1016/0021-9290(91)90323-F) [DOI] [PubMed] [Google Scholar]
- 22.Perry J. 1992. Gait analysis. Thorofare, NJ: SLACK Incorporated [Google Scholar]
- 23.Brown T. G. 1914. On the nature of the fundamental activity of the nervous centres; together with an analysis of the conditioning of rhythmic activity in progression, and a theory of the evolution of function in the nervous system. J. Physiol. 48, 18–46 [DOI] [PMC free article] [PubMed] [Google Scholar]
- 24.Orlovsky G., Deliagina T., Grillner S. 1999. Neuronal control of locomotion: from mollusc to man. New York, NY: Oxford University Press [Google Scholar]
- 25.Daley M. A., Felix G., Biewener A. A. 2007. Running stability is enhanced by a proximo-distal gradient in joint neuromechanical control. J. Exp. Biol. 210, 383–394 10.1242/jeb.02668 (doi:10.1242/jeb.02668) [DOI] [PMC free article] [PubMed] [Google Scholar]
- 26.Geyer H., Seyfarth A., Blickhan R. 2003. Positive force feedback in bouncing gaits? Proc. R. Soc. Lond. B 270, 2173–2183 10.1098/rspb.2003.2454 (doi:10.1098/rspb.2003.2454) [DOI] [PMC free article] [PubMed] [Google Scholar]
- 27.Stein R. B., Capaday C. 1988. The modulation of human reflexes during functional motor tasks. Trends Neurosci. 11, 328–332 10.1016/0166-2236(88)90097-5 (doi:10.1016/0166-2236(88)90097-5) [DOI] [PubMed] [Google Scholar]
- 28.Knikou M., Rymer W. Z. 2002. Effects of changes in hip joint angle on H-reflex excitability in humans. Exp. Brain Res. 143, 149–159 10.1007/s00221-001-0978-4 (doi:10.1007/s00221-001-0978-4) [DOI] [PubMed] [Google Scholar]
- 29.Palmer M. L. 2002. Sagittal plane characterization of normal human ankle function across a range of walking gait speeds. M.S. Thesis, Massachusetts Institute of Technology, Cambridge, MA [Google Scholar]
- 30.Pratt J., Krupp B., Morse C. 2002. Series elastic actuators for high fidelity force control. Indust. Robot: An Int. J. 29, 234–241 [Google Scholar]
- 31.Endo K., Swart E., Herr H. 2009. An artificial gastrocnemius for a transtibial prosthesis. In Eng. Med. Biol. Soc. (EMBC) 2009. Annu. Int. Conf. IEEE, Minneapolis MN, 3–6 September 2009. pp. 5034–5037 IEEE 10.1109/IEMBS.2009.5333697 (doi:10.1109/IEMBS.2009.5333697) [DOI] [PubMed] [Google Scholar]
- 32.Endo K., Paluska D., Herr H. 2006. A quasi-passive model of human leg function in level-ground walking. In 2006 IEEE/RSJ Int. Conf. Intelligent Robots and Systems, Beijing, China, 9–15 October 2006. pp. 4935–4939 10.1109/IROS.2006.282454 (doi:10.1109/IROS.2006.282454) [DOI] [Google Scholar]
- 33.Prochazka A., Gillard D., Bennett D. J. 1997. Positive force feedback control of muscles. J. Neurophsiol. 77, 3226–3236 [DOI] [PubMed] [Google Scholar]
- 34.Sinkjaer T., Andersen J. B., Ladouceur M., Christensen L. O. D., Nielsen J. B. 2000. Major role for sensory feedback in soleus EMG activity in the stance phase of walking in man. J. Physiol. 523, 817–827 10.1111/j.1469-7793.2000.00817.x (doi:10.1111/j.1469-7793.2000.00817.x) [DOI] [PMC free article] [PubMed] [Google Scholar]
- 35.Grey M. J., Ladouceur M., Andersen J. B., Nielsen J. B., Sinkjaer T. 2001. Group II muscle afferents probably contribute to the medium latency soleus stretch reflex during walking in humans. J. Physiol. 534, 925–933 10.1111/j.1469-7793.2001.00925.x (doi:10.1111/j.1469-7793.2001.00925.x) [DOI] [PMC free article] [PubMed] [Google Scholar]
- 36.Grey M. J., Nielsen J. B., Mazzaro N., Sinkjaer T. 2007. Positive force feedback in human walking. J. Physiol. 581, 99–105 10.1113/jphysiol.2007.130088 (doi:10.1113/jphysiol.2007.130088) [DOI] [PMC free article] [PubMed] [Google Scholar]
- 37.Klint R., Nielsen J. B., Cole J., Sinkjaer T., Grey M. J. 2008. Within-step modulation of leg muscle activity by afferent feedback in human walking. J. Physiol. 586, 4643–4648 10.1113/jphysiol.2008.155002 (doi:10.1113/jphysiol.2008.155002) [DOI] [PMC free article] [PubMed] [Google Scholar]
- 38.Cronin N., Ishikawa M., Grey M. J., Klint R., Komi P. V., Avela J., Sinkjaer T., Voigt M. 2009. Mechanical and neural stretch responses of the human soleus muscle at different walking speeds. J. Physiol. 587, 3375–3382 10.1113/jphysiol.2008.162610 (doi:10.1113/jphysiol.2008.162610) [DOI] [PMC free article] [PubMed] [Google Scholar]