

Abstract
Although a fronto-parietal network has consistently been implicated in the control of visual spatial attention, the network that guides spatial attention in the auditory domain is not yet clearly understood. To investigate this issue, we measured brain activity using functional magnetic resonance imaging while participants performed a cued auditory spatial attention task. We found that cued orienting of auditory spatial attention activated a medial-superior distributed fronto-parietal network, as well as auditory regions of the sensory cortex. In addition, we found cue-triggered increases of activity in the auditory sensory cortex prior to the occurrence of an auditory target, suggesting that auditory attentional control operates in part by biasing processing in sensory cortex in favor of expected target stimuli. Finally, an exploratory cross-study comparison further indicated several common frontal and parietal regions as being involved in the control of both visual and auditory spatial attention. Thus, the present findings not only reveal the network of brain areas underlying endogenous spatial orienting in the auditory modality, but also suggest that the control of spatial attention in different sensory modalities is enabled in part by some common, supramodal neural mechanisms.
Keywords: fMRI, supramodal, top-down control, fronto-parietal network
1. Introduction
Spatial attention enables individuals to enhance the processing of stimuli that occur at behaviorally-relevant locations in the environment (Hillyard and Anllo-Vento, 1998; Kanwisher and Wojciulik, 2000). Although numerous studies have indicated that the control of spatial attention is enabled by a network of frontal and parietal brain areas (Corbetta and Shulman, 2002; Hopfinger et al., 2000; Mesulam, 1999; Woldorff et al., 2004), almost all of these studies have been conducted entirely within the visual modality. Thus, it has not yet been firmly established whether similar brain areas enable spatial attention in other sensory modalities, such as in audition.
Previous work suggests that spatial attention may be supported by a combination of supramodal and modality-specific brain mechanisms. With regards to supramodal mechanisms, previous studies have shown that attending to a specific location in space in one sensory modality can influence the processing of stimuli in a different sensory modality at or near that location (Macaluso et al., 2000; Talsma and Kok, 2002). Furthermore, patients with parietal-lobe damage often exhibit neglect in both the visual and the auditory modalities (Bellmann et al., 2001; Bisiach et al., 1984; Pavani et al., 2003). On the other hand, the existence of modality-specific mechanisms is suggested by behavioral studies indicating greater interference between two tasks when those tasks are presented in the same versus different sensory modalities (Arnell and Larson, 2002; Duncan et al., 1997; Soto-Faraco and Spence, 2002). Despite these suggestive findings, however, lesion and behavioral studies lack the anatomical precision necessary to reveal the precise neural mechanism underlying the control of auditory spatial attention.
A few recent neuroimaging studies have investigated the brain regions that control auditory spatial attention, and the results suggest that these regions are anatomically similar to those that control visual spatial attention (Mayer et al., 2006; Shomstein and Yantis, 2006; Tzourio et al., 1997). However, these prior studies had several significant limitations. In one study (Tzourio et al., 1997), the use of a block-design did not allow brain regions involved in orienting auditory spatial attention to be distinguished from regions that detect and process auditory targets. In a second study (Mayer et al., 2006), the use of monaurally presented tones as cues did not permit a dissociation between endogenous and exogenous aspects of attentional orienting and, furthermore, may have confounded these attentional effects with lateralized activations resulting from the monaural presentation. Finally, a third recent study reported that the posterior parietal cortex contributes to shifting versus maintaining both spatial and non-spatial auditory attention (Shomstein and Yantis, 2006); however, that study may not have revealed the entire network that underlies top-down orienting of auditory spatial attention since only switch-specific processes were isolated. Thus, the neural mechanisms that enable top-down orienting of auditory spatial attention --and the degree to which these mechanisms are similar to those used to orient spatial attention in other sensory modalities-- remain unclear.
To identify the brain regions that enable top-down orienting of auditory spatial attention, we asked participants to perform a cued auditory spatial attention task while we recorded their brain activity using event-related fMRI. In this task, participants were cued to attend to either the left or the right auditory space in order to detect a faint target sound that appeared in some of the trials. There were mainly two types of cues: Attend-cues (human voice saying “Left” or “Right”), which instructed subjects to orient their attention to the left or right auditory space for a possible target, and “Interpret-cues” (human voice saying “Past”), a control trial type which instructed subjects to not orient their attention to either side. There were also trials in which no cues were presented, which served as No-stim trials. These No-stim trial types were included to facilitate the extraction of the event-related fMRI responses and the removal of overlapping responses from adjacent trials in the sequence (see section 4.5.1.). Lastly, subjects were instructed to delay their behavioral responses until after a “respond signal,” rather than making their responses immediately after detecting the target.
The inclusion of the Interpret-cues, which needed to be fully processed and identified but instructed subjects to not orient attention, provided a control condition that allowed us to isolate and identify the brain areas selectively involved in cue-triggered, voluntary orienting of auditory spatial attention while controlling for the basic sensory and semantic processing of the cue stimuli. Moreover, since the paradigm was directly analogous to the one we used previously to investigate visual spatial attention (Woldorff et al., 2004), we were able to perform an exploratory cross-study comparison to identify supramodal brain areas that enable the control of spatial attention in both the auditory and the visual modalities.
2. Results
2.1. Behavior
Because subjects were instructed to delay their responses until after a “respond signal”, the reaction time could not serve as a meaningful measure of task performance. However, percent hit rate was analyzed, using a one sample paired t-test across participants. The average accuracy for left and right targets, respectively, was 82% and 72%. These values did not differ significantly from one another [t(12) = 1.93, p = .08].
2.2. FMRI
2.2.1. Cue-related activity
Figure 1 presents the brain activation maps for the main contrasts, including those related to cue interpretation (Interpret-cue-only trials minus No-stim trials), attentional orienting (Attend-cue-only trials minus Interpret-cue-only trials), and target-related processing (Attend-cue-plus-target trials minus Attend-cue-only trials). As illustrated in figures 2a and 2b, both Interpret-cue-only trials and Attend-cue-only trials activated frontal and parietal areas as well as the right and left auditory cortices; however, Attend-cues also appeared to activate additional areas, which were not activated by the Interpret-cues.
Figure 1. Brain activity for cues and targets, plotted using F-values, overlaid on several slices of the MNI normalized anatomical brain.
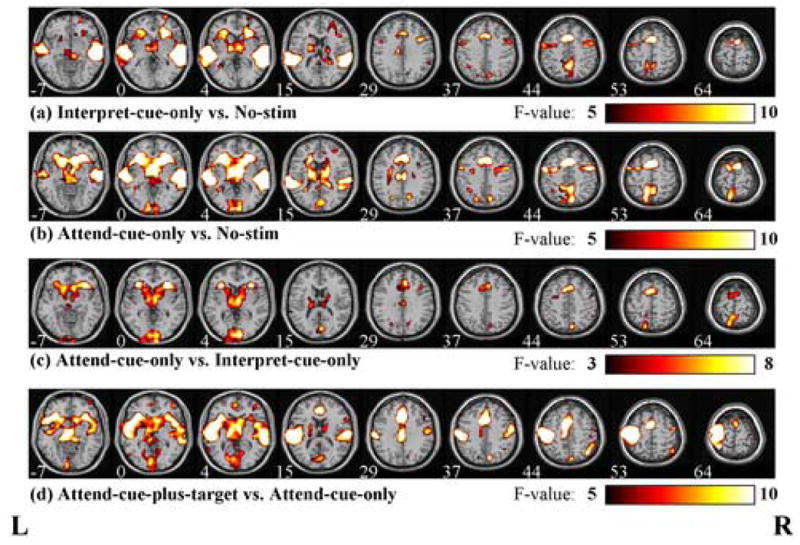
Shown is activity related to (a) cue interpretation processes (Interpret-cue-only trials vs. Nostim trials), (b) cue interpretation processes plus attentional orienting processes (Attend-cue-only trials vs. Nostim trials), (c) attentional orienting processes (Attend-cue-only trials vs. Interpret-cue-only trials), and (d) target-related process (Attend-cue-plus-target vs. Attend-cue-only trials). Nine sample slices are shown for each contrast with the Talairach Z-coordinate (mm) labeled under each slice. The color bars under each row refer to the F-values that are plotted in each of the brain slices.
Figure 2. Attention-orienting activity in (a) dorsal brain areas and (b) ventral brain areas.

These regions were identified by contrasting Attend-cue only with Interpret-cue-only trials, after correcting for overlap using the no-stim subtraction (see Methods). Each plot depicts the average BOLD response (in units of percentage change from the corresponding baseline) across time. Note that the extracted hemodynamic responses for the Attend-cue-only trials (red solid lines) are larger than those for the Interpret-cue-only trials (gray solid line) in these regions.
Both Attend-cues and Interpret-cues were expected to elicit cue interpretation processes, but Attend-cue-only trials also required the deployment of auditory spatial attention. We therefore directly contrasted these two trial types to identify which brain regions were selectively involved in orienting spatial attention within the auditory modality. As revealed in Figure 1c, spatial attentional orienting in the auditory modality (i.e., Attend cue-only versus Interpret cue-only trials) bilaterally activated superior, medial, middle and inferior frontal gyri, anterior cingulate cortex (ACC), middle cingulate cortex (MCC), precuneus/superior parietal lobe (SPL), bilateral anterior insula and bilateral putamen/caudate nuclei. The location of the middle frontal gyrus activations (Fig 1c, Z = 44 mm) was close to the locations of human FEF reported in previous studies (Koyama et al., 2004; Paus, 1996).
Table 1 lists the Talairach coordinates (center of mass) for the regions defined by the contrast of Attend-cue-only trials versus Interpret-cue-only trials. The time courses for the Attend-cue-only and Interpret-cue-only trials in these regions are plotted in Figure 2. Generally, the distribution of the cue-related fronto-parietal activation for auditory spatial attentional orienting was somewhat more superior and medial than that observed in our analogous study in the visual modality (Woldorff et al., 2004), as indicated by the comparison in Table 2.
Table 1. Center of mass Talairach coordinates for areas involved in auditory spatial orienting (Attend-cues vs. Interpret-cues).
| Talairach Coord. |
||||
|---|---|---|---|---|
| ROIs | X | Y | Z | BA |
| Frontal Lobe | ||||
| R superior frontal gyrus | 10 | 8 | 67 | 6 |
| L superior frontal gyrus | −7 | 4 | 67 | 6 |
| R medial frontal gyrus | 9 | 14 | 53 | 6 |
| L medial frontal gyrus | −6 | 11 | 54 | 6 |
| R middle frontal gyrus | 46 | 15 | 33 | 9 |
| L middle frontal gyrus | −27 | −1 | 46 | 6 |
| R inferior frontal gyrus | 36 | 25 | −10 | 47 |
| L inferior frontal gyrus | −27 | 27 | −8 | 47 |
| Parietal Lobe | ||||
| R superior parietal lobe (precuneus) | 8 | −62 | 55 | 7 |
| L superior parietal lobe (precuneus) | −11 | −63 | 62 | 7 |
| R inferior parietal lobe | 54 | −47 | 48 | 40 |
| Temporal Lobe | ||||
| L superior temporal gyrus | −61 | −37 | 17 | 22 |
| Occipital Lobe | ||||
| R Cuneus | 10 | −88 | 14 | 18 |
| L Cuneus | −9 | −89 | 13 | 18 |
| R Lingual Gyrus | 8 | −97 | 4 | 17 |
| L Lingual Gyrus | −13 | −98 | 5 | 18 |
| Other Cortical Areas | ||||
| R Anterior Cingulate Cortex | 9 | 26 | 31 | 32 |
| L Anterior Cingulate Cortex | −6 | 21 | 31 | 32 |
| R Middle Cingulate Cortex (CC) | 7 | −17 | 29 | 23 |
| L Middle Cingulate Cortex (CC) | −4 | −17 | 29 | 23 |
| R Anterior Insula | 37 | 23 | −1 | 47 |
| L Anterior Insula | −29 | 26 | 0 | 13 |
| Subcortial areas | ||||
| R Putaman/Caudate | 15 | 8 | 1 | |
| L Putaman/Caudate | −14 | 8 | 0 | |
| R Thalamus | 13 | −13 | 10 | |
| L Thalamus | −11 | −17 | 10 | |
Note. BA = Broadman Area; CC= Corpus Callosum
Table 2. Talairach coordinates of fronto-parietal activation reported in the present auditory study and in the corresponding visual study (Woldorff et al., 2004).
| Brain Regions | The auditory study | The visual study | ||||
|---|---|---|---|---|---|---|
| X | Y | Z | X | Y | Z | |
| Frontal Lobe | −7 | −4 | 67 | −23 | −4 | 46 |
| 10 | 8 | 67 | 27 | 1 | 46 | |
| −6 | 11 | 54 | ||||
| 9 | 14 | 53 | ||||
| Parietal Lobe | −11 | −63 | 62 | −18 | −58 | 48 |
| 8 | −62 | 55 | 20 | −57 | 50 | |
The auditory cortices also showed robust bilateral activations in both the Attend-cue-only and Interpret-cue-only trials, presumably due, at least in part, to the auditory presentation of the cue stimuli (Figs. 2a & 2b). Directly contrasting Attend-cue-only with Interpret-cue-only trials in a voxel-wise analysis revealed significant differential activity in a small region of the left superior temporal cortex (Fig 1c, Z = 15 mm), an effect which may reflect anticipatory attentional biasing in the auditory cortex, analogous to cue-related biasing activity that has been reported in the visual modality (Hopfinger et al., 2000; Kastner et al., 1999; Woldorff et al., 2004). The time courses from left superior temporal cortex illustrate greater peak activity for Attend-cue-only than for Interpret-cue-only trials (Fig 2b). Of importance, since stimulus intensity was equalized for all cue types, this difference is likely to have arisen from differences in attention associated with these two cue types, rather than from physical differences between these two cue types.
Interestingly, even though the experiment was conducted entirely within the auditory modality, Attend-cue-only and Attend-cue-plus-target trials (but not Interpret-cue-only trials) activated several areas bilaterally that are normally involved in visual processing, including the cuneus and lingual gyri in both hemispheres (Fig 1b–d; Table 1). Furthermore, in these regions Attend-cue-only trials evoked greater peak amplitude and a larger post-peak undershoot than did Interpret-cue-only trials (Figure 2b; see Discussion).
2.2.2. Target-related activity
The contrast between Attend-cue-plus-target and Attend-cue-only trials isolated brain areas mainly involved in target-related processing, including the planning and execution of motor responses. As illustrated in Figure 1d, the left precentral gyrus (primary motor cortex) and postcentral gyrus (primary somatosensory cortex) were strongly activated, as expected, in that participants were pressing the target-detection response button with the right hand (see Methods). In addition, the right inferior parietal lobe showed greater activation for Attend-cue-plus-target trials compared to Attend-cue-only trials, which may indicate a role for this region in localizing the target sound (Alain et al., 2001; Bushara et al., 1999; Zatorre et al., 2002).
2.2.3. Attentional-biasing effects in the auditory cortex
Current neurological models posit that attention facilitates target detection by increasing baseline activity in target-specific regions of the relevant sensory cortex (Driver and Frith, 2000). Our voxel-wise findings described above, which indicated that Attend-cue-only trials activated the auditory cortex more than Interpret-cue-only trials, provide additional support for this view. To further explore this hypothesis, we investigated whether any contralateral effects of cue-triggered spatial orienting processes were present in target-specific auditory cortical regions. Although the contralaterality of activity in the auditory modality is generally substantially weaker than in the visual modality (Woldorff et al., 1999), we reasoned that any relative contralaterality of cue-triggered pretarget effects in auditory sensory cortex would provide additional evidence that attention facilitates target detection by increasing baseline activity in target-specific regions of the sensory cortex.
To investigate our hypothesis, we performed ROI analyses in regions of the left and the right auditory cortex that were defined by being selectively activated by our auditory target stimuli. In particular, to define these ROIs we performed a one-way repeated measure ANOVA (with time as a factor) on the average response to auditory target stimuli (see Methods). Using regions showing target-related activation in the left and right auditory cortices as ROIs (see Methods), we assessed whether there was a significant interaction between Type of Attend-cue-only Trial (left-cue-only vs. right-cue-only) and Hemisphere (left vs. right). Consistent with a contralateral shift of spatial attention, a significant interaction was observed in this analysis (F(1,12) = 7.12, p < 0.025) whose nature is illustrated in Figure 3. Specifically, while in both regions the peak amplitude for Right-cue-only trials was greater than that for Left-cue-only trials, this effect was significantly larger in the left than in the right auditory cortex. This interaction effect is highly consistent with models in which cue-triggered spatial orienting processes enhance activity in spatially-specific sensory cortices prior to target presentation (Hopfinger et al., 2000; Kastner et al., 1999; Luck et al., 1997; Woldorff et al., 2004), and consistent with views that such enhancements facilitate subsequent target processing (Giesbrecht et al., 2006).
Figure 3. Cue-triggered activity within the left and right auditory cortices.
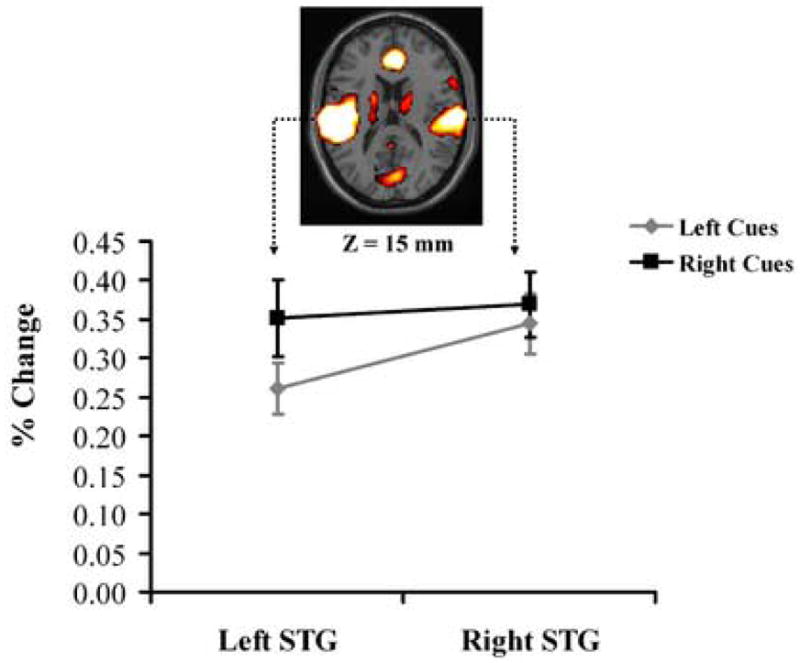
Plotted is the difference in peak amplitude (percent change of BOLD response) between responses to right and left Attend-cue-only trials within the left and right auditory cortices (i.e., superior temporal gyrus). One sample slice (Z = 15mm) of the brain activation is shown to indicate the ROIs being drawn. The relative contralaterality of the cue response in auditory cortex was reflected in a significant interaction in an ANOVA (F(1,12) = 7.12, p < 0.025). Note. STG = superior temporal gyrus
2.2.4. Exploratory Cross-study comparison
Finally, we performed an exploratory conjunction analysis in order to probe which brain areas were involved in spatial orienting regardless of the sensory modality in which attention was deployed (i.e., supramodal areas). This analysis determined which voxels were activated by the Attend-cue-only versus Interpret-cue-only contrast in both the present auditory attention experiment and in the closely analogous visual attention experiment of Woldorff et al. (2004). As shown in Figure 4a (see also Table 3), several brain areas (indicated in yellow) were activated by orienting spatial attention in both modalities. These areas included the ACC, the FEF, the SPL and the anterior insula. Figure 4b plots the time courses for Attend-cue-only and Interpret-cue-only trials in these supramodal regions. As illustrated, all four of these supramodal regions showed larger hemodynamic responses for Attend-cues than for Interpret-cues in both the auditory and the visual attention studies.
Figure 4. Conjunction analysis revealing areas involved in spatial orienting in both the visual and the auditory modalities.
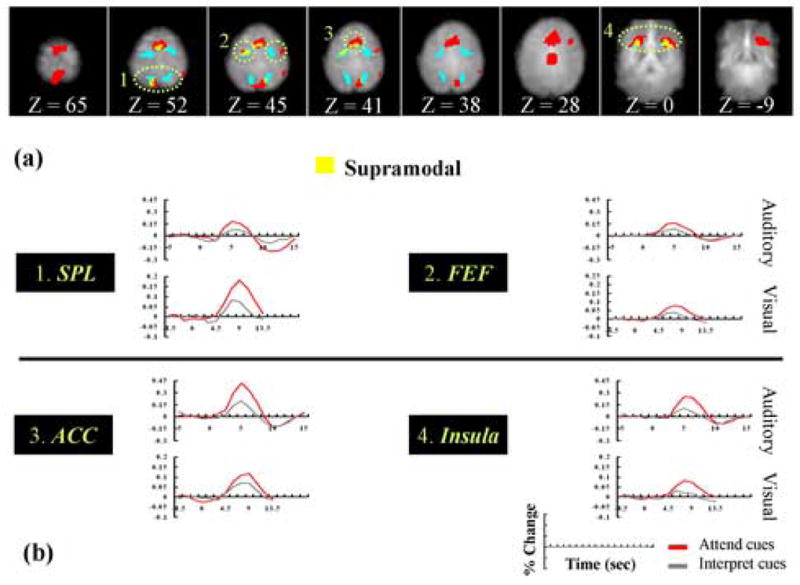
(A) Auditory-study ROIs (red), visual-study ROIs (blue) and conjunction (yellow) brain areas (supramodal regions) are indicated. The numbered light green dot-circled regions in the figure refer to 1, the superior parietal lobe, 2, the frontal eye fields, 3 the anterior cingulate cortex, and 4, the anterior insula. (B) Plots of fMRI responses in supramodal areas. Each plot depicts the average BOLD response (in units of percentage change from the corresponding baseline) across time for Attend-cue-only (red) and Interpret-cue-only (gray) trials. These responses are shown in areas that were supramodal (yellow) including the superior parietal lobe, the frontal eye fields, the anterior cingulate cortex, and the anterior insula. Note that the responses from the visual and auditory studies are plotted on different scales, due to differences in the magnetic field strength used in the two studies (i.e., 1.5 T versus 4 T, respectively).
Table 3. Talairach coordinates of the center of mass of supramodal brain regions.
| Supramodal |
|||||
|---|---|---|---|---|---|
| Brain Regions | Side | Talairach Coordinates | BA | ||
| MFG (FEF) | R | # | |||
| L | −26 | −2 | 45 | 6 | |
| Precuneus (SPL) | R | 16 | −63 | 47 | 7 |
| L | −15 | −65 | 59 | 7 | |
| ACC | R | 6 | 14 | 44 | 6 |
| L | −5 | 12 | 44 | 32 | |
| Insula | R | 35 | 21 | −1 | 13 |
| L | −30 | 23 | 0 | 13 | |
Note. BA = Broadman Area
= regions that contains less than 5 voxel
SPL = superior parietal lobe; MFG = middle frontal gyrus; FEF= frontal eye field;
ACC=anterior cingulate cortex
3. Discussions
In the present study, we have identified the brain regions underlying endogenous orienting of spatial attention in the auditory modality. These regions include the superior, medial, and inferior frontal gyri in the prefrontal cortex, the FEF, the ACC, the middle cingulate cortex (MCC), the SPL, bilateral anterior insula and bilateral putamen/caudate nuclei. Data from previous visual attention studies have suggested that: (1) the prefrontal cortex keeps track of task goals and biases the processing of posterior systems in favor of goal-relevant stimuli and responses (Miller, 2000; Miller and Cohen, 2001), (2) the ACC plays a critical role in the control of attention (Hopfinger et al., 2000; Thiel et al., 2004; Woldorff et al., 2004), (3) the human FEF as being involved in the planning of both covert and overt attentional orienting (Corbetta et al., 1998; Hopfinger et al., 2000; Kastner et al., 1999; Kim et al., 1999; LaBar et al., 1999; Nobre et al., 2000; Peelen et al., 2004; Rizzolatti et al., 1987; Woldorff et al., 2004) and (4) the SPL enhances activity within sensory cortices that process task-relevant stimuli (Behrmann et al., 2004; Corbetta et al., 1993; Corbetta et al., 1995; Yantis and Serences, 2003). Furthermore, the SPL activation in the present study is anatomically very close to the SPL activation in another study (Shomstein and Yantis, 2006) on auditory spatial attention. The present findings therefore appear to generalize the roles these brain regions play in controlling spatial attention to the auditory modality.
The present findings contribute to the existing literature on auditory spatial attention in several important ways. First, using binaurally presented instruction cues allowed us to investigate “the endogenous” control of auditory spatial attention, in the absence of lateralized “exogenous” components that are present when using monaurally presented tones as cue stimuli (Mayer et al., 2006). For example, Mayer et al (2006) used lateralized monaural tones as cue stimuli and found fronto-parietal network activations that were more inferior to those in the present study. Some of these relatively inferior activations may have reflected the recruitment of exogenous attentional mechanisms (Corbetta and Shulman, 2002). Second, including cue-only trials in our event-related design allowed us to clearly distinguish brain activity triggered by the instructional cues from activity associated with auditory target processing, which was not possible in some previous studies that used block designs (Tzourio et al., 1997). Third, by including Interpret-cue trials in the design to control for general cue-processing activity (e.g., analysis of the sensory content of the cues and the decoding of their instructional meaning), we were able to identify the entire network that supports orienting auditory spatial attention, rather than just those regions that are involved in shifting vs. maintaining auditory spatial attention (Shomstein and Yantis, 2006). The present findings therefore add to our understanding of the functional neuroanatomy of auditory spatial attention in several important ways.
In addition to activating the fronto-parietal network, cue-triggered orienting of auditory spatial attention led to increased activity in the auditory cortex, even on trials in which no targets were presented. First, Attend-cue-only trials produced greater activity than Interpret-cue-only trials in the auditory cortices. Second, the cue-triggered activation enhancements in the left and right auditory cortex were differentially sensitive to the direction (left or right) in which spatial attention was deployed. These pretarget enhancements of baseline activity may be similar to those observed in the visual cortices during studies of visual attention (Hopfinger et al., 2000; Kastner et al., 1999; Luck et al., 1997; Woldorff et al., 2004). In the visual modality, increases in baseline activity are thought to reflect attentional processes that prepare the system to process an upcoming visual stimulus at the attended visual field location (Driver and Frith, 2000). Furthermore, such effects are usually observed contralateral to the attended visual field due to the contralateral organization of the visual system. Note that the pattern of cue-triggered effects in the auditory cortices in the present study, in which Right cues showed greater activity than the Left cues in both the left and right STG, is somewhat different from that observed in the visual cortices in prior visual attention studies (Hopfinger et al., 2000; Kastner et al., 1999; Luck et al., 1997; Woldorff et al., 2004). One possible explanation for this asymmetrical pattern may be the marginal difference in target detection rates between left targets (82%) and right targets (72%), reflecting an imbalance of subjects’ preparation when attending to the left vs. right ears. However, the significant interaction that we observed between direction of attention and hemisphere, which occurred because the difference between Right cues and the Left cues was larger in the left STG than in the right STG, indicated the presence of at least some relative contralaterality of the effects of the attentional orienting. The present findings in the auditory cortex therefore fit well with models in which cue-triggered attentional processes facilitate the detection of upcoming targets by increasing baseline activity in target-specific sensory cortices (Giesbrecht et al., 2006; Hopfinger et al., 2000; Kastner et al., 1999; Luck et al., 1997; Woldorff et al., 2004).
Interestingly, cue-triggered orienting of auditory spatial attention also led to increased activity bilaterally in the cuneus and in lingual gyrus, which are generally viewed as being visual processing areas (Figure 2b). This result was surprising not only because the present study involved auditory attention, but also because subjects were instructed to keep their eyes closed and still throughout the entire experiment, which should have minimized activations in visual areas. One possible explanation is that auditory Attend-cues elicit orienting-related baseline increases in activity (Driver and Frith, 2000) in both the auditory and visual cortices. However, the visual activations failed to show contralateral patterns of activity corresponding to the attended locations (in contrast to the effects seen in prior visual spatial attention studies and in the auditory cortices in the present study), reducing the likelihood that they indexed spatially-specific orienting processes. A second possibility is suggested by neuroanatomical and neurophysiological studies, which have revealed that the striate cortex receives neuronal projections from auditory cortices, which may facilitate multimodal integration (Clavagnier et al., 2004; Falchier et al., 2002; Rockland and Ojima, 2003; Schroeder and Foxe, 2005). We speculate that these anatomically early connections might allow attentional modulations of sensory activity in one modality to “spread” to sensory cortices in a second modality under certain conditions (Busse et al., 2005). Additional studies are clearly needed to determine the precise nature of the cross-modal attentional effects that we have observed here.
Finally, our exploratory cross-study comparison suggests that at least four brain regions, including the anterior insula, the ACC, the FEF and the SPL, may be involved in orienting both auditory and visual spatial attention. The existence of supramodal regions for orienting attention fits nicely with the existing literature on spatial attentional orienting. First, patients with insula lesions, especially in the right insula, sometimes suffer from neglect syndromes in both the visual modality (Manes et al., 1999) and the auditory modality (Bellmann et al., 2001; Manes et al., 1999). Second, previous studies have implicated the ACC in both visual (Hopfinger et al., 2000; Thiel et al., 2004; Weissman et al., 2002; Woldorff et al., 2004) and auditory attention (Benedict et al., 2002; Tzourio et al., 1997). Third, neurons in the FEF exhibit presaccadic firing under both visually-guided and aurally-guided conditions (Russo and Bruce, 1994). Fourth, subregions within the superior parietal cortex have been implicated in orienting attentional (Macaluso et al., 2003a; Macaluso et al., 2003b) and in switching the focus of attention (Shomstein and Yantis, 2004) across several different sensory modalities. Of course, in the absence of a within-subjects experimental design, we cannot draw firm conclusions about the existence of either supramodal or modality-specific brain regions underlying the control of spatial attention. Future studies will therefore be necessary to further explore these possibilities. We note, however, that findings indicating that certain computations underlying the control of spatial attention are modality-specific would fit with proposals of domain specificity in the human brain that have been posited for a variety of higher-level cognitive functions, including working memory (Levy and Goldman-Rakic, 2000) and high-level visual processing (McCarthy et al., 1997).
In conclusion, the present study has identified the network of brain regions that underlies endogenous spatial orienting of attention in the auditory modality. This network appears to be similar to the network that underlies endogenous orienting of visual spatial attention in two important ways. First, it appears to rely upon some of the same control regions in frontal and parietal cortices. Second, it appears to produce pre-target biasing activity in sensory regions that are contralateral to the direction in which spatial attention is oriented. Future studies employing within-subjects designs will be crucial for more precisely identifying which neural mechanisms underlying spatial attention are supramodal and which are modality-specific.
4. Experimental Procedures
4.1. Participants
Twenty-two participants participated in the experiment (6 females and 16 males, 18 right-handed and 4 left handed, ages 20–41 years, mean age: 24 years). Data from four participants were discarded due to excessive head movement (> 3 mm in any of the x, y, or z dimensions). Data were also discarded from another five participants due to low target detection rate in any condition (lower than 50%). Thus, thirteen subjects (5 females and 8 males; mean age of 23 years; 3 left handed) were included in the final analyses. All participants were recruited through local advertisements at Duke University and were paid $20 per hour for their participation. Informed consent was obtained from each participant according to the standards of the Duke University Institutional Review Board.
4.2. Data Acquisition
Stimulus presentation was controlled by a personal computer running the Presentation software package (Neurobehavioral Systems, Inc., Albany, CA. USA). All experimental stimuli were presented completely within the auditory modality through a pair of MR-compatible headphones. Behavioral responses were recorded with an MR-compatible response box.
The functional imaging data were acquired on a 4T scanner (GE LX NVi system) in the Brain Imaging and Analysis Center at Duke University. Functional images were acquired using a T2* weighted inverse spiral pulse sequence (TR = 1.25s, TE = 30ms, flip angle = 60°). Twenty-eight interleaved axial slices (aligned parallel to the AC-PC line) were acquired with a 24 cm FOV, 64 × 64 matrix size (in-plane resolution of 3.75 mm × 3.75 mm), and a slice-thickness of 3.8 mm. For each participant, data from fourteen runs were collected. Each run contained 164 volumes (after discarding the first four scan volumes in which no trials were presented). Twenty-eight high-resolution structural images were acquired with the same positioning as the corresponding functional images. The structural images were acquired using a 3D oblique spoiled gradient (SPGR) pulse sequence with the following parameters: 24 cm FOV, 256 × 256 matrix size (0.975 mm × 0.975 mm in-plane resolution), and 3.8 mm slice thickness.
4.3. Task
The auditory spatial-attention cueing task (Figure 5) was constructed to be as closely analogous as possible to a visual spatial-attention cueing task used previously by Woldorff et al. (2004). Each trial begin with an auditory instructional cue, which was a binaurally presented human voice saying the word “Left,” “Right,” or “Past.” The “Left” and “Right” cues (Attend cues) instructed the subjects to attend very closely to the corresponding side of auditory space (i.e., to the ear on that side) and to press a button with their right index finger if they heard a faint target tone in the cued spatial location in the following time interval. The “Past” cues (Interpret cues) instructed the subjects not to orient attention on that trial, as there would be no target following the cue.
Figure 5. Timeline of cue and target presentation in each trial.
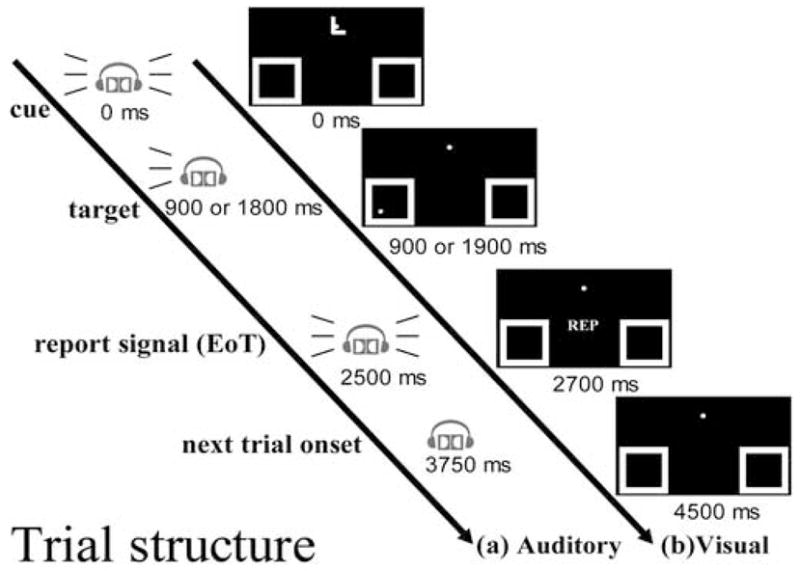
The structure of a trial in (a) the auditory spatial attention study and (b) the closely corresponding visual spatial attention study of Woldorff et al. (2004)
The Attend cues were followed by either (1) an early target (900 ms after cue onset), (2) a late target (1800 ms after cue onset), or (3) no target. The inclusion of both short and long cue-target stimulus onset asynchronies (SOAs) reduced the predictability of target onset, thereby encouraging participants to orient their auditory spatial attention quickly to the cued location and to maintain their attention at that location throughout the potential cue-target interval. Trials in which the cue was followed by a target will be referred to as “cue-plus-target trials” and trials in which no target followed the cue will be termed “cue-only trials.” In cue-plus-target trials, the target was always a monaural, relatively hard-to-detect, tone pip (1500Hz, 100 ms duration) presented at the designated side of auditory space (i.e., to the left or right ear) at one of two amplitude levels that were randomly chosen. The amplitude levels for the targets were determined for each participant using a pre-experimental procedure discussed below. On cue-plus-target trials, one-third of the cue-target SOAs were 900 ms intervals (early targets) and two-thirds were 1800 ms (late targets). Finally, toward the end of each trial (at 2500 ms post-cue-onset), a binaural “buzz” sound (i.e., a saw tooth wave) was presented signaling the end of the trial (EoT), at which time participants were to make their button-press response if they had heard a target. The delay of the behavioral response until the end of the trial was aimed at minimizing the degree to which response preparation processes became activated in response to the cue stimuli. To maintain consistency of sensory stimulation, all trial types had the EoT signal, always at 2500 ms post-cue-onset. The length of each trial was 3750 ms.
Half of the Attend-cue trials had a target following and half did not. A comparison of the brain activity evoked by the three cue-only trial types (i.e., those with no target following) allowed us to identify the neural mechanisms enabling cued orienting of auditory spatial attention. More specifically, since the Attend-cues required participants to interpret the meaning of the cue and orient their spatial attention, while Interpret-cues required participants only to interpret the meaning of the cue, we reasoned that a contrast between the fMRI responses evoked by these two trial types should reveal those brain regions specifically involved in the orienting of auditory spatial attention.
Of importance, other important parameters of the task were also specifically configured to ensure that our findings would be specific to auditory spatial attention. First, to minimize potential confounding effects from orienting attention in the visual modality, participants were instructed to keep their eyes closed and motionless throughout the experiment. Second, they were informed before the experiment that all targets would be valid (i.e., that targets, when they occurred, would always be presented on the cued side of auditory space). These procedures helped to ensure that any greater brain activity associated with Attend cue-only trials versus Interpret cue-only trials would largely reflect attentional orienting to the cued spatial location.
Two additional manipulations were employed to maintain high task difficulty levels throughout the experiment, thereby ensuring a full deployment of attentional resources during the orienting of auditory spatial attention. First, as mentioned above, the target stimuli were randomly presented at one of the two amplitude levels chosen before each run. Employing some variation of the intensity of the target stimuli on a trial-by-trial basis increased task difficulty by preventing the participants from preparing for a specific auditory stimulus. Second, the volume of the target stimuli presented on each side of auditory space was dynamically titrated (from run to run) for each individual participant, throughout the experimental session, such that the detection rate for auditory targets would stay well below ceiling (i.e., between 60% and 80%) for both the left and right sides of space. This procedure helped to ensure the need to invoke highly focused attention in order to perform the task. The target amplitude level for the first run was determined based on participants’ behavioral performance on a threshold-detection task before the start of the experiment. Behavioral performance was monitored on-line, and the detection rates for each run were used to adjust target amplitude in the next run. Note that, since the main goal was to have a task that required attention that was focused and sustained and that was similar for the attend-left and attend-right conditions, the amplitude levels for the left and right targets could differ somewhat if, for example, a participant had better auditory discrimination in one ear than in the other.
4.4. Design
Our design included four main trial types (Table 4): Attend-cue-plus-target trials (18%), Attend-cue-only trials (18%), Interpret-cue-only trials (18%), and an additional trial type called “No-stim” trials (46%). In No-stim trials, which were the same length as all the other trial types, no stimuli were presented. These trial types were included to facilitate the extraction of the event-related fMRI responses and the removal of overlapping responses from adjacent trials in the sequence (see below). The presentation order of the various trial types, including the No-stim trials, was randomized with first-order counterbalancing such that each trial type was preceded by all other trial types with equal probability.
Table 4. The hierarchy of trial types used in the present study.
(EoT = End of Trial)
| Trial Types | Trial structure |
|---|---|
| Attend-Cues + target | “Left”..............target beep…EoT signal |
| “Right”............target beep…EoT signal | |
| Attend-Cues only | “Left”..............................EoT signal |
| “Right”.............................EoT signal | |
| Interpret-Cues only | “Past”..............................EoT signal |
| No-stims | .................................................. |
4.5. Data Analysis
The fMRI analysis software program SPM ’99 (Friston et al., 1995) was used to perform the following image preprocessing steps: (1) correcting the timing difference across slices due to asynchronous slice acquisition, (2) correcting motion artifacts by realigning to the first functional image, (3) normalizing the functional images to the MNI (Montreal Neurological Institute) standard space, and (4) spatially smoothing the functional images using an 8 mm (full-width-half-maximum) Gaussian kernel in the x, y, and z dimensions. MNI coordinates were transformed into Talairach coordinates (Talairach and Tournoux, 1988) using a piecewise-linear transformation (http://www.mrc-cbu.cam.ac.uk/Imaging/Common/mnispace.shtml)
4.5.1. Voxel-wise Analyses
Using selective averaging techniques, we extracted the average response to each trial type at every voxel, time-locked to trial onset. We included four pre-trial time points and thirteen post-trial time points, which yielded event-related time courses from −5 to +16.25 sec, since our TR was 1.25 sec. The average responses for each trial type were subsequently converted into percent signal change relative to the average amplitude of the three time points preceding trial onset. Next, we subtracted the average response to the No-stim trial type from the average responses to each of the other trial types. Because of the first-order counterbalanced trial order, the overlap from adjacent trials that was present in the average response to each trial type was, on average, about the same for the No-stim trial type as for the other trial types. Thus, subtracting the average No-stim response from the average responses to each of the other trial types revealed the average, overlap-removed, hemodynamic response for each trial type (Buckner, 1998; Burock et al., 1998; Woldorff et al., 2004). These uncontaminated response estimates were used in all subsequent analyses.
Two types of voxel-wise analysis contrast were performed. First, a one-way repeated-measures analysis of variance (ANOVA) was performed to test whether the time course of the average event-related hemodynamic response (13 post-trial time points, 0 to 16.25 seconds) for each trial type was significantly different from a flat line (Shulman et al., 2001; Shulman et al., 2002). Second, we performed two-way repeated measures ANOVAs to test for interaction effects between trial type (e.g., Attend cue-only trials vs. Interpret cue-only trials) and time point (13 post-trial time points). In our analyses of target-related activity, we included only the Attend cue-plus-target trials with long cue-target SOAs because (1) their temporal structure was more similar to that of the cue-only trials and (2) there were considerably more trials with long than with short cue-target SOAs.
In general, the joint criteria of an uncorrected voxel-wise threshold of p<0.001 [F(12,144) > 3.0], and a cluster threshold of 15 or more contiguous activated voxels were used for controlling the false positive rate. These thresholds, based on 1000 Monte-Carlo simulations using the AlphaSim algorithm (http://afni.nimh.nih.gov/pub/dist/doc/manual/AlphaSim.pdf), were used for generating corrected functional activation F-maps (corrected p<0.05), thereby reducing the likelihood of false positives from noise (Xiong et al., 1995). The output F-images were superimposed on the SPM standard anatomical image using MRIcro software (http://www.sph.sc.edu/comd/rorden/mricro.html).
4.5.2. ROI analyses in auditory cortex
Two ROIs, one in the left and one in the right superior temporal gyrus (STG), were defined using a one-way repeated measure ANOVA (with time as a factor) that assessed average target-related activity. Average target activity was defined as the difference in activity between Attend-cue-plus-target trials and Attend-cue-only trials. Each ROI was manually drawn according to the Talairach Atlas (Talairach and Tournoux, 1988) around the superior temporal gyrus which showed target-related activation in either the left or the right hemisphere auditory cortex. To test for pretarget biasing activity in the auditory cortex, we calculated for each of these ROIs (left STG: 361 voxels, right STG: 251 voxels) the peak amplitude of the response (two time points, 3.75~5 seconds after stimulus onset) to Left-cue-only and Right-cue-only trials across subjects. We then evaluated whether there was pretarget preparatory enhancement of activity in these areas by assessing whether there was a significant interaction between Type of Attend-cue-only trial (Left-cue-only vs. Right-cue-only) and Hemisphere (the Left STG vs. the Right STG) in these ROIs. Note that these ROI analyses of cue-related activity were unbiased since the ROIs were defined using an orthogonally derived analysis of target-related activity.
4.5.3. Exploratory Cross-study comparison
A conjunction analysis using data from both the present auditory cuing study and our analogous study in the visual modality (Woldorff et al., 2004) was employed to explore which brain areas were involved in orienting spatial attention in both the auditory and the visual modalities. Specifically, we compared the voxels that were activated more for Attend-cue-only trials than for Interpret-cue-only trials in the present auditory experiment with those in our previous visual experiment (Woldorff et al., 2004). Although the functional images in both studies were normalized to MNI space with SPM99, there were slight differences between the voxel sizes used in these studies (42×51×23 in the visual study [57] versus 42×51×37 in the present auditory study). Therefore, before performing the conjunction analysis, we transformed the activation map from the visual study (42×51×23) into the image space of the auditory study (42×51×37) using an SPM linear interpolation function. Once the two maps were in the same space, we delineated activated voxels that belonged to the visual study only, the auditory study only, and to both studies. We reasoned that voxels activated in both studies would likely reflect supramodal control areas. Furthermore, we required that supramodal control areas identified by the conjunction analysis contain at least 5 voxels.
Also relevant for interpreting the results of our conjunction analysis, 20 healthy subjects (7 females and males, mean age of 27 years) participated in our previous visual attention study [57]. None of these subjects participated in the present auditory attention study. The images were acquired using a GE 1.5-T Signa LX MRI system at the Brain Imaging and Analysis Center at Duke University with the following parameters: 18 T2*-weighted, echo-planar image slices, each 5 mm thick, TR = 1.5 sec, TE = 40 msec, flip angle = 90°, in-plane resolution of 64 × 64 (3.75 mm × 3.75 mm), and FOV = 24 cm (for more details, see Woldorff et al., 2004).
Acknowledgments
This study was supported by NIH grant R01-MH64015 to M.G.W. and by a postdoctoral National Research Service Award (1 F32 NS41867-01) to D.H.W. We thank Tineke Grent-‘t-Jong, Karen Meyerhoff and Andrew Perkins for their useful discussions and proof-reading.
Footnotes
Publisher's Disclaimer: This is a PDF file of an unedited manuscript that has been accepted for publication. As a service to our customers we are providing this early version of the manuscript. The manuscript will undergo copyediting, typesetting, and review of the resulting proof before it is published in its final citable form. Please note that during the production process errors may be discovered which could affect the content, and all legal disclaimers that apply to the journal pertain.
References
- Alain C, Arnott SR, Hevenor S, Graham S, Grady CL. “What” and “where” in the human auditory system. Proc Natl Acad Sci USA. 2001;98:12301–12306. doi: 10.1073/pnas.211209098. [DOI] [PMC free article] [PubMed] [Google Scholar]
- Arnell KM, Larson JM. Cross-modality attentional blinks without preparatory task-set switching. Psychon Bull Rev. 2002;9:497–506. doi: 10.3758/bf03196305. [DOI] [PubMed] [Google Scholar]
- Behrmann M, Geng JJ, Shomstein S. Parietal cortex and attention. Curr Opin Neurobiol. 2004;14:212–217. doi: 10.1016/j.conb.2004.03.012. [DOI] [PubMed] [Google Scholar]
- Bellmann A, Meuli R, Clarke S. Two types of auditory neglect. Brain. 2001;124:676–687. doi: 10.1093/brain/124.4.676. [DOI] [PubMed] [Google Scholar]
- Benedict RH, Shucard DW, Santa Maria MP, Shucard JL, Abara JP, Coad ML, Wack D, Sawusch J, Lockwood A. Covert auditory attention generates activation in the rostral/dorsal anterior cingulate cortex. J Cogn Neurosci. 2002;14:637–645. doi: 10.1162/08989290260045765. [DOI] [PubMed] [Google Scholar]
- Bisiach E, Cornacchia L, Sterzi R, Vallar G. Disorders of perceived auditory lateralization after lesions of the right hemisphere. Brain. 1984;107 (Pt 1):37–52. doi: 10.1093/brain/107.1.37. [DOI] [PubMed] [Google Scholar]
- Buckner RL. Event-related fMRI and the hemodynamic response. Hum Brain Mapp. 1998;6:373–377. doi: 10.1002/(SICI)1097-0193(1998)6:5/6<373::AID-HBM8>3.0.CO;2-P. [DOI] [PMC free article] [PubMed] [Google Scholar]
- Burock MA, Buckner RL, Woldorff MG, Rosen BR, Dale AM. Randomized event-related experimental designs allow for extremely rapid presentation rates using functional MRI. Neuroreport. 1998;9:3735–3739. doi: 10.1097/00001756-199811160-00030. [DOI] [PubMed] [Google Scholar]
- Bushara KO, Weeks RA, Ishii K, Catalan MJ, Tian B, Rauschecker JP, Hallett M. Modality-specific frontal and parietal areas for auditory and visual spatial localization in humans. Nat Neurosci. 1999;2:759–766. doi: 10.1038/11239. [DOI] [PubMed] [Google Scholar]
- Busse L, Roberts KC, Crist RE, Weissman DH, Woldorff MG. The spread of attention across modalities and space in a multisensory object. Proc Natl Acad Sci USA. 2005;102:18751–18756. doi: 10.1073/pnas.0507704102. [DOI] [PMC free article] [PubMed] [Google Scholar]
- Clavagnier S, Falchier A, Kennedy H. Long-distance feedback projections to area V1: implications for multisensory integration, spatial awareness, and visual consciousness. Cogn Affect Behav Neurosci. 2004;4:117–126. doi: 10.3758/cabn.4.2.117. [DOI] [PubMed] [Google Scholar]
- Corbetta M, Akbudak E, Conturo TE, Snyder AZ, Ollinger JM, Drury HA, Linenweber MR, Petersen SE, Raichle ME, Van E, Shulman GL. A common network of functional areas for attention and eye movements. Neuron. 1998;21:761–773. doi: 10.1016/s0896-6273(00)80593-0. [DOI] [PubMed] [Google Scholar]
- Corbetta M, Miezin FM, Shulman GL, Petersen SE. A PET study of visuospatial attention. J Neurosci. 1993;13:1202–1226. doi: 10.1523/JNEUROSCI.13-03-01202.1993. [DOI] [PMC free article] [PubMed] [Google Scholar]
- Corbetta M, Shulman GL. Control of goal-directed and stimulus-driven attention in the brain. Nat Rev Neurosci. 2002;3:201–215. doi: 10.1038/nrn755. [DOI] [PubMed] [Google Scholar]
- Corbetta M, Shulman GL, Miezin FM, Petersen SE. Superior parietal cortex activation during spatial attention shifts and visual feature conjunction. Science. 1995;270:802–805. doi: 10.1126/science.270.5237.802. [DOI] [PubMed] [Google Scholar]
- Driver J, Frith C. Shifting baselines in attention research. Nat Rev Neurosci. 2000;1:147–148. doi: 10.1038/35039083. [DOI] [PubMed] [Google Scholar]
- Duncan J, Martens S, Ward R. Restricted attentional capacity within but not between sensory modalities. Nature. 1997;387:808–810. doi: 10.1038/42947. [DOI] [PubMed] [Google Scholar]
- Falchier A, Clavagnier S, Barone P, Kennedy H. Anatomical evidence of multimodal integration in primate striate cortex. J Neurosci. 2002;22:5749–5759. doi: 10.1523/JNEUROSCI.22-13-05749.2002. [DOI] [PMC free article] [PubMed] [Google Scholar]
- Friston KJ, Holmes AP, Poline JB, Grasby PJ, Williams SCR, Frackowiak RSJ, Turner R. Analysis of Fmri Time-Series Revisited. Neuroimage. 1995;2:45–53. doi: 10.1006/nimg.1995.1007. [DOI] [PubMed] [Google Scholar]
- Giesbrecht B, Weissman DH, Woldorff MG, Mangun GR. Pre-target activity in visual cortex predicts behavioral performance on spatial and feature attention tasks. Brain Res. 2006;1080:63–72. doi: 10.1016/j.brainres.2005.09.068. [DOI] [PubMed] [Google Scholar]
- Hillyard SA, Anllo-Vento L. Event-related brain potentials in the study of visual selective attention. Proc Natl Acad Sci USA. 1998;95:781–787. doi: 10.1073/pnas.95.3.781. [DOI] [PMC free article] [PubMed] [Google Scholar]
- Hopfinger JB, Buonocore MH, Mangun GR. The neural mechanisms of top-down attentional control. Nat Neurosci. 2000;3:284–291. doi: 10.1038/72999. [DOI] [PubMed] [Google Scholar]
- Kanwisher N, Wojciulik E. Visual attention: insights from brain imaging. Nat Rev Neurosci. 2000;1:91–100. doi: 10.1038/35039043. [DOI] [PubMed] [Google Scholar]
- Kastner S, Pinsk MA, De Weerd P, Desimone R, Ungerleider LG. Increased activity in human visual cortex during directed attention in the absence of visual stimulation. Neuron. 1999;22:751–761. doi: 10.1016/s0896-6273(00)80734-5. [DOI] [PubMed] [Google Scholar]
- Kim YH, Gitelman DR, Nobre AC, Parrish TB, LaBar KS, Mesulam MM. The large-scale neural network for spatial attention displays multifunctional overlap but differential asymmetry. Neuroimage. 1999;9:269–277. doi: 10.1006/nimg.1999.0408. [DOI] [PubMed] [Google Scholar]
- Koyama M, Hasegawa I, Osada T, Adachi Y, Nakahara K, Miyashita Y. Functional magnetic resonance imaging of macaque monkeys performing visually guided saccade tasks: comparison of cortical eye fields with humans. Neuron. 2004;41:795–807. doi: 10.1016/s0896-6273(04)00047-9. [DOI] [PubMed] [Google Scholar]
- LaBar KS, Gitelman DR, Parrish TB, Mesulam M. Neuroanatomic overlap of working memory and spatial attention networks: a functional MRI comparison within subjects. Neuroimage. 1999;10:695–704. doi: 10.1006/nimg.1999.0503. [DOI] [PubMed] [Google Scholar]
- Levy R, Goldman-Rakic PS. Segregation of working memory functions within the dorsolateral prefrontal cortex. Exp Brain Res. 2000;133:23–32. doi: 10.1007/s002210000397. [DOI] [PubMed] [Google Scholar]
- Luck SJ, Chelazzi L, Hillyard SA, Desimone R. Neural mechanisms of spatial selective attention in areas V1, V2, and V4 of macaque visual cortex 16. J Neurophysiol. 1997;77:24–42. doi: 10.1152/jn.1997.77.1.24. [DOI] [PubMed] [Google Scholar]
- Macaluso E, Driver J, Frith CD. Multimodal spatial representations engaged in human parietal cortex during both saccadic and manual spatial orienting. Current Biology. 2003a;13:990–999. doi: 10.1016/s0960-9822(03)00377-4. [DOI] [PubMed] [Google Scholar]
- Macaluso E, Eimer M, Frith CD, Driver J. Preparatory states in crossmodal spatial attention: spatial specificity and possible control mechanisms. Exp Brain Res. 2003b;149:62–74. doi: 10.1007/s00221-002-1335-y. [DOI] [PubMed] [Google Scholar]
- Macaluso E, Frith CD, Driver J. Modulation of human visual cortex by crossmodal spatial attention. Science. 2000;289:1206–1208. doi: 10.1126/science.289.5482.1206. [DOI] [PubMed] [Google Scholar]
- Manes F, Paradiso S, Springer JA, Lamberty G, Robinson RG. Neglect after right insular cortex infarction. Stroke. 1999;30:946–948. doi: 10.1161/01.str.30.5.946. [DOI] [PubMed] [Google Scholar]
- Mayer AR, Harrington D, Adair JC, Lee R. The neural networks underlying endogenous auditory covert orienting and reorienting. Neuroimage. 2006;30:938–949. doi: 10.1016/j.neuroimage.2005.10.050. [DOI] [PubMed] [Google Scholar]
- McCarthy G, Puce A, Gore JC, Allison T. Face-specific processing in the human fusiform gyrus. Journal of Cognitive Neuroscience. 1997;9:605–610. doi: 10.1162/jocn.1997.9.5.605. [DOI] [PubMed] [Google Scholar]
- Mesulam MM. Spatial attention and neglect: parietal, frontal and cingulate contributions to the mental representation and attentional targeting of salient extrapersonal events. Philosophical Transactions of the Royal Society of London Series B-Biological Sciences. 1999;354:1325–1346. doi: 10.1098/rstb.1999.0482. [DOI] [PMC free article] [PubMed] [Google Scholar]
- Miller EK. The prefrontal cortex and cognitive control. Nat Rev Neurosci. 2000;1:59–65. doi: 10.1038/35036228. [DOI] [PubMed] [Google Scholar]
- Miller EK, Cohen JD. An integrative theory of prefrontal cortex function. Annu Rev Neurosci. 2001;24:167–202. doi: 10.1146/annurev.neuro.24.1.167. [DOI] [PubMed] [Google Scholar]
- Nobre AC, Gitelman DR, Dias EC, Mesulam MM. Covert visual spatial orienting and saccades: overlapping neural systems. Neuroimage. 2000;11:210–216. doi: 10.1006/nimg.2000.0539. [DOI] [PubMed] [Google Scholar]
- Paus T. Location and function of the human frontal eye-field: a selective review. Neuropsychologia. 1996;34:475–483. doi: 10.1016/0028-3932(95)00134-4. [DOI] [PubMed] [Google Scholar]
- Pavani F, Ladavas E, Driver J. Auditory and multisensory aspects of visuospatial neglect. Trends Cogn Sci. 2003;7:407–414. doi: 10.1016/s1364-6613(03)00189-x. [DOI] [PubMed] [Google Scholar]
- Peelen MV, Heslenfeld DJ, Theeuwes J. Endogenous and exogenous attention shifts are mediated by the same large-scale neural network. Neuroimage. 2004;22:822–830. doi: 10.1016/j.neuroimage.2004.01.044. [DOI] [PubMed] [Google Scholar]
- Rizzolatti G, Riggio L, Dascola I, Umilta C. Reorienting attention across the horizontal and vertical meridians: evidence in favor of a premotor theory of attention. Neuropsychologia. 1987;25:31–40. doi: 10.1016/0028-3932(87)90041-8. [DOI] [PubMed] [Google Scholar]
- Rockland KS, Ojima H. Multisensory convergence in calcarine visual areas in macaque monkey. Int J Psychophysiol. 2003;50:19–26. doi: 10.1016/s0167-8760(03)00121-1. [DOI] [PubMed] [Google Scholar]
- Russo GS, Bruce CJ. Frontal eye field activity preceding aurally guided saccades. J Neurophysiol. 1994;71:1250–1253. doi: 10.1152/jn.1994.71.3.1250. [DOI] [PubMed] [Google Scholar]
- Schroeder CE, Foxe J. Multisensory contributions to low-level, ‘unisensory’ processing. Curr Opin Neurobiol. 2005;15:454–458. doi: 10.1016/j.conb.2005.06.008. [DOI] [PubMed] [Google Scholar]
- Shomstein S, Yantis S. Control of attention shifts between vision and audition in human cortex. J Neurosci. 2004;24:10702–10706. doi: 10.1523/JNEUROSCI.2939-04.2004. [DOI] [PMC free article] [PubMed] [Google Scholar]
- Shomstein S, Yantis S. Parietal cortex mediates voluntary control of spatial and nonspatial auditory attention. J Neurosci. 2006;26:435–439. doi: 10.1523/JNEUROSCI.4408-05.2006. [DOI] [PMC free article] [PubMed] [Google Scholar]
- Shulman GL, Ollinger JM, Linenweber M, Petersen SE, Corbetta M. Multiple neural correlates of detection in the human brain. Proc Natl Acad Sci USA. 2001;98:313–318. doi: 10.1073/pnas.021381198. [DOI] [PMC free article] [PubMed] [Google Scholar]
- Shulman GL, Tansy AP, Kincade M, Petersen SE, McAvoy MP, Corbetta M. Reactivation of networks involved in preparatory states. Cereb Cortex. 2002;12:590–600. doi: 10.1093/cercor/12.6.590. [DOI] [PubMed] [Google Scholar]
- Soto-Faraco S, Spence C. Modality-specific auditory and visual temporal processing deficits. Q J Exp Psychol A. 2002;55:23–40. doi: 10.1080/02724980143000136. [DOI] [PubMed] [Google Scholar]
- Talairach J, Tournoux P. Co-planar stereotaxic atlas of the human brain. Thieme; Stuttgart: 1988. [Google Scholar]
- Talsma D, Kok A. Intermodal spatial attention differs between vision and audition: an event-related potential analysis. Psychophysiology. 2002;39:689–706. [PubMed] [Google Scholar]
- Thiel CM, Zilles K, Fink GR. Cerebral correlates of alerting, orienting and reorienting of visuospatial attention: an event-related fMRI study. Neuroimage. 2004;21:318–328. doi: 10.1016/j.neuroimage.2003.08.044. [DOI] [PubMed] [Google Scholar]
- Tzourio N, Massioui FE, Crivello F, Joliot M, Renault B, Mazoyer B. Functional anatomy of human auditory attention studied with PET. Neuroimage. 1997;5:63–77. doi: 10.1006/nimg.1996.0252. [DOI] [PubMed] [Google Scholar]
- Weissman DH, Mangun GR, Woldorff MG. A role for top-down attentional orienting during interference between global and local aspects of hierarchical stimuli. Neuroimage. 2002;17:1266–1276. doi: 10.1006/nimg.2002.1284. [DOI] [PubMed] [Google Scholar]
- Woldorff MG, Hazlett CJ, Fichtenholtz HM, Weissman DH, Dale AM, Song AW. Functional parcellation of attentional control regions of the brain. J Cogn Neurosci. 2004;16:149–165. doi: 10.1162/089892904322755638. [DOI] [PubMed] [Google Scholar]
- Woldorff MG, Tempelmann C, Fell J, Tegeler C, Gaschler-Markefski B, Hinrichs H, Heinz HJ, Scheich H. Lateralized auditory spatial perception and the contralaterality of cortical processing as studied with functional magnetic resonance imaging and magnetoencephalography. Hum Brain Mapp. 1999;7:49–66. doi: 10.1002/(SICI)1097-0193(1999)7:1<49::AID-HBM5>3.0.CO;2-J. [DOI] [PMC free article] [PubMed] [Google Scholar]
- Xiong JH, Gao JH, Lancaster JL, Fox PT. Clustered pixels analysis for functional MRI activation studies of the human brain. Human Brain Mapping. 1995;3:287–301. [Google Scholar]
- Yantis S, Serences JT. Cortical mechanisms of space-based and object-based attentional control. Curr Opin Neurobiol. 2003;13:187–193. doi: 10.1016/s0959-4388(03)00033-3. [DOI] [PubMed] [Google Scholar]
- Zatorre RJ, Bouffard M, Ahad P, Belin P. Where is ‘where’ in the human auditory cortex? Nat Neurosci. 2002;5:905–909. doi: 10.1038/nn904. [DOI] [PubMed] [Google Scholar]