

Single-cell quantification of the input–output relation of the quorum-sensing circuit reveals how Vibrio harveyi employs multiple feedback loops to simultaneously control quorum-sensing signal integration and to ensure signal transmission fidelity.
Keywords: feedback loops, quorum sensing, signal integration, single-cell fluorescence microscopy
Abstract
Quorum sensing is a chemical signaling mechanism used by bacteria to communicate and orchestrate group behaviors. Multiple feedback loops exist in the quorum-sensing circuit of the model bacterium Vibrio harveyi. Using fluorescence microscopy of individual cells, we assayed the activity of the quorum-sensing circuit, with a focus on defining the functions of the feedback loops. We quantitatively investigated the signaling input–output relation both in cells with all feedback loops present as well as in mutants with specific feedback loops disrupted. We found that one of the feedback loops regulates receptor ratios to control the integration of multiple signals. Together, the feedback loops affect the input–output dynamic range of signal transmission and the noise in the output. We conclude that V. harveyi employs multiple feedback loops to simultaneously control quorum-sensing signal integration and to ensure signal transmission fidelity.
Introduction
Cell-to-cell communication is fundamental to both unicellular and multicellular life. Cells often detect multiple chemical communication cues simultaneously and integration of the information encoded in these cues guides their behavior. Correctly integrating signals generally requires complex signal transduction pathways (Pawson and Scott, 2010). In insulin signaling, pancreatic β islets regulate cardiac contractility and insulin secretion by the synergistic action of multiple second messenger molecules such as cAMP and calcium-responsive effectors (Saltiel and Kahn, 2001). Integration of two signals enhances precision of some biological events (Pawson and Scott, 2010) and errors in neuronal signal integration underlie many human diseases. For example, proper neurodevelopment requires that the protein disrupted-in-schizophrenia-1 (DISC1) integrate signals from two parallel pathways (Mao et al, 2009). Mutations in DISC1 are associated with schizophrenia, a psychiatric disorder of social interaction (Millar et al, 2000). In prokaryotes, bacterial chemotaxis provides a paradigm for cellular response to multiple environmental stimuli (Armitage, 1992). The well-studied chemotactic signaling circuit in Escherichia coli receives both positive and negative signals, and generates an integrated response (Khan et al, 1995).
In addition to integrating signals, regulatory circuits must ensure signal transmission fidelity. Information can be lost or corrupted by internally generated noise (e.g. fluctuations in protein numbers) or by external perturbations (e.g. changes in temperature) and circuits must be designed to compensate for such factors. For example, the chemotaxis network of E. coli is designed to function robustly in the presence of gene-expression noise (Kollmann et al, 2005) and circadian circuits accurately compensate for temperature variation (Virshup and Forger, 2009). While signal integration and high-fidelity signal transmission have been addressed separately, little is known about the mechanisms cells use to solve both tasks simultaneously. Here, we report how the model bacterium Vibrio harveyi simultaneously integrates and faithfully transmits chemical signals.
In a process called quorum sensing, bacteria communicate by synthesizing, releasing, and detecting signal molecules called autoinducers (AIs). The bioluminescent marine bacterium V. harveyi integrates three AI signals into its quorum-sensing circuit: AI-1, an intra-species signal, CAI-1 an intra-genera signal, and AI-2 a ‘universal’ signal. Each signal is detected by a cognate receptor AI-1/LuxN, CAI-1/CqsS, and AI-2/LuxPQ (Figure 1A). The information contained in the three AIs is transduced through a shared signaling pathway. At low cell density, in the absence of AIs, the receptors autophosphorylate and pass phosphate to the phosphorelay protein LuxU, which in turn shuttles phosphate to the response regulator LuxO. Phosphorylated LuxO (LuxO∼P) activates transcription of genes encoding five small regulatory RNAs, Qrr1-5, that repress translation of the mRNA encoding the master quorum-sensing regulator LuxR. At high cell densities, the AIs accumulate, bind their receptors, and convert the receptors to phosphatases, thereby draining phosphate from LuxU and LuxO. Consequently, the Qrr sRNAs are not produced and luxR mRNA is translated. LuxR protein controls >100 genes that underpin collective behaviors including bioluminescence and biofilm formation.
Figure 1.

The V. harveyi quorum-sensing (QS) network and the absolute copy number of LuxR. (A) V. harveyi produces three autoinducers (AIs): AI-1, an intra-species signal, CAI-1 an intra-genera signal, and AI-2 a ‘universal’ signal. The signal processing circuit includes five feedback loops that integrate the three AI signals to control the master quorum-sensing regulator, LuxR. (B) The network used for studying signal integration between the AI-1 and AI-2 pathways. The CAI-1 pathway and the synthases for AI-1 and AI-2 are deleted. We define the ‘WT Loop’ strain in our study as the strain with all five feedback loops intact. (C) Absolute LuxR copy number distributions for four different AI input environments. Inset: single-cell fluorescence microscopy image of V. harveyi expressing a LuxR–mCherry fusion protein.
There are five feedback loops in the V. harveyi quorum-sensing circuit (Figure 1A). First, LuxO autorepresses its own transcription. Second, the Qrr sRNAs repress luxO translation. Third, LuxR autorepresses its own transcription. Fourth, LuxR activates expression of the qrr2-4 genes, which in turn, repress luxR translation. Fifth, as we show below, the luxMN operon, encoding the AI-1 synthase and receptor, is repressed by the Qrr sRNAs.
In a previous study, Long et al (2009) showed that information from the V. harveyi AIs is integrated strictly additively, with a close balance between the strengths of the different signals. That study did not, however, address how the circuit uses shared components to distinguish between multiple AI inputs or what role each feedback loop has in signal integration and transmission. To explore these features, here we examine the input–output relation between AIs and LuxR, using a suite of strains with specific feedback loops either present or disrupted. We found, first, that feedback onto LuxN allows V. harveyi to actively adjust its relative sensitivity to AI signals as cells transition from low to high densities, and, second, that the other feedback loops control the input and output dynamic ranges and the noise in the circuit. Remarkably, by functioning together, these feedback loops compress a 3 order of magnitude input range into a six-fold output range. Our results reveal that the V. harveyi quorum-sensing circuit employs multiple feedback loops to actively regulate signal integration while maintaining signaling fidelity.
Results
Identification of an sRNA feedback loop controlling LuxN levels
In quorum-sensing systems, AI production is frequently subject to positive feedback regulation. This regulatory wiring is presumed to impose synchrony in quorum-sensing circuits. Specifically, when an individual cell commits to quorum-sensing mode, by upregulating AI production and flooding the vicinity with signal, nearby cells are likewise induced to commit to the high cell density program. We wondered if this is the case in V. harveyi. To test this idea, we used liquid chromatography tandem mass spectrometry to quantify AI-1 levels in wild-type V. harveyi and in different V. harveyi quorum-sensing mutants. At high cell density, wild-type V. harveyi and a strain lacking the Qrr sRNAs (Δqrr1-5) produced three times more AI-1 than did strains that express high levels of the Qrr sRNAs (luxOD47E, a LuxO∼P mimic) (Figure 2A). This result suggests that Qrr sRNAs, directly or indirectly, repress AI-1 production at low cell density. Consistent with this result, we measured mRNA levels of LuxM, the AI-1 synthase, in the wild-type strain, in a strain lacking the Qrr sRNAs, and in strains expressing high levels of Qrr sRNAs. We also measured LuxM protein levels in all of these strains using a functional LuxM-GFP translational fusion (Supplementary Figure S1). The luxM mRNA expression and LuxM protein pattern match that of AI-1 activity: high levels of Qrr sRNAs correspond to low levels of luxM mRNA and LuxM protein (Figure 2B and C). Because the luxM and luxN (encoding the AI-1 receptor) genes overlap, we suspected that they are expressed in a single operon and that luxN mRNA and protein would therefore exhibit patterns of regulation similar to luxM. Indeed, levels of luxN mRNA and LuxN protein levels (as measured by a functional LuxN-FLAG fusion) increase in the absence of the Qrr sRNAs (Figure 2B and C; Supplementary Figure S2).
Figure 2.

AI-1, mRNA, and protein in V. harveyi strains. (A) AI-1 levels in WT, luxOD47E, and Δqrr1-5 V. harveyi strains lacking or containing the BP− mutation. (B) luxM and luxN mRNA levels in the same strains. Data are normalized to the luxOD47E strain. (C) LuxM-GFP or LuxN-FLAG protein levels in the same strains.
Analysis of the 5′ untranslated region (UTR) of the luxMN transcript reveals a putative Qrr sRNA-binding site (Figure 3A), suggesting that luxMN regulation could occur via direct pairing between the Qrr sRNAs and the luxMN mRNA. To test this possibility, we assayed whether a Qrr sRNA was sufficient to regulate LuxM-GFP production in E. coli. We used a strain of E. coli expressing LuxOD47E from the chromosome. As a reminder, LuxO∼P is required for activation of qrr gene expression, and LuxOD47E is a mutation that mimics the phosphorylated state of LuxO. Thus, introduction of LuxOD47E into E. coli drives high Qrr production (Tu and Bassler, 2007). The qrr4 gene was introduced into E. coli on a plasmid. To prevent Qrr4 repressing expression of luxOD47E via the feedback loop we had already identified (see Figure 1), we used a luxOD47E construct lacking the site required for Qrr binding. Introduction of Qrr4 repressed LuxM-GFP production ∼5-fold compared with the vector control (compare the first two bars of Figure 3B). Introduction of Qrr1, Qrr2, or Qrr3 also resulted in repression of LuxM-GFP (data not shown). To verify that Qrr regulation occurs by pairing, we mutagenized the putative Qrr-binding site in the 5′ UTR of the LuxM-GFP reporter and screened for mutations that prevented Qrr regulation of LuxM-GFP. A two base pair GC to CG mutation, which we refer to as BP− (for base pairing negative), was identified that exhibited significantly higher LuxM-GFP production than the unmutated sequence in the presence of Qrr4. The BP− mutation does not fully prevent Qrr4 repression, suggesting the mutation impairs but does not abolish the Qrr4–luxM interaction (compare the third and fourth bars of Figure 3B). We could not identify any luxM 5′ UTR mutation that reduced or eliminated Qrr regulation while leaving basal luxM expression completely unchanged. We engineered compensatory mutations (CG to GC) into Qrr4 (called BP*) to restore base pairing with the luxM BP− mRNA. The combination of the BP− mutation in luxM and the compensatory BP* mutation in Qrr4 restored wild-type level repression of LuxM-GFP production showing that, indeed, a repressive feedback loop exists between the Qrr sRNAs and the luxMN transcript (Figure 3B, fourth and fifth bars).
Figure 3.

Qrr4 directly controls LuxM production. (A) Alignment of the luxM 5′ UTR and the conserved region of Qrr4. The BP− and BP* mutations are shown in red. The ATG in green is the translation start site. (B) Levels of GFP produced by a LuxM-GFP translational fusion in E. coli. The labels on the bottom denote which qrr4 and/or luxM allele is present.
We tested whether the BP− mutation in the luxM 5′ UTR prevents Qrr regulation of luxM in vivo. To do this, we introduced the BP− mutation onto the V. harveyi chromosome at the native locus. In V. harveyi, wild-type Qrr repression of luxM mRNA is ∼3-fold. The BP− mutation abolishes Qrr repression of luxMN mRNA, while slightly elevating the basal level of luxM transcript (Figure 2B). LuxM-GFP measurements confirm that the elevated luxM RNA levels observed in the BP− mutants correspond to modestly elevated LuxM protein levels. In the presence of the BP− mutation, the V. harveyi LuxOD47E and Δqrr1-5 strains produce the same amount of LuxM-GFP (Figure 2C). We also tested whether the effects of the BP− mutation translate to alterations in AI production. In all strains carrying the BP− mutation, more AI-1 is produced than in the corresponding strain carrying wild-type luxM (Figure 2A). Using an analogous set of experiments, we found that the BP− mutation had an identical effect on luxN mRNA levels. That is, the mutation increased basal luxN expression slightly but eliminated the majority of Qrr regulation. This is not surprising given that luxM and luxN are on the same transcript (Figure 2B).
Input–output relation for the quorum-sensing circuit
To explore how the LuxN feedback loop identified above and the four other previously identified feedback loops (Figure 1A) affect signal processing in the V. harveyi quorum-sensing circuit, we focused on integration of the AI-1 and AI-2 signals. To do this, we used a strain in which we had eliminated any contribution from the CAI-1-CqsS pathway by deletion of the cqsS (CAI-1 sensor) gene (Figure 1B). This strain, which we denote as ‘WT Loop,’ is also deleted for the AI-1 and AI-2 synthases, luxM and luxS, respectively, which allows us to control the AI input into the circuit by exogenously adding precise quantities of AIs (Long et al, 2009) (Note: the WT Loop strain is not the same as the wild-type strain used in Figures 2 and 3). We quantified the circuit output by measuring the absolute copy number of the master quorum-sensing regulator, LuxR, fused to the red fluorescent protein, mCherry (Supplementary Figure S3). We chose LuxR as the reporter of circuit activity because it is the master transcription factor that integrates inputs from the five Qrr sRNAs (Waters and Bassler, 2006). To establish the proportionality between fluorescence intensity of the LuxR–mCherry reporter and absolute copy number, we developed an in vivo method that exploits small-number fluctuations in the partitioning of LuxR–mCherry when cells undergo division (Teng et al, 2010). The inset in Figure 1C shows an example of a microscopy image of V. harveyi cells expressing this functional LuxR–mCherry fusion. From images like this one, we quantified the fluorescence intensity of each cell from the ratio of total fluorescence to cell area measured by phase-contrast microscopy, and we subsequently converted fluorescence intensity into LuxR copy number (see Materials and methods). To directly compare LuxR concentrations among cells of different sizes, copy number N is defined as the ratio of total copy number to the cell area, multiplied by the average cell area of the ensemble. Figure 1C shows the cell-to-cell distribution of LuxR copy number N for four different AI input combinations (high/low AI-1 and high/low AI-2) spanning the full range of possible AI environments. We observed that the peak of the LuxR distribution shifts from ∼110 copies to ∼650 copies with increasing AI, but the widths of the peaks remain narrow <35% of the mean. These narrow single-peaked distributions in the number of LuxR proteins per cell reveal that all the bacteria in the population respond uniformly to AI inputs.
To investigate quorum-sensing signal integration, we studied the circuit input–output relation by employing 25 different combinations of AI-1 and AI-2, with each AI ranging from 0.1 nM to 1 μM. These concentrations span the full AI sensitivity range of wild-type V. harveyi (Swem et al, 2008; Long et al, 2009). We derived the mean LuxR copy number, the cell-to-cell s.d., and the noise (s.d./mean) from distributions analogous to those shown in Figure 1C. For the WT Loop strain (as a reminder, WT Loop refers to the V. harveyi strain incapable of CAI-1 detection, capable of responding to exogenous AI-1 and AI-2, and with all five feedback loops intact), the contour plot in Figure 4B shows the mean LuxR copy number as a function of [AI-1] (x axis) and [AI-2] (y axis). Figure 4C shows the cell-to-cell noise as a function of [AI-1] and [AI-2]. The global asymmetry of the noise with respect to AI-1 and AI-2 shown in Figure 4C generalizes a specific result exhibited in Figure 1C: that is, the relative width of the peak for saturating AI-1 is larger than the relative width of the peak for saturating AI-2. Thus, the AI-1 input channel is noisier than the AI-2 input channel. Surprisingly, this asymmetry is opposite to the expectation from small-number fluctuations, namely s.d./mean ∼(mean)−1/2, which would occur if noise in LuxR came primarily from stochasticity in its transcription and translation (Pedraza and Paulsson, 2008). The observed noise asymmetry therefore implies that other sources of noise must dominate in this circuit. Figure 4D shows the s.d. of cell-to-cell LuxR copy number, that is the product of Figure 4B and C.
Figure 4.
Input–output relation for the WT Loop strain and feedback-loop mutants. The five columns correspond to the WT Loop strain and four different feedback-loop mutants. (A, E, I, M, Q) Strain names and QS networks. (B, F, J, N, R) Mean LuxR copy number as a function of AI-1 and AI-2 concentrations. (C, G, K, O, S) Cell-to-cell noise (s.d./mean). (D, H, L, P, T) Cell-to-cell s.d. Color scales as in panels (B, C, D) with higher values in dark red. Source data are available for this figure at http://www.nature.com/msb.

Analysis of feedback-loop mutants
In previous work, we showed that the quorum-sensing circuit possesses four feedback loops (Figure 1A): The quorum-sensing response regulator LuxO directly represses its own transcription (Tu et al, 2010), the Qrr sRNAs repress luxO mRNA translation (Tu et al, 2010), LuxR directly represses its own transcription, and LuxR activates the production of Qrr2-4, which, in turn, feed back to repress luxR translation (Svenningsen et al, 2008) In the present work, we identified an additional feedback loop: the Qrr sRNAs repress production of the LuxN receptor by base pairing with luxMN mRNA and inhibiting translation.
Feedback loops frequently control noise (Paulsson, 2004) and dynamic range (Nevozhay et al, 2009) in signaling circuits, leading us to wonder if the quorum-sensing feedback loops (Figure 4A) have an analogous role. Specifically, the internal feedback loops could provide a mechanism for V. harveyi to control the fidelity of signal transmission, while the LuxN feedback loop could potentially regulate sensitivity to AI-1 and thus control signal integration. To address these possibilities and to systematically characterize the functions of the multiple feedback loops, we constructed a set of feedback-loop mutants: (1) We eliminated LuxO autorepression and Qrr repression of luxO. We call this strain the ‘LuxO Loop mutant’ (Figure 4E) (Tu et al, 2010). (2) We inactivated LuxR autorepression as well as Qrr activation by luxR in the LuxO Loop mutant. We call this the ‘LuxOLuxR Loop mutant’ (Figure 4I; Supplementary Figure S4) (Hammer and Bassler, 2003; Svenningsen et al, 2008). (3) We introduced the BP− mutation upstream of luxMN to disrupt Qrr repression. We call this the ‘LuxN Loop mutant’ (Figure 4M). (4) Finally, we combined all of the above feedback disrupting mutations into a single strain. We call this the ‘Five Loop mutant’ (Figure 4Q).
We used single-cell fluorescence microscopy measurements of LuxR–mCherry levels following addition of different combinations of AI to analyze the functions of the feedback loops. We obtained the distribution of quorum-sensing responses as in Figure 1C. The mean LuxR copy number contours for the LuxO Loop (Figure 4F) and the LuxOLuxR Loop mutants (Figure 4J) reveal significant asymmetry between the AI-1 and AI-2 pathways, and demonstrate that mutants that have the LuxO feedback loop disrupted exhibit reduced sensitivity to AI-1. Specifically, we find that in mutants lacking feedback onto LuxO, the levels of LuxR remain low in the absence of AI-2 even when saturating AI-1 is present (bottom right corner of Figure 4F and J). We suspect that disrupting the LuxO feedbacks causes LuxO to increase and, consequently, causes the Qrr sRNAs to increase (Tu et al, 2010). Accordingly, increased Qrr levels reduce luxR mRNA compared with the WT Loop strain. Indeed, Figure 5A shows that LuxR levels are reduced in the LuxO Loop mutant (orange) and the LuxOLuxR Loop mutant (purple) compared with the WT Loop strain (black) at low AI concentrations. We reason that the same increase in Qrr sRNA levels reduces luxN mRNA, resulting in decreased LuxN. In this scenario, because less LuxN is present in cells, the effective AI-1 signaling strength is diminished and this causes the asymmetrically reduced LuxR levels observed in the bottom right corners of Figure 4F and J.
Figure 5.

Dose–response curves and noise levels for WT Loop strain and feedback mutants. (A) Dose–response curves for AI-1, at AI-2=0. (B) Dose–response curves for AI-2, at AI-1=1 μM. (C) Dose–response curves for equal amounts of AI-1 and AI-2. (D) Cell-to-cell noise, expressed via noise2=(s.d./mean)2 versus mean LuxR copy number for different strains and AI concentrations. The gray curve is the best fit of (s.d./mean)2=β+α/mean, with β=0.03 and α=7. Inset: the region of lower LuxR copy numbers in log–log scale.
The above feature of the input–output relations of the LuxO Loop mutant and LuxOLuxR Loop mutant suggests that Qrr-mediated feedback onto LuxN controls AI signal integration. To test this idea, we measured the input–output relation for the LuxN Loop mutant that is defective for Qrr regulation of LuxN due to the BP− mutation (Figure 4M). The contour plot (Figure 4N) shows a modest increase in the asymmetry between AI-1 and AI-2 compared with the WT Loop strain (Figure 4B) such that the LuxN Loop mutant is more sensitive to AI-1 than is the WT Loop strain. Thus, the lack of the Qrr feedback loop on LuxN increases LuxN levels making V. harveyi more sensitive to AI-1.
Effect of constitutive versus regulated LuxN expression
Our hypothesis is that the LuxN feedback loop regulates LuxN production to control sensitivity to AI-1. To test this idea, we constructed strains that constitutively produce LuxN from a plasmid. Our strategy involved deleting the chromosomal luxN gene so that LuxN is not regulated by the Qrr sRNAs (see Supplementary information; Supplementary Figure S6). We introduced the constitutive LuxN construct into the WT Loop and LuxO Loop mutant to generate two strains that we call ‘WTLoop LuxN-on’ and ‘LuxOLoop LuxN-on.’ We measured luxN mRNA levels in both strains and compared those levels with the corresponding strains that do not constitutively produce LuxN (Figure 6A; Supplementary Figure S7). In the WT Loop strain, luxN mRNA changes roughly 10-fold in response to AI. By contrast, luxN mRNA of the WTLoop LuxN-on strain is not altered in response to AI, confirming that quorum-sensing regulation of LuxN does occur in the WT Loop strain and is mediated by the Qrr sRNAs.
Figure 6.

luxN mRNA level and input–output relations for strains constitutively producing LuxN. (A) luxN mRNA levels in the WT Loop strain and the WTLoop LuxN-on strains at four different AI inputs. (B) Mean LuxR copy number of the WTLoop LuxN-on strain. (C) Mean LuxR copy number of the LuxOLoop LuxN-on mutant.
Comparison of the contour plots of the mean LuxR copy number for the WTLoop LuxN-on strain (Figure 6B) to those for the WT Loop strain (Figure 4B) shows that the constitutively produced LuxN acts as a kinase (left edge of the contour) and dominates the total kinase activity feeding into the circuit. This strong kinase activity of LuxN makes the system impervious to AI-2 (top left corner). Only at very high levels of AI-1 (10–100 μM) is the kinase activity of the constitutive LuxN reduced to a level required to observe the residual effect of the LuxPQ kinase activity, allowing AI-2 to be detected (top right corner).
Comparing the contour plot of the mean LuxR copy number for the LuxOLoop LuxN-on strain (Figure 6C) to that for the LuxO Loop strain (Figure 4F) reveals that the sensitivity to AI-1 is low for the LuxO Loop mutant (bottom edge of the contour), but it is wild type in the LuxOLoop LuxN-on strain. Presumably, in the LuxO Loop mutant strain, the high level of LuxO and thus of Qrr sRNAs leads to reduced LuxN receptor levels, and thus decreased sensitivity to AI-1. By contrast, in the LuxOLoop LuxN-on strain, AI-1 sensitivity is recovered because LuxN is constitutively expressed at high levels.
Negative feedback changes the dynamic range of inputs and outputs
The output of the quorum-sensing circuit, LuxR, is a transcription factor, and its effective response range is empirically limited by the range of sensitivity of its downstream targets. However, LuxR levels above this range may also be biologically relevant for the following reason: At the transition from HCD to LCD, LuxR starts at its highest level and is slowly diluted by cell growth and division (Tu and Bassler, 2007; Svenningsen et al, 2008). Thus, the level of LuxR at HCD influences the time required for cells to transition to the LCD program of gene expression. Cells may therefore limit the accumulation of LuxR at HCD to enable rapid transitions to LCD, for example upon shedding from a biofilm or expulsion from a eukaryotic host (Zhu and Mekalanos, 2003; Svenningsen et al, 2008). We wondered if the feedback loops have a function in setting the output range of LuxR. To address this possibility, we compared the output dynamic ranges of the WT Loop strain and the different feedback-loop mutants. Figure 4F, J, and R reveals that the mutants all display larger output dynamic ranges than does the WT Loop strain (Figure 4B). In particular, the Five Loop mutant contour plot (Figure 4R) shows much higher LuxR output (∼1200 copies) at saturating AI-1 and AI-2 than does the WT Loop strain (∼650 copies), and correspondingly, the output dynamic range increases more than three-fold over that of the WT Loop strain. Dose responses to AI-1, at AI-2=0, for the five different strains (Figure 5A) show that mutants lacking the LuxO feedback loop (LuxO Loop, LuxOLuxR Loop, and Five Loop mutants) harbor lower basal LuxR (∼60 copies) than does the WT Loop strain (∼110 copies). To highlight the differences in LuxR levels among strains, we also plot dose responses to AI-2 at saturating AI-1 (Figure 5B), and dose responses to equal amounts of AI-1 and AI-2 (Figure 5C). These plots simply correspond to cuts through the mean copy number contours in Figure 4B, F, J, N, and R. Notably, the mutants without the LuxR feedback loops (LuxOLuxR Loop and Five Loop) have much higher (∼1200 copies) LuxR levels at saturating AI-1 and AI-2 than the WT Loop strain (∼650 copies). This result suggests that the LuxR feedback loops act to cap the maximum level of LuxR protein, perhaps to accelerate the HCD to LCD transition as described above.
The WT Loop strain (Figure 4B) shows a gradually increasing output (∼6-fold) over 3 orders of magnitude of AI input dynamic range (from ∼1 nM to ∼1000 nM). However, the input dynamic ranges appear significantly narrower in some of the feedback-loop mutants (e.g. Figure 4J and R). Thus, the feedback loops function to convert the behavior of the circuit from an on–off switch (Five Loop in Figure 4R) to a broad graded response to AI inputs (WT Loop in Figure 4B). To quantify the sharpness of response to both AIs, we studied dose responses to simultaneous addition of AI-1 and AI-2 in the five different strains (Figure 5C), over a concentration range adequate to change both LuxN and LuxPQ from kinases to phosphatases. In Figure 5C, the Hill coefficient is ∼1 in the WT Loop strain, the LuxN Loop mutant, and the LuxO Loop mutant, and ∼2 in the LuxOLuxR Loop mutant and the Five Loop mutant. In particular, the Five Loop mutant (Figure 4R), unlike the WT Loop strain, is only sensitive to a 10-fold range of AI concentration: the output changes ∼20-fold over the input range of 10 to 100 nM of both AI-1 and AI-2. We conclude that the LuxR feedback loops contribute to the expanded input dynamic range observed in the WT Loop strain.
Noise properties of the quorum-sensing circuit
One common role of negative feedback loops in networks is to reduce noise (Paulsson, 2004; Nevozhay et al, 2009). We therefore examined whether the four internal feedback loops regulate noise in the quorum-sensing circuit. We compared the noise contour plots for different strains. Recall that the noise is defined as the s.d./mean for the LuxR distributions as exemplified by the data in Figure 1C. The noise contours for the LuxO Loop mutant (Figure 4G) and the LuxOLuxR Loop mutant (Figure 4K) are similar to that of the WT Loop strain (Figure 4C), with the peak of noise in the bottom right corner (saturating AI-1) and minimal noise in the upper right corner when both AIs are saturating. However, the LuxOLuxR Loop mutant (Figure 4K) has a peak noise value of ∼0.75, which is significantly larger than that of the WT Loop strain (∼0.35) (see bottom right corner of Figure 4C). This result suggests that the LuxR feedback Loop acts as a filter to reduce noise in the circuit.
To compare the theoretical expectations for the cell-to-cell noise in LuxR copy number, Figure 5D shows the square of LuxR noise, that is (s.d./mean)2, versus mean LuxR copy number for the different strains and AI concentrations. For clarity, the inset in Figure 5D highlights the region of lowest LuxR copy numbers. To gain insight into the sources of LuxR noise, we attempt to correlate noise and mean expression levels as previous studies (Bar-Even et al, 2006; Taniguchi et al, 2010). The gray curve in both the figure and its inset is the best fit to the low copy number region (N<400) of (s.d./mean)2=β+α/mean. The second term, α/mean is expected for intrinsic noise from small-number fluctuations arising from the stochasticity of transcription and translation (Pedraza and Paulsson, 2008). The measured proportionality constant, α≈7, is larger than the expected value of α=1 for a simple Poisson process (i.e. stochastic protein production at a fixed rate). At least in part, the enhanced noise likely reflects intrinsic noise from a number of luxR mRNAs much smaller than the number of LuxR proteins, possibly including bursting in the transcription of luxR (Golding et al, 2005). Our results are consistent with a recent study of gene-expression noise in E. coli, where α only approached 1 when the mean protein number was <10 (Taniguchi et al, 2010). The additional constant, β≈0.03, is the basal level of noise due to additional sources. A portion of β may be due to extrinsic noise such as cell-to-cell variation of RNA polymerase or ribosome levels. Another portion of the constant is due to measurement noise, for example camera thermal noise. We found that the noise contours for the WT Loop strain and for the LuxO Loop mutant and the LuxOLuxR Loop mutant appear to obey (s.d./mean)2=β+α/mean over the entire range of the contours. This result suggests that the noise in LuxR levels indeed derives from two distinct sources, one extrinsic ∝ β and one intrinsic due to gene-expression stochasticity ∝ α/mean.
Positive/negative LuxN feedback leads to higher/lower noise
We were curious whether Qrr feedback onto LuxN could influence noise in the quorum-sensing circuit. To investigate this, we compared cell-to-cell noise between strains with the LuxN feedback loop disrupted or intact. Interestingly, the LuxN Loop mutant shows a reproducibly lower noise level (∼0.25 at bottom right corner of Figure 4O) compared with the WT Loop strain (∼0.35 at bottom right corner of Figure 4C). Similarly, disrupting the LuxN feedback in the LuxOLuxR Loop mutant strain yields a mutant with lower noise—compare the Five Loop mutant (∼0.50 at bottom right corner of Figure 4S) to the LuxOLuxR Loop mutant (∼0.75 at bottom right corner of Figure 4K). Both cases suggest that a positive feedback loop exists when LuxN acts as a phosphatase, and the disruption of this positive feedback reduces noise. Specifically, at high AI-1 concentrations, LuxN acts predominantly as a phosphatase, draining phosphate from the signaling cascade and reducing production of the Qrr sRNAs. A cell with more LuxN proteins therefore produces less Qrr sRNAs, which, in turn, relieves repression of luxN mRNA, yielding increased LuxN. The resulting positive feedback loop could amplify any source of noise in the quorum-sensing circuit including intrinsic small-number fluctuations.
We note that at low AI-1 concentration, when LuxN is a kinase, disruption of the LuxN feedback loop does not affect the noise level. Specifically, the noise is similar between the left edge of Figure 4S (Five Loop mutant) and the left edge of Figure 4K (LuxOLuxR Loop mutant); the noise is also similar between the left edge of Figure 4O (LuxN Loop mutant) and the left edge of Figure 4C (WT Loop). We suspect that there are other negative feedback loops in the quorum-sensing circuit, which have not yet been identified, that could prevent noise from increasing upon disruption of the LuxN feedback loop when LuxN acts as a kinase.
Modeling the network
Many features of the data we have obtained can be understood using a mathematical model for the V. harveyi quorum-sensing network. The model extends the mathematical framework developed previously (Long et al, 2009; Mehta et al, 2009) for the ‘open-loop’ quorum-sensing circuit, lacking feedback loops (for complete details see Supplementary information). Within these models, receptors exist in two states: a low-kinase activity state we call ‘off’ and high-kinase activity state we call ‘on’ (Keymer et al, 2006; Swem et al, 2008). AIs act by binding to a receptor and changing the relative free energies of the two activity states, with ligand binding favoring the ‘off’ state. The probability, X, that LuxN is in the on-state as a function of AI-1 concentration is given by
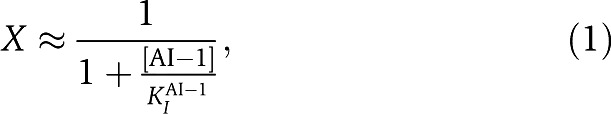 |
and the probability, Y, that LuxPQ is in the on-state as a function of AI-2 is given by
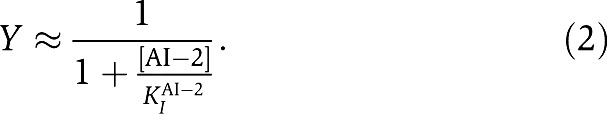 |
The fraction of LuxO molecules that are phosphorylated, Z, is related to these probabilities by the expression
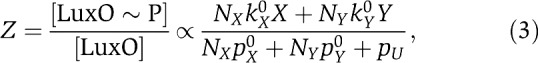 |
where NX and NY are the number of LuxN and LuxPQ receptors, respectively; kX0 and kY0 are the kinase activities of single LuxN and LuxPQ receptors in the on-state, respectively; pX0 and pY0 are the (constant) phosphatase activities of single LuxN and LuxPQ receptors, respectively; and pU is the spontaneous dephosphorylation rate of phospho-LuxU. In deriving Equation (3), we have made the biologically justified assumption that the phosphatase rates are much larger than the kinase rates.
A complete kinetic model incorporating the feedback loops is currently impractical because of the large number of unknown parameters. In particular, modeling the interactions of the five Qrr sRNAs with multiple mRNA targets (luxMN, luxR, luxO) is extremely sensitive to selection of parameters due to stoichiometric competition between mRNA targets. For this reason, we present a simplified description in which we model the number of LuxR proteins as some monotonically decreasing function, R(Z), of the fraction Z (Equation (3)) of phosphorylated LuxO proteins. We make no assumptions about the specific form of R(Z). The effect of the feedback loops on LuxR is to modify the function R(Z). As described above, we find experimentally that eliminating the negative feedback loops makes R(Z) ultrasensitive (i.e. possessing a Hill coefficient greater than one).
The effect of feedback on LuxN is explicitly incorporated into the model by making the number of LuxN receptors a function of the fractional LuxO∼P level, NX=NX(Z). Such a model for feedback on receptors was previously considered in Mehta et al (2009). Given a model of the receptor feedback, NX(Z), one can explicitly solve Equation (3) for Z.
Our mathematical model makes a number of strong predictions. Consider the constant output contours for the fraction of phosphorylated LuxO proteins, Z, as a function of the receptor on-state probabilities X and Y (i.e. the set of ordered pairs (X,Y) that give rise to the same Z). Equation (3) implies that these contours will be straight lines with slopes, s(Z), set by the normalized receptor ratio
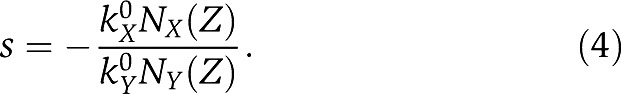 |
Moreover, constant output contours of any monotonic function that depends on X and Y only through Z will also be straight lines with the same slopes. In particular, the constant output contours of [LuxR]=R(Z) will be straight lines with slopes s(Z) set by the normalized receptor ratio in Equation (4). Since we are considering outputs of constant Z, this statement is true even in the presence of feedback loops on receptor number as long as the feedback loops do not depend on X and Y separately but only on their combined output Z. For example, in the presence of a feedback loop on the number of LuxN receptors, NX=NX(Z), the constant output contours will be straight lines with slopes s(Z) that vary with the output Z. Thus, by replotting LuxR levels as a function of the receptor on-state probabilities X and Y for various network architectures, one can both validate the model and extract receptor ratios. To carry out this procedure, it is necessary to learn the two free parameters KIAI−1 and KIAI−2 appearing in Equations (1) and (2) that relate receptor on-state probabilities to AI concentrations, as described below.
Equation (3) is a general result for the fraction of phosphorylated LuxO set by the V. harveyi phosphorelay. Dose–response experiments performed in Long et al (2009) using a GFP reporter for LuxO∼P activity were well fit by a function of the form in Equation (3) with kX0NX/kY0NY≈1, KIAI−1=6.9 nM, and KIAI−2=6.4 nM. Thus, for the strain used in this study, the constant output contours of LuxO∼P as a function of the receptor on-state probabilities X and Y are all straight lines with slopes of −1.
The strain used in Long et al (2009) contained four of the five native quorum-sensing Qrr sRNAs (Qrr1-3, Qrr5). Thus, both the sRNA-mediated LuxN and LuxO feedback loops were (partially) operative in this strain. In addition, the LuxO autorepressive feedback loop was also active. Thus, aside from lacking Qrr4 and LuxR, the network studied in Long et al (2009) is the same as the WT Loop strain studied here. Therefore, according to our mathematical model, the constant output contours of LuxR as a function of X and Y, with KIAI−1 and KIAI−2 learned from Long et al (2009), should be similar to those for LuxO∼P observed in Long et al (2009), namely straight lines all with slopes of approximately −1. The results are shown in Figure 7A and are in strikingly good agreement with the model prediction. We emphasize that all we have done is to replot the data from Figure 4 as a function of receptor on-state probabilities with no free parameters. The resulting contours are indeed straight lines, with slopes that vary from −0.9 at low LuxR to −1.3 at high LuxR (Supplementary Figure S9). Our mathematical model allows us to relate the slopes of the contour lines to the receptor ratio of LuxN and LuxPQ through Equation (4). The equation implies that for more horizontal contours the normalized ratio of LuxN to LuxPQ is small. For more vertical contours the opposite holds, and the LuxN to LuxPQ ratio is high. Furthermore, the global rotation of contour lines is a signature of an output-dependent feedback loop that modulates receptor ratios (Mehta et al, 2009). The changing contour slopes in Figure 7A indicate an increasing LuxN to LuxPQ ratio with increasing LuxR, providing additional evidence that the Qrr-mediated LuxN feedback loop is active in our WT Loop strain.
Figure 7.

LuxR protein number as a function of the receptor on-state probabilities for LuxN (X) and LuxPQ (Y). (A) WT Loop strain, (B) LuxO Loop strain, (C) LuxOLuxR Loop strain, (D) LuxN Loop strain, (E) Five Loop strain, and (F) WTLoop LuxN-on strain. Note that the axes have been inverted to match those in Figure 4.
To better understand the role of the feedback loops in quorum-sensing regulation, we replotted the data from the mutant strains employed in this work as contour plots of the receptor on-state probabilities X and Y (Figure 7). What is immediately obvious is that replotting the data gives output contours that are more linear than those in Figure 4, where LuxR number is plotted against AI concentrations. The strains in Figure 7 exhibit distinct behaviors. In both the WT Loop strain and the LuxOLuxR Loop mutant, the contour lines have slopes of approximately −1, indicating that there are roughly equal amounts of LuxN and LuxPQ (weighted by per receptor maximal kinase activity). In the LuxN Loop strain in which feedback onto LuxN is disrupted, the contour lines remain linear but rotate globally, indicating that there are more LuxN receptors then LuxPQ receptors at low AI concentrations (large X and Y), and more LuxPQ receptors than LuxN receptors at high AI concentrations (small X and Y). Surprisingly, in the LuxO Loop mutant strain in which only the LuxO-dependent feedback loops are inactive, the contour lines rotate from nearly vertical to nearly horizontal with increasing Y. Consequently, this strain displays the most deviation from linear contours, with individual contours changing slope, suggesting that eliminating the LuxO feedback loops violates the condition that AIs affect receptor ratios only through the known quorum-sensing pathway. Finally, in the WTLoop LuxN-on strain in which LuxN is constitutively expressed, the contour lines are almost entirely vertical except at the highest LuxR levels.
Discussion
The V. harveyi quorum-sensing circuit uses multiple feedback loops to control AI signal integration and signal transmission. Intriguingly, we found that a feedback loop regulates the level of the AI-1 receptor LuxN, to adjust the relative sensitivity to AI signals. In principle, this active regulation allows cells to ‘pay attention’ to particular signals at different stages during the transition from low to high cell density, and potentially helps explain how the quorum-sensing circuit can distinguish multiple inputs using a single output. Our study also provides quantitative evidence that multiple feedback loops control the input and output dynamic ranges and noise level of the circuit.
Why does the circuit actively regulate receptors?
Our results suggest that, in addition to the input signals, the receptor ratios (Supplementary Figure S9) also have a role in determining the circuit output. One advantage of this regulation is to assure that cells only respond to steady, reliable signals. Cells control protein levels on the time scale of the cell cycle, so the regulation of receptor levels may aid in filtering out rapid signal fluctuations from one particular AI channel in the environment. In this scenario, at low cell density, a transient increase in AI-1 will not cause cells to commit to the quorum-sensing transition because the LuxN receptor level is low. Rather, cells will only respond to persistently high levels of AIs, allowing time for LuxN to build up, before committing to the quorum-sensing transition. As a corollary, however, because of the low copy number of LuxN at low cell density, the circuit is more sensitive to an impulse of AI-2. Such a changing balance in the sensitivity to AIs with increasing cell density could constitute a useful property of the quorum-sensing circuit. Mehta et al (2009) previously suggested that feedback on receptor number allows bacteria to focus attention on one input in order to monitor different stages of development. Our results suggest the cells pay more attention to AI-2 than AI-1 at low cell density and then pay more attention to AI-1 than to AI-2 at high cell density. Nadell et al (2008) previously suggested that the ‘universal’ signal AI-2 is more informative for a mixed-species community at the early stage of biofilm formation and AI-1 is more informative for a single-species community at a later stage of biofilm formation. Thus, it is possible that the directed sensitivity of the quorum-sensing circuit evolved in response to a canonical progression from a mixed-species to a single-species community during biofilm development.
Quantitatively, the differences in WT Loop strain receptor ratios inferred from the slopes of the output contours in Figure 7A are modest, ∼40% over the full AI range. Why are receptor ratios held within such a narrow range? Our data in Figure 6B suggest that cells lose all sensitivity to one channel if the expression level of the receptor for another channel becomes too high. Receptor ratios therefore cannot undergo extreme variations if cells are to maintain sensitivity to multiple AI channels. Our direct measurements of LuxN expression (Supplementary Figure S5) indicate a large increase in LuxN levels with increasing AI concentration, but we have not observed a parallel increase in LuxPQ expression. Thus, how the effective receptor ratio between LuxN and LuxPQ is maintained within the narrow range inferred from the signaling data (Figure 7A) remains unknown.
In the case of LuxN, we observed a large increase in receptor number at high AI concentrations. One consequence of higher receptor levels might be to establish dominance of AI signaling over any other inputs that impinge on the quorum-sensing pathway. For example, in Vibrio cholerae the VarS/VarA two-component system affects the activity of LuxO (Lenz et al, 2005). By acting as phosphatases at high cell density, receptors prevent other kinases from phosphorylating and thereby activating LuxO, and so higher receptor levels might insulate the pathway from other inputs once high cell density is achieved. A second consequence of higher receptor levels might be to accelerate the transition from high cell density to low cell density. The accumulation of receptors at high cell density maximizes the total kinase rate upon a transition from high cell density to low cell density. The resulting strong kinase activity will rapidly phosphorylate LuxO, leading in turn to rapid production of Qrr sRNAs and an accelerated switch to the low cell density program of gene expression. Since transitions from high cell density to low cell density in the natural environment may be very fast, for example during shedding from a biofilm of expulsion from a eukaryotic host, cells may put a premium on rapid induction of the low cell density program of expression.
The circuit tightly regulates both the input and output dynamic range
Previous work has shown that negative feedback in signaling can contribute to the linearization of the input–output relationship. Nevozhay et al (2009) demonstrated that negative autoregulation coupled with pairing between a repressor and an inducer can robustly convert a sigmoidal dose response to a linear dose response. Yu et al (2008) identified a related negative feedback effect in the pheromone response of yeast—negative feedback aligns the dose response of consecutive steps in a pathway, which improves the linearity of the overall relation between the input pheromone concentration and the pathway output. In our study, the input dynamic range is ∼100-fold larger for WT Loop strain (Figure 4B) than for the Five Loop mutant (Figure 4R) and, likewise, the dose response for the WT Loop strain is much more linear (up to ∼2-fold difference in Hill coefficients) (Figure 5C). These results demonstrate that the multiple feedback loops act together to significantly broaden the input dynamic range. Specifically, the Five Loop mutant has a sharp transition with regard to both AIs, so that this feedback-lacking strain acts as a ‘coincidence detector’ for AIs, only responding to simultaneously high levels of both AIs. As a result, the circuit without negative feedback loops loses information about the full range of AI inputs. In contrast to such an ‘on–off’ switch, the circuit in the WT Loop strain gradually responds over a broad range of AI signals. We speculate that in the natural environment it may be important for V. harveyi to correctly respond to different AI blends. As mentioned, it is possible that different combinations of AIs encode information about the developmental stage of the community (e.g. the development of a biofilm). If so, it could be advantageous for cells to coordinate their behaviors at multiple developmental stages by expanding and actively controlling the AI dose–response range via negative feedback loops.
The mean LuxR contour in the WT Loop strain (Figure 4B) clearly demonstrates that the circuit tightly controls the output dynamic range to a modest six-fold difference. How do the feedback loops regulate this range? We observed that the output range is 20-fold for both the LuxOLuxR Loop mutant (Figure 4J) and the Five Loop mutant (Figure 4R). At high cell density, the maximum level of LuxR is much larger for the LuxOLuxR Loop mutant and the Five Loop mutant (∼1200 copies) than for the WT Loop strain (∼650 copies). Apparently, LuxR autorepression places an upper bound on LuxR levels. As shown in Figure 5A, we found that at low cell density, the minimum level of LuxR is the same (∼60 copies) for the LuxOLuxR Loop mutant and the Five Loop mutant, and lower than the level (∼110 copies) for WT and the LuxN Loop mutant. We reason that LuxR can never be fully repressed by the Qrr sRNAs because the high level of Qrr sRNAs needed to do this would also fully repress LuxO, which is required for qrr expression. Indeed, disruption of Qrr-mediated repression of LuxO did lead to lower minimum levels of LuxR, but only by ∼45%, suggesting that other mechanisms also prevent LuxR from being fully repressed.
Why does the circuit limit the output dynamic range to only six-fold? In a previous study (Svenningsen et al, 2008), it was shown that in V. cholerae, the transition from high cell density to low cell density is accelerated by HapR activation of qrr gene expression (recall that HapR is the V. cholerae homolog of V. harveyi LuxR). In particular, the accumulation of HapR at high cell density activates rapid production of Qrr sRNAs upon the switch to low cell density. While the Qrr sRNAs lead to rapid destruction of hapR mRNA, the levels of HapR protein decrease only slowly, due to dilution by growth. V. harveyi LuxR protein exhibits the same behavior (Tu and Bassler, 2007). It is possible that the circuit tightly limits maximal LuxR levels to prevent LuxR from being present for an overextended time following the transition from high cell density to low cell density. Thus, both the tight control of LuxR levels and the accumulation of receptors at high cell density suggest that the quorum-sensing circuit is at least in part designed to accelerate the response of cells to sudden transitions from high to low cell density.
Feedback noise in two-component systems
The WT Loop strain (Figure 4B) displays higher LuxR noise in an AI-1-only environment than in an AI-2-only environment. By contrast, in the LuxN Loop mutant (Figure 4N), the noise is roughly identical under these two conditions. We concluded that the LuxN feedback loop contributes to LuxR noise, and we speculated that the loop promotes positive feedback when LuxN acts as a phosphatase, which increases the noise in the circuit. Previously, Christian et al (2010) showed that a two-component system can change the sign of its feedback depending on the signal level and negative feedback often reduces noise while positive feedback leads to phenotypic heterogeneity. In our case, we expect the LuxN feedback to be positive at high AI-1 concentrations, and thus increase the noise. However, the overall change in noise level is modest, and it is not clear whether the increased noise at high AI-1 concentrations has any beneficial role or is simply an unavoidable consequence of the regulated increase in LuxN levels at high cell density.
Conclusion
The integration of multiple signals is a common challenge faced by all living organisms. Here, we have exploited single-cell fluorescence microscopy to explore the integration of quorum-sensing signals by the model social bacterium V. harveyi. Multiple feedback loops in the V. harveyi quorum-sensing circuit actively regulate receptor ratios to control signal integration, expand the input and compress the output dynamic range, and regulate noise. The sophistication of the circuitry appears to reflect the complex requirements of responding appropriately to multiple signals in a dynamically changing environment.
Materials and methods
Bacterial strains and media
All V. harveyi strains used in this study were derived from the WT strain BB120 (Bassler et al, 1997) and grown in either Luria-Marine (LM) or Autoinducer Bioassay (AB) broth at 30°C. For general DNA manipulation, E. coli S17-1λ pir was used and grown in Luria-Bertani (LB) broth. A list of strains and plasmids used in this study is provided in Supplementary Table S1.
DNA manipulations
DNA manipulations were performed as described by Sambrook et al (1989). Site-directed mutagenesis was performed with the Quickchange II Site-Directed mutagenesis kit (Stratagene). PCR reactions were performed with Herculase-enhanced DNA polymerase (Stratagene) or iProof high-fidelity DNA polymerase (Bio-Rad). Restriction endonucleases, dNTPs, and T4 ligase were purchased from New England Biolabs. Qiagen methods were used for plasmid preparations and PCR cleanups. Sequences of primers are available by request.
V. harveyi mutant construction
Genes were introduced into V. harveyi using pLAFR plasmids carrying segments of the V. harveyi genome as in Datsenko and Wanner (2000). Mutations were moved onto the chromosome via allelic exchange (Bassler et al, 1993). Antibiotic resistance markers were eliminated as previously reported (Long et al, 2009). To construct the WT LuxN-on and the LuxOLoop LuxN-on strains, we use allelic replacement with pST153 (ΔluxN::Cmr) to delete luxN from WT (KT833) and from the LuxO Loop mutant (KT836). To engineer a plasmid (pST157) constitutively expressing LuxN, an IPTG-Theophyline-inducible luxN expression construct was cloned into the AvrII/NotI sites of pJCV025, a modified version of pEVS143.
Microscopy and protein copy number calibration
Overnight cultures were back diluted 106-fold into specific AI concentrations and grown to OD600 ∼0.05 for 12 h. A 1-ml volume of the culture was pelleted by centrifugation, resuspended in ∼50 μl of new medium, and ∼1 μl placed between a 1% agarose pad and a glass cover slip. To acquire the distribution of LuxR over a population of ∼1000 cells, we used a custom computer program to automatically obtain images and determine the areas and fluorescence signals of individual cells. The fluorescent signal was collected with a cooled (−60°C) CCD camera (Andor iXon, South Windsor, CT) from an epifluorescence microscope TE-2000U (Nikon, Melville, NY). Matlab (The MathWorks, Natick, MA) was used to calculate the variance and mean of the distribution. We used monolayer of fluorescence beads sandwiched between two coverslips to calibrate the homogeneity of the field of view. It was confirmed that the fluorescent field of view is in the focal plane.
mRNA measurements
In Figure 2, mRNA was measured as follows: V. harveyi was grown in AB medium to OD600 ∼0.4, and 0.5 ml of cells were collected in RNA Protect (Qiagen). RNA was purified using the RNeasy Kit (Qiagen), and subsequently treated with DNAse from the DNA-free kit (Ambion). cDNA was produced using SuperScript III Reverse Transcriptase (Invitrogen), and quantitative PCR was performed using the Sybr Green PCR Master Mix and a 7900HT real-time PCR instrument (Applied Biosystems).
In Figure 6, RNA was measured as follows: V. harveyi was grown in AB medium for 12 h and subsequently diluted to 106-fold into four different AI concentrations (AI=0, AI-2=1 μM, AI-1=1 μM, and both AI-1 and AI-2=1 μM). After 12 h of growth at 30°C, 1 ml of each culture was removed and RNA was preserved by addition of RNAlater solution (Applied Biosystems). Quantification of RNA levels was later performed using the QantiGene Plex 2 Reagent System (Panomics) according to the manufacturer's protocol.
Fluorescence assays
All population level GFP assays were performed on a BD FACS Aria cell sorter. Data analysis was performed using the FACS Diva software. All analyses are the average of 10 000 cells.
Western blot analyses
Strains were grown in LM medium to an OD of ∼0.4, and 1 ml of cells were collected and resuspended in 180 μl of a 1:1 TE:1% SDS solution, sonicated for 15 s, and diluted in 2 × Laemmli Sample Buffer (Bio-Rad). Samples were electrophoresed on 4–20% Mini-Protein Gels (Bio-Rad), and subsequently transferred to nitrocellulose membranes. Membranes were blotted with an anti-Hfq antibody as a loading control, stripped, and then blotted with an anti-FLAG antibody (Sigma). Following exposure, films were scanned and analyzed with ImageJ software (NIH).
Measurement of AI-1 levels
V. harveyi strains were grown in AB medium to an OD of ∼0.4. Synthetically prepared 13C2-AI-1 was added to a final concentration of 500 ng/ml, the sample was mixed by vortex, and then filter sterilized. The sterilized supernatants were combined with 0.1 × volume of ice-cold methanol, mixed by vortex, and pelleted by centrifugation at 4°C. The cleared supernatants were stored at −20°C until analysis.
Samples were analyzed on a Finnigan TSQ Quantum Ultra triple quadrupole mass spectrometer (Thermo Fisher Scientific, San Jose, CA) operating in selected reaction monitoring (SRM) mode, coupled with a Shimadzu LC-10AD HPLC system (Shimadzu, Columbia, MD). LC separation was performed on an aminopropyl column (Luna 5 μm particle size, 50 × 2 mm2, from Phenomenex, Torrance, CA) at basic pH. Solvent A was 20 mM ammonium acetate+20 mM ammonium hydroxide in 95:5 water:acetonitrile, pH 9.3. Solvent B was acetonitrile. The gradient was: t=0, 85% B; t=6 min, 0% B; t=15 min, 0% B; t=16 min, 85% B; t=20 min, 85% B. Other LC parameters were autosampler temperature 4°C, column temperature 15°C, injection volume 10 μl, and solvent flow rate 200 μl/min.
Unlabeled, and 13C2-labeled AI-1 were detected using SRM m/z 188 → 102 at 11 eV, and 190 → 102 at 11 eV, respectively, in positive ion mode. The retention time was 1.3 min. The MS parameters were spray voltage 3000 V, nitrogen as sheath gas at 30 arbitrary unit and auxiliary gas at 10 arbitrary unit, argon as the collision gas at 1.5 mTorr, capillary temperature 325°C. Scan time for each SRM was 0.1 s, with a scan width of 1 m/z. The concentrations of AI-1 in samples were determined by normalizing to the observed signal of 13C2-labeled AI-1 (internal standard) at known concentration (500 ng/ml).
Supplementary Material
Acknowledgments
We thank the members of the Bassler and Wingreen laboratories for insightful comments. We thank Joshua Rabinowitz and Kellen Olszewski for help with mass spectral analyses. We thank Gisela Storz for the gift of the anti-Hfq antibody. This work was supported by the Howard Hughes Medical Institute, National Institutes of Health (NIH) Grant 5R01GM065859, National Science Foundation (NSF) Grant MCB-0343821 to BLB, a National Institutes of Health (NIH) Grant 7K25GM086909 to PM, and by the Princeton Center of Excellence grant: National Institute of General Medical Sciences Center for Quantitative Biology/National Institutes of Health Grant 2P50 GM-071508. ST and NSW acknowledge support from Defense Advanced Research Projects Agency Grant HR0011-09-1-0055.
Author contributions: KT and ST initiated the study. ST designed and performed the single-cell experiments. JNS designed and performed the genetic analysis of the feedback loop. WL performed mass spectral analyses. ST, NSW, and PJM analyzed the single-cell data. NSW and PJM developed the model. BB, PO, and NSW supervised the research. NSW, BB, ST, JNS, and PJM wrote the manuscript and all authors approved it.
Footnotes
The authors declare that they have no conflict of interest.
References
- Armitage JP (1992) Behavioral-responses in bacteria. Annu Rev Physiol 54: 683–714 [DOI] [PubMed] [Google Scholar]
- Bar-Even A, Paulsson J, Maheshri N, Carmi M, O'Shea E, Pilpel Y, Barkai N (2006) Noise in protein expression scales with natural protein abundance. Nat Genet 38: 636–643 [DOI] [PubMed] [Google Scholar]
- Bassler BL, Greenberg EP, Stevens AM (1997) Cross-species induction of luminescence in the quorum-sensing bacterium Vibrio harveyi. J Bacteriol 179: 4043–4045 [DOI] [PMC free article] [PubMed] [Google Scholar]
- Bassler BL, Wright M, Showalter RE, Silverman MR (1993) Intercellular signaling in Vibrio-harveyi—sequence and function of genes regulating expression of luminescence. Mol Microbiol 9: 773–786 [DOI] [PubMed] [Google Scholar]
- Christian J, Ray J, Igoshin OA (2010) Adaptable functionality of transcriptional feedback in bacterial two-component systems. PLoS Comput Biol 6: e1000676. [DOI] [PMC free article] [PubMed] [Google Scholar]
- Datsenko KA, Wanner BL (2000) One-step inactivation of chromosomal genes in Escherichia coli K-12 using PCR products. Proc Natl Acad Sci USA 97: 6640–6645 [DOI] [PMC free article] [PubMed] [Google Scholar]
- Golding I, Paulsson J, Zawilski SM, Cox EC (2005) Real-time kinetics of gene activity in individual bacteria. Cell 123: 1025–1036 [DOI] [PubMed] [Google Scholar]
- Hammer BK, Bassler BL (2003) Quorum sensing controls biofilm formation in Vibrio cholerae. Mol Microbiol 50: 101–114 [DOI] [PubMed] [Google Scholar]
- Keymer JE, Endres RG, Skoge M, Meir Y, Wingreen NS (2006) Chemosensing in Escherichia coli: two regimes of two-state receptors. Proc Natl Acad Sci USA 103: 1786–1791 [DOI] [PMC free article] [PubMed] [Google Scholar]
- Khan S, Spudich JL, Mccray JA, Trentham DR (1995) Chemotactic signal integration in bacteria. Proc Natl Acad Sci USA 92: 9757–9761 [DOI] [PMC free article] [PubMed] [Google Scholar]
- Kollmann M, Lovdok L, Bartholome K, Timmer J, Sourjik V (2005) Design principles of a bacterial signalling network. Nature 438: 504–507 [DOI] [PubMed] [Google Scholar]
- Lenz DH, Miller MB, Zhu J, Kulkarni RV, Bassler BL (2005) CsrA and three redundant small RNAs regulate quorum sensing in Vibrio cholerae. Mol Microbiol 58: 1186–1202 [DOI] [PubMed] [Google Scholar]
- Long T, Tu KC, Wang Y, Mehta P, Ong NP, Bassler BL, Wingreen NS (2009) Quantifying the integration of quorum-sensing signals with single-cell resolution. PLoS Biol 7: e68 OP [DOI] [PMC free article] [PubMed] [Google Scholar]
- Mao YW, Ge XC, Frank CL, Madison JM, Koehler AN, Doud MK, Tassa C, Berry EM, Soda T, Singh KK, Biechele T, Petryshen TL, Moon RT, Haggarty SJ, Tsai LH (2009) Disrupted in schizophrenia 1 regulates neuronal progenitor proliferation via modulation of GSK3 beta/beta-catenin signaling. Cell 136: 1017–1031 [DOI] [PMC free article] [PubMed] [Google Scholar]
- Mehta P, Goyal S, Long T, Bassler BL, Wingreen NS (2009) Information processing and signal integration in bacterial quorum sensing. Mol Syst Biol 5: 325; DOI: 10.1038/msb.2009.79 [DOI] [PMC free article] [PubMed] [Google Scholar]
- Millar JK, Wilson-Annan JC, Anderson S, Christie S, Taylor MS, Semple CAM, Devon RS, St Clair DM, Muir WJ, Blackwood DHR, Porteous DJ (2000) Disruption of two novel genes by a translocation co-segregating with schizophrenia. Hum Mol Genet 9: 1415–1423 [DOI] [PubMed] [Google Scholar]
- Nadell CD, Xavier JB, Levin SA, Foster KR (2008) The evolution of quorum sensing in bacterial biofilms. PLoS Biol 6: 171–179 [DOI] [PMC free article] [PubMed] [Google Scholar]
- Nevozhay D, Adams RM, Murphy KF, Josic K, Balazsi G (2009) Negative autoregulation linearizes the dose-response and suppresses the heterogeneity of gene expression. Proc Natl Acad Sci USA 106: 5123–5128 [DOI] [PMC free article] [PubMed] [Google Scholar]
- Oleksiuk O, Jakovljevic V, Vladimirov N, Carvalho R, Paster E, Ryu WS, Meir Y, Wingreen NS, Kollmann M, Sourjik V (2011) Thermal robustness of signaling in bacterial chemotaxis. Cell 145: 312–321 [DOI] [PMC free article] [PubMed] [Google Scholar]
- Paulsson J (2004) Summing up the noise in gene networks. Nature 427: 415–418 [DOI] [PubMed] [Google Scholar]
- Pawson CT, Scott JD (2010) Signal integration through blending, bolstering and bifurcating of intracellular information. Nat Struct Mol Biol 17: 653–653 [DOI] [PMC free article] [PubMed] [Google Scholar]
- Pedraza JM, Paulsson J (2008) Effects of molecular memory and bursting on fluctuations in gene expression. Science 319: 339–343 [DOI] [PubMed] [Google Scholar]
- Saltiel AR, Kahn CR (2001) Insulin signalling and the regulation of glucose and lipid metabolism. Nature 414: 799–806 [DOI] [PubMed] [Google Scholar]
- Sambrook J, Fritsch EF, Maniatis T (1989) Molecular Cloning: A Laboratory Manual. Cold Spring Harbor, New York, USA: Cold Spring Harbor Press [Google Scholar]
- Svenningsen SL, Waters CM, Bassler BL (2008) A negative feedback loop involving small RNAs accelerates Vibrio cholerae transition out of quorum-sensing mode. Genes Dev 22: 226–238 [DOI] [PMC free article] [PubMed] [Google Scholar]
- Swem LR, Swem DL, Wingreen NS, Bassler BL (2008) Deducing receptor signaling parameters from in vivo analysis: LuxN/AI-1 quorum sensing in Vibrio harveyi. Cell 134: 461–473 [DOI] [PMC free article] [PubMed] [Google Scholar]
- Taniguchi Y, Choi PJ, Li GW, Chen HY, Babu M, Hearn J, Emili A, Xie XS (2010) Quantifying E-coli proteome and transcriptome with single-molecule sensitivity in single cells. Science 329: 533–538 [DOI] [PMC free article] [PubMed] [Google Scholar]
- Teng SW, Wang YF, Tu KC, Long T, Mehta P, Wingreen NS, Bassler BL, Ong NP (2010) Measurement of the copy number of the master Quorum-sensing regulator of a bacterial cell. Biophys J 98: 2024–2031 [DOI] [PMC free article] [PubMed] [Google Scholar]
- Tu KC, Bassler BL (2007) Multiple small RNAs act additively to integrate sensory information and control quorum sensing in Vibrio harveyi. Genes Dev 21: 221–233 [DOI] [PMC free article] [PubMed] [Google Scholar]
- Tu KC, Long T, Svenningsen SL, Wingreen NS, Bassler BL (2010) Negative feedback loops involving small regulatory RNAs precisely control the Vibrio harveyi quorum-sensing response. Mol Cell 37: 567–579 [DOI] [PMC free article] [PubMed] [Google Scholar]
- Virshup DM, Forger DB (2009) Keeping the beat in the rising heat. Cell 137: 602–604 [DOI] [PubMed] [Google Scholar]
- Waters CM, Bassler BL (2006) The Vibrio harveyi quorum-sensing system uses shared regulatory components to discriminate between multiple autoinducers. Genes Dev 20: 2754–2767 [DOI] [PMC free article] [PubMed] [Google Scholar]
- Yu RC, Pesce CG, Colman-Lerner A, Lok L, Pincus D, Serra E, Holl M, Benjamin K, Gordon A, Brent R (2008) Negative feedback that improves information transmission in yeast signalling. Nature 456: 755–761 [DOI] [PMC free article] [PubMed] [Google Scholar]
- Zhu J, Mekalanos JJ (2003) Quorum sensing-dependent biofilms enhance colonization in Vibrio cholerae. Dev Cell 5: 647–656 [DOI] [PubMed] [Google Scholar]
Associated Data
This section collects any data citations, data availability statements, or supplementary materials included in this article.